Measuring Web site quality improvements: a case
study of the forum on strategic management
knowledge exchange
Stuart J. Barnes
School of Information Management, Victoria University of Wellington,
Wellington, New Zealand
Richard Vidgen
School of Management, University of Bath, Bath, UK
1. Introduction
Aside from the growth of electronic commerce (Cheung, 1998; McManiset al., 2001), the implications of the Web are being felt in many other areas of organization. One such area is electronic government
(e-government). Recently, government services have begun to be provided via the Web in countries such as the USA, UK, Australia, New Zealand, Italy, Singapore and Portugal. In addition, cross-national
organizations such as the Organisation for Economic Cooperation and Development (OECD), World Trade Organisation (WTO), and United Nations have started to develop Web offerings aimed at recipients in many and varied countries. Digital government has huge potential benefits. Government
transcends all sectors of society, and not only provides the legal, political, and economic infrastructure to support other sectors, but also exerts considerable influence on the social factors that add to their development (Elmagarmid and McIver, 2001).
E-government thus has the potential to transform profoundly people’s perceptions of civil and political interactions with their governments. Even though we may see further convergence of e-commerce and e-government services (Kubicek and Hagen, 2001), unlike e-commerce, e-government services must ± in most societies ± be accessible to all. Through the Web, expectations of the service levels that e-government sites must provide have been raised considerably (Cook, 2000).
This research utilizes the WebQual method to assess the quality of a specific
cross-national Web site provided via the OECD ± before and after a process of redesign. The Web site is that of the Forum on Strategic Management Knowledge
Exchange (FSMKE) ± a site relating to international tax policy and administration. WebQual was developed originally as an instrument for assessing user perceptions of the quality of e-commerce Web sites. The instrument has been under development since the early part of 1998 and has evolved via a process of iterative refinement in different e-commerce and e-government domains (e.g. see Barnes and Vidgen, 2001a, b; 2002). Most recently, the instrument has been used in areas of UK and New Zealand government. The method turns qualitative customer assessments into quantitative metrics that are useful for management decision-making. Typically, the tool allows comparisons to be made for the same organization over time or between organizations in an industry.
While e-government can provide
communication, transaction and integration of administrative services, most countries are not making extensive use of the Web. According to the Cyberspace Policy Research Group (CyPRG) the 1999 global average score for information transparency is less than 50 per cent and for interactivity it is less than 25 per cent (La Porteet al., 2001). Although there appears to be less progress with
transaction-based services, a Gartner Research (2001) survey of European countries showed that the demand by citizens for information massively outweighs the demand for interactivity. The offerings examined in this research are quite basic, first or entry level services, provided largely for one-way communication (The Economist, 2000).
The structure of the paper is as follows. In the next section we describe the background to the research and the methodology used. Section three reports the data analysis and preliminary findings, which are then discussed and interpreted in section four.
The Emerald Research Register for this journal is available at h ttp://w ww .emeraldinsight.com/researchregister
The current issue and full text archive of this journal is available at http://w w w .em eraldinsight.com /0263-5577.h tm Industrial Management &
Data Systems 103/5 [2003] 297-309 #MCB UP Limited [ISSN 0263-5577]
[DOI 10.1108/02635570310477352] Keywords
Web sites, Quality, Benchmarking, Assessment, Case studies, Government
Abstract
Finally, the last section draws some conclusions.
2. Research design
In this section we describe how the WebQual survey was designed and conducted. In particular, we explicate the tools and techniques for data collection and analysis.
2.1. Background to the research project
A project to evaluate the quality of the Forum on Strategic Management Knowledge Exchange (FSMKE) Web site was initiated by the Tax Management Research Network in the early part of 2001. TMRnet is a network of academic researchers and tax practitioners that was launched in 2000 to undertake joint research related to the interface between national tax policy and the practical management of national tax regimes. The aim is to further understanding of how to manage taxation departments: that is to improve tax administration and customer service, including the exploration of opportunities afforded by new technologies, such as the Internet. The TMRnet Steering Group includes academics from theUniversities of Bath and Nottingham, senior members of the UK Inland Revenue and HM Customs and Excise and members of the Fiscal Affairs Division of the OECD.
The evaluation of the FSMKE Web site was undertaken using the WebQual instrument developed at the University of Bath. The assessment was carried out in two parts. The FSMKE Web site was first evaluated in April to May 2001 and then, following a Web site redesign exercise, the new site was
re-evaluated in the period July to September 2001. In this paper we present the results of the evaluation and compare perceptions of the FSMKE Web site before and after the redesign exercise. The quantitative results produced through analysis of the WebQual data are supplemented by qualitative comments of the respondents to provide triangulation of the results and a deeper insight into user attitudes.
2.2. The WebQual instrument
WebQual is based on quality function deployment (QFD), which is a:. . .structured and disciplined process that provides a means to identify and carry the voice of the customer through each stage of product and or service development and implementation (Slabey, 1990).
Applications of QFD start with capturing the ``voice of the customer’’ ± the
articulation of quality requirements using
words that are meaningful to the customer. These qualities are then fed back to customers and form the basis of an evaluation of the quality of a product or service. WebQual differs from studies that emphasise site characteristics or features (Kim and Eom, 2002), which are used as part of later processes in QFD. In the context of WebQual, Web site users are asked to rate target sites against each of a range of qualities using a seven-point scale. The users are also asked to rate each of the qualities for importance (again, using a seven-point scale), which helps gain understanding about which qualities are considered by the user to be most important in any given situation. Although the qualities in WebQual are designed to be subjective, there is a significant amount of data analysis using quantitative techniques, for example, to conduct tests of the
reliability of the WebQual instrument. WebQual has been under development since 1998 and has undergone numerous iterations. The development of WebQual is discussed fully elsewhere (see Barnes and Vidgen, 2001a, b; 2002). WebQual 4.0, as shown in Table I, draws on research from three core areas:
1 information quality from mainstream IS research (e.g. Bailey and Pearson, 1983; Stronget al., 1997);
2 interaction and service quality from marketing, e-commerce and IS service quality research (e.g. Bitneret al., 2000; Jarvenpaaet al., 2000; Pittet al., 1995; Zeithamlet al., 1990); and
3 usability from human-computer interaction (e.g. Davis, 1989; Nielsen, 2000).
Notwithstanding, we have used quality workshops at every stage of WebQual’s development to ensure that the qualities were relevant, particularly where they relate to pre-Internet literature and new
organizational or industrial settings. The standard WebQual 4.0 instrument contains 23 questions. The FSMKE site is characterized as information-intensive. It was therefore decided to remove three questions from the WebQual instrument that related to personal information and
transactions:
1 17: It feels safe to complete transactions. 2 18: My personal information feels secure. 3 22: I feel confident that goods/services will
be delivered as promised. As a result, the WebQual instrument contained 20 questions.
[ 298 ]
Stuart J. Barnes and Richard Vidgen
Measuring Web site quality improvements: a case study of the forum on strategic management knowledge exchange
Industrial Management & Data Systems
2.3. The evaluation process
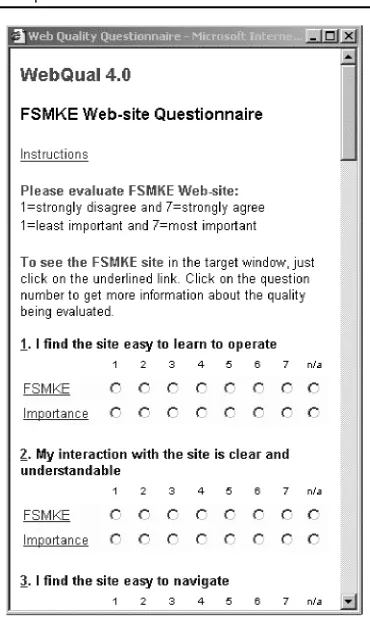
The survey of Web site quality for FSMKE was conducted using an Internet-based questionnaire. The home page of the questionnaire had instructions and
guidelines for completion of the instrument. The home page would then open a separate window (control panel) containing the Web site qualities to be assessed (see Figure 1). The control panel allowed the user to switch the contents of the target window between the instruction page, the FSMKE Web site, and the quality dictionary. Having the quality dictionary online and linked to the question number made it easy to get more details of a particular quality. Users were asked to rate the FSMKE site for each quality using a scale ranging from one (strongly disagree) to seven (strongly agree). Users are also asked to rate the importance of the quality to them, again using a one (least important) to seven (most important).
The first phase of the evaluation was conducted in the period April to May 2001 and resulted in 65 questionnaire responses. The original Web site is shown in Figure 2. The second phase, conducted in August to September of 2001 after the Web site redesign, resulted in 59 responses. The redesigned site is illustrated in Figure 3. Demographic and other respondent information are shown in Table II. The respondents were typically experienced and intensive users of the Internet, although not intensive or
experienced users of the FSMKE Web site. The majority of respondents were also male, of typical working age, but located in a Table I
The WebQual 4.0 instrument
C ate g ory W ebQ ual 4 .0 questions
U sability 1 . I find the site ea sy to learn to operate
2 . M y interac tion w ith the site is clear an d understa ndab le 3 . I find the site ea sy to na vig ate
4 . I find the site ea sy to use
5 . The site h as a n a ttra ctive a ppearan ce 6 . The d esig n is a ppro priate to the type of site 7 . The site c onvey s a sen se o f com petency 8 . The site c re ates a positiv e experienc e for m e
Inform ation qua lity 9 . P rovid es accu ra te inform atio n 1 0 . P rovides believa ble info rm ation 1 1 . P rovides tim e ly inform a tion 1 2 . P rovides rele van t inform a tion
1 3 . P rovides easy to und erstand in form ation 1 4 . P rovides in form a tion at the rig ht lev el of de tail 1 5 . P resen ts the inform ation in an approp riate form at
S ervice interaction 1 6 . H as a g ood rep utation
1 7 . It feels safe to com p lete trans actions 1 8 . M y perso nal inform a tion feels sec ure 1 9 . C reates a sen se o f perso nalizatio n 2 0 . C onv ey s a sense of c om m u nity
2 1 . M ak e s it ea sy to com m unicate w ith the org anization
2 2 . I feel c onfide nt th at go ods/ serv ices w ill be delive red as p rom ised
O ve rall 2 3 . O ve ra ll vie w of th e W eb site
Figure 1
The questionnaire interface
Stuart J. Barnes and Richard Vidgen
Measuring Web site quality improvements: a case study of the forum on strategic management knowledge exchange
Industrial Management & Data Systems
variety of FSMKE countries, particularly Japan, Australia, the UK and Canada.
3. Analysis and discussion of the
results
The data collected before and after site redesign are summarized in Tables III and IV. Note that at this stage, we have not presented any categories for the questions (this is discussed below). The importance scores give the average importance ranking for each question, in each time period (``T1’’ refers to the phase before site redesign and ``T2’’ to the phase after site redesign), based on all of the responses. In addition, the per question average scores for each of the classifications is given along with the standard error of the mean.
3.1. Perceptions of importance
Referring to Table III, we see someinteresting patterns in the data. In terms of the importance ratings of particular
questions, there are some useful groupings to note. Let us consider the perceptions of important qualities both before and after the redesign of the site.
Before site redesign
Overall, those questions considered most important, e.g. above upper quartile of 5.88, are all about ease of use and accurate, trusted and pertinent information. Here we find, in descending order of importance, questions 9, 10, 12, 1 and 4. At the other end of the spectrum, those questions considered least important, e.g. below the overall 5.20 lower quartile, are based around the ``look and feel’’ of the site in terms of user empathy and site design. Specifically, questions 17, 18, 5, 6 and 19 are in ascending order of importance. Other questions are in between, and the median is 5.49.
The results suggest that there are specific priorities in the qualities demanded from the FSMKE Web site by users. Getting easy access to ``good’’ information appears paramount, whilst certain other aspects that may be important for some commercial sites, such as building a networked community experience for users to return to, are not so important. Intuitively, such trends make sense, particularly when we consider that the primary focus seems to be on information-orientation rather than business
transactions. Figure 2
The FSMKE site prior to redesign
[ 300 ]
Stuart J. Barnes and Richard Vidgen
Measuring Web site quality improvements: a case study of the forum on strategic management knowledge exchange
Industrial Management & Data Systems
After site redesign
Once site redesign was completed, the resultant data on site quality yield some similar importance rankings. However, there were some changes in priorities for questions at the margins. Overall, question 1 slips out of the upper quartile range (6.07 and above), whilst questions 11 and 13 are added. At the other end of the scale, question 6 is promoted from the lower quartile (5.28), whilst question 16 now falls into this zone. Notwithstanding, the picture remains the same, with important questions all referring to ``good’’ information and the ease of use of the site. The least important questions refer to soft issues of service, empathy and aesthetics.
3.2. Weighted scores and the WebQual
index
Overall, the ratings of the redesigned site appear consistently higher than that of the original. However, for the raw data, it is difficult to see where the perceptions have changed most (especially in the context of the areas of quality considered most important). The importance ratings filter through to the weighted results of the data set. Unweighted
results for individual questions in Table III shows some varying results. Weighted results serve to accentuate these differences in the direction of user priorities. These are shown in Table IV.
One key aim of this approach is to achieve some overall quality rating for the Web site so that we may benchmark the effect of site redesign. Total average scores for the unweighted data showed an overall increase of 24.43, from 78.93 to 103.36. Weighting these scores by the importance ratings provides a similar picture, with the total average weighted score increasing from 421.52 to 569.54.
Unfortunately, the total scores make it difficult to give a standard benchmark for the two Web sites. One way to achieve this is to index the total weighted score for each site against the total possible score in that time period (i.e. the total importance for all questions multiplied by seven, the maximum rating for a site). The result is expressed as an index from zero to one (which, when multiplied by 100, may also be considered as a percentage). A summary of these
calculations and totals are given in Table IV. Figure 3
The FSMKE site after redesign
Stuart J. Barnes and Richard Vidgen
Measuring Web site quality improvements: a case study of the forum on strategic management knowledge exchange
Industrial Management & Data Systems
Overall, we can see quite clearly that the redesigned site is benchmarked well above the original site, increasing by 20 per cent in the WebQual Index (WQI) from 58 per cent to 78 per cent. However, perhaps more
interesting is some assessment of how the Web sites differ in quality. To this end, the next section uses a number of reliable sub-groupings and applies them to the analysis.
3.3. Analysing the differences in the sites
The data indicates that the new Web site surpasses the old in terms of WebQual site quality. Here we examine where these perceived improvements have occurred.Previous research for WebQual has led to a number of valid and reliable question
subgroupings. Briefly, in the adapted WebQual 4.0 instrument used in this research they can be explained as follows (question numbers in brackets as per Table IV):
Usability(questions 1 to 4). Qualities associated with site usability; for example, ease of use and navigation. Design(questions 5 to 8). Qualities associated with site design; for example, appearance and the image conveyed to the user.
Information quality(questions 9 to 15). The quality of the content of the site: the suitability of the information for the user’s purposes, e.g. accuracy, format and relevancy.
Table II
Respondent demographics and experience
Q ue stion R espo nse B efore (% ) A fter (% )
C ou ntry of o rig in A u stra lia 2 9 .0 2 5 .6
C ana da 1 6 .2 7 .0 D enm ark 0 .0 0 .0 E ire 0 .0 0 .0 Japan 2 7 .4 3 1 .6 N ethe rland s 0 .0 5 .2 U nite d K ing do m 1 4 .5 1 2 .3 U nite d S tates 0 .0 0 .0 O ther 1 2 .9 1 9 .3
S ex M ale 6 7 .2 7 1 .9 Fe m ale 3 2 .8 2 8 .1
A ge U nde r 2 6 6 .8 3 .7 2 6 to 3 5 2 2 .0 2 4 .1 3 6 to 4 5 5 0 .9 4 6 .3 4 6 to 5 5 2 0 .3 2 5 .9 O ver 5 5 0 .0 0 .0
Internet e xperience Less than 6 m onth s 0 .0 1 .8
6 m onths to 1 year 1 .7 0 .0 1 to 2 years 1 6 .6 8 .9 2 to 3 years 1 6 .7 2 1 .4 M ore than 3 ye ars 6 5 .0 6 7 .9
Internet u sa g e Less than onc e a m onth 1 .7 0 .0
O nce a m o nth 1 .6 0 .0 O nce a fortnigh t 1 .7 0 .0 O nce a w eek 1 0 .0 2 1 .4 Tw o or th re e tim e s a w e ek 1 .7 3 .6 O nce a da y 1 8 .3 2 1 .4 M ore than on ce a day 6 5 .0 5 3 .6
F S M K E ex perien ce Less than 3 m onth s 7 0 .7 4 5 .3
3 to 6 m onths 8 .6 1 8 .9 6 m onths to 1 year 8 .6 1 8 .8 1 to 2 years 1 0 .4 1 3 .2 M ore than 2 ye ars 1 .7 3 .8
F S M K E usa ge Less than eve ry three m onth s 5 4 .5 2 7 .5
O nce e very three m on ths 1 8 .2 2 7 .5 O nce a m o nth 1 2 .8 2 1 .6 O nce a w eek 3 .6 3 .9 Tw o or th re e tim e s a w e ek 7 .3 1 3 .7 D aily 3 .6 7 .8
[ 302 ]
Stuart J. Barnes and Richard Vidgen
Measuring Web site quality improvements: a case study of the forum on strategic management knowledge exchange
Industrial Management & Data Systems
Table III
Summary of the data ± mean, standard error and standard deviation
Im p ortance (T 1 ) Be fore Im po rta nce (T2 ) A fter
N o. D escrip tion M ean S t. err. S t. dev. M ean S t. err. S t. dev. M e an S t. e rr. S t. dev. M e an S t. e rr. S t. dev.
1 I fin d the site easy to learn to ope ra te 5 .9 4 0 .1 6 1 .2 7 4 .2 9 0 .2 1 1 .6 8 6 .0 5 0 .1 4 1 .0 6 5 .7 3 0 .1 2 0 .9 4
2 M y in te raction w ith the site is clear and und ersta ndab le 5 .4 9 0 .1 9 1 .5 5 4 .0 3 0 .2 0 1 .6 2 5 .8 0 0 .1 4 1 .0 8 5 .3 7 0 .1 4 1 .0 7
3 I fin d the site easy to navig ate 5 .8 7 0 .1 9 1 .5 4 3 .8 5 0 .2 3 1 .8 6 6 .0 7 0 .1 3 0 .9 6 5 .5 1 0 .1 5 1 .1 8
4 I fin d the site easy to use 5 .8 9 0 .1 8 1 .4 9 3 .8 5 0 .2 3 1 .8 2 6 .2 0 0 .1 2 0 .9 4 5 .4 6 0 .1 6 1 .2 1
5 Th e site has an attractive appea ran ce 4 .9 4 0 .1 7 1 .4 0 3 .7 8 0 .1 9 1 .5 7 5 .1 5 0 .2 0 1 .5 1 5 .1 9 0 .1 8 1 .3 7
6 Th e desig n is app ro priate to the typ e of site 5 .0 2 0 .1 7 1 .3 9 3 .8 8 0 .2 2 1 .7 2 5 .3 1 0 .1 9 1 .4 5 5 .5 0 0 .1 6 1 .2 3
7 Th e site conve ys a sense of co m peten cy 5 .3 4 0 .1 8 1 .4 2 3 .9 7 0 .1 9 1 .5 3 5 .5 9 0 .1 7 1 .3 4 5 .3 9 0 .1 4 1 .0 8
8 Th e site creates a positive exp erienc e for m e 5 .3 1 0 .1 8 1 .4 3 3 .6 0 0 .2 2 1 .7 2 5 .4 7 0 .1 5 1 .1 2 5 .0 7 0 .1 8 1 .3 6
9 P rivides acc urate inform ation 6 .4 5 0 .1 6 1 .2 6 4 .1 8 0 .2 5 1 .7 5 6 .4 0 0 .1 3 1 .0 0 5 .5 0 0 .1 6 1 .1 5
1 0 P rovides believab le inform a tion 6 .3 0 0 .1 6 1 .3 2 5 .0 2 0 .2 2 1 .6 5 6 .3 9 0 .1 4 1 .0 5 5 .7 5 0 .1 4 1 .0 8
1 1 P rovides tim ely inform a tion 5 .7 7 0 .2 1 1 .6 4 3 .8 0 0 .2 4 1 .7 0 6 .0 7 0 .1 3 1 .0 2 4 .8 5 0 .1 9 1 .3 8
1 2 P rovides rele vant in form a tion 6 .0 6 0 .1 6 1 .2 6 4 .2 5 0 .2 0 1 .5 2 6 .1 9 0 .1 3 1 .0 3 5 .1 4 0 .1 8 1 .4 1
1 3 P rovides easy to und ersta nd info rm ation 5 .8 2 0 .1 6 1 .3 1 4 .2 0 0 .2 0 1 .5 7 5 .8 1 0 .1 4 1 .0 7 5 .1 7 0 .1 5 1 .1 5
1 4 P rovides inform ation at the rig ht le vel of d etail 5 .6 1 0 .1 7 1 .3 2 4 .0 2 0 .2 2 1 .5 9 5 .7 3 0 .1 3 0 .9 8 5 .0 2 0 .1 8 1 .3 6
1 5 P resen ts the info rm ation in an appropria te form at 5 .3 5 0 .1 6 1 .3 3 4 .4 0 0 .1 9 1 .5 0 5 .6 1 0 .1 6 1 .2 2 5 .2 4 0 .1 6 1 .2 4
1 6 H as a g ood repu tation 5 .2 6 0 .2 2 1 .6 3 3 .3 1 0 .3 1 1 .8 3 5 .2 5 0 .2 4 1 .7 6 4 .6 8 0 .2 3 1 .4 7
1 7 C reates a sen se of persona lisation 4 .1 1 0 .2 0 1 .4 8 2 .8 4 0 .2 0 1 .5 0 3 .8 4 0 .2 3 1 .6 8 3 .8 9 0 .2 2 1 .6 3
1 8 C onv eys a sense of com m un ity 4 .3 5 0 .1 9 1 .5 1 3 .6 7 0 .2 2 1 .7 0 4 .5 9 0 .2 4 1 .7 4 4 .7 2 0 .2 0 1 .4 5
1 9 M ak es it easy to com m unicate w ith the org anization 5 .1 4 0 .2 0 1 .5 9 4 .1 7 0 .2 1 1 .6 6 5 .1 0 0 .1 7 1 .3 2 4 .9 5 0 .1 8 1 .3 7
2 0 W hat is your ove rall view of this W eb site ± ± ± 3 .8 3 0 .1 9 1 .5 6 ± ± ± 5 .2 4 0 .1 4 1 .0 8
[
3
03
]
St
uart
J.
Bar
ne
s
and
Richa
rd
Vi
dgen
Meas
uring
Web
site
quali
ty
improvement
s:
a
cas
e
st
udy
of
the
for
um
on
s
tr
ategi
c
management
know
ledg
e
exchange
Indus
tr
ial
Manag
ement
&
Data
Sys
tems
103/
5
[2003]
Table IV
Weighted scores and WebQual indices ± before and after redesign
B efore A fter
N o. D escription M ax . score (T1 ) W g t. score W QI M a x. sco re (T2 ) W gt. score W Q I
1 I find the site easy to lea rn to o perate 4 1 .5 6 2 6 .2 3 0 .6 3 4 2 .3 6 3 5 .0 7 0 .8 3
2 M y interaction w ith the site is c lear an d understanda ble 3 8 .4 5 2 2 .8 8 0 .6 0 4 0 .5 8 3 1 .5 4 0 .7 8
3 I find the site easy to nav ig ate 4 1 .1 1 2 4 .0 0 0 .5 8 4 2 .4 7 3 3 .9 3 0 .8 0
4 I find the site easy to use 4 1 .2 5 2 3 .3 1 0 .5 7 4 3 .4 2 3 4 .1 7 0 .7 9
5 The site has an attractive ap pearan ce 3 4 .5 7 1 8 .7 5 0 .5 4 3 6 .0 7 2 7 .5 9 0 .7 7
6 The design is a ppropria te to the type of site 3 5 .1 1 1 9 .4 0 0 .5 5 3 7 .1 7 3 0 .2 9 0 .8 1
7 The site con veys a sense of com pe te nc y 3 7 .4 1 2 1 .2 5 0 .5 7 3 9 .1 5 3 0 .7 5 0 .7 9
8 The site crea te s a p ositive e xperie nc e for m e 3 7 .1 5 1 9 .2 4 0 .5 2 3 8 .3 2 2 8 .3 8 0 .7 4
9 P rivide s accurate inform ation 4 5 .1 7 2 6 .8 4 0 .5 9 4 4 .8 2 3 5 .6 1 0 .7 9
1 0 P ro vides belie vable inform ation 4 4 .0 8 3 2 .2 6 0 .7 3 4 4 .7 3 3 7 .1 4 0 .8 3
1 1 P ro vides tim ely info rm ation 4 0 .4 2 2 1 .7 6 0 .5 4 4 2 .4 8 3 0 .0 0 0 .7 1
1 2 P ro vides re levan t info rm ation 4 2 .4 4 2 5 .7 3 0 .6 1 4 3 .3 1 3 2 .1 2 0 .7 4
1 3 P ro vides easy to u ndersta nd inform atio n 4 0 .7 1 2 4 .6 5 0 .6 1 4 0 .6 9 3 0 .5 3 0 .7 5
1 4 P ro vides inform ation at the rig ht level o f detail 3 9 .2 5 2 3 .0 6 0 .5 9 4 0 .1 0 2 9 .2 4 0 .7 3
1 5 P re sents the inform atio n in an ap propriate fo rm at 3 7 .4 8 2 4 .0 8 0 .6 4 3 9 .2 7 3 0 .3 7 0 .7 7
1 6 H as a g oo d reputatio n 3 6 .8 5 1 5 .7 7 0 .4 3 3 6 .7 2 2 5 .7 6 0 .7 0
1 7 C re ates a sense of p erso nalisatio n 2 8 .7 4 1 2 .0 5 0 .4 2 2 6 .8 5 1 7 .3 4 0 .6 5
1 8 C onvey s a sen se of com m u nity 3 0 .4 8 1 7 .5 1 0 .5 7 3 2 .1 5 2 3 .4 4 0 .7 3
1 9 M ak es it e asy to c om m unicate w ith the org anization 3 5 .9 8 2 2 .7 5 0 .6 3 3 5 .7 1 2 6 .2 7 0 .7 4
Totals 7 2 8 .1 9 4 2 1 .5 2 0 .5 8 7 4 6 .3 9 5 6 9 .5 4 0 .7 8
[
3
0
4
]
St
uart
J.
Bar
ne
s
and
Richa
rd
Vi
dgen
Meas
uring
Web
site
quali
ty
improvement
s:
a
cas
e
st
udy
of
the
for
um
on
s
tr
ategi
c
management
know
ledg
e
exchange
Indus
tr
ial
Manag
ement
&
Data
Sys
tems
103/
5
[2003]
Service quality(questions 16 to 19). The quality of the service interaction
experienced by users as they delve deeper into the site, embodied by trust and empathy; for example, issues of reputation, personalization and communication with the site owner. To these groupings one question is added to test the convergent validity of the scale (question 20).
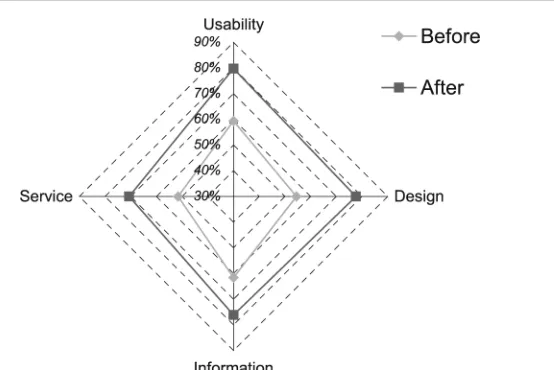
These categories provide some useful criteria by which to assess the Web sites before and after redesign. Using the question groupings, we can build a profile of an individual Web site that is easily compared to others. We are now in a position to examine why the redesigned site fared better than the original site on the WebQual Index. Figure 4 gives an example of how this can be achieved.
As a starting point, the data was summarised around the questionnaire subcategories. Then, and similarly to the WebQual Index in Table IV, the total score for each category was indexed against the maximum score (based on the importance ratings for questions multiplied by 7). Figure 4 is the result, which rates the two Web sites using these criteria. Note that the scale has been adjusted to between 30 per cent and 90 per cent to allow for clearer comparison. Clearly the new site is rated head and shoulders above its predecessor, making a substantial square around the diamond of the old site.
Figure 4 demonstrates that each site has its own strengths and weaknesses, as measured through the voice of the user or customer, although the general pattern of these is similar. As we can see, most improved in the new site are usability and design ± up 20 per
cent and 23 per cent respectively. Close behind is service ± up 19 per cent. Least improved is information quality ± the highest rated quality before site design ± although still up 15 per cent. Apparently, the new site has greater ease of use and more aesthetic appeal, with better service and access to information.
3.4. Differences in perceptions among
respondent groups
In absolute terms, whilst the new site has most categories rating quite highly at between 76 per cent and 80 per cent, one is still low in absolute terms ± service (71 per cent). This indicates that although this area is vastly improved, there is still considerable work to be done in building relationships with users. This result is also borne out in an analysis of variance of the data by the country of respondent (with Bonferroni correction). Although the samples are not large, the test reveals some significant discrepancies in the views of different FSMKE members. For the original site, questions 1, 4, 13 and 19 indicated significant differences between the views of UK users, Japan and Others at the 5 per cent level. These questions are varied, indicating differences in terms of ease of use, understanding information, and ease of communication within FSMKE. This may indicate some cultural and language issues associated with the original site, as well as regional variations in site use and
contribution.
For the redesigned site, significant differences were revealed between the views of Australian users, Japan and Others for questions 2, 3, 7 and 15. These are different questions to those involving differences in perceptions for the first site. However, they are likely to be indicative of the changing perceptions of individuals in the various member countries. One of the areas of disagreement is ease of use/navigation, which was also an area of difference for the original site. Other areas are competency and information format. Again this could point to some clear differences in the interpretation of the site by different national identities, both in terms of cognitive issues of language and culture, and differences in expectations, interaction and commitment of the various members. Further, this is underlined by the assessment of the two sites by the same respondents ± more than 50 per cent evaluated both sites.
Overall, the results point to some apparent differences in perceptions among FSMKE member countries. This obviously has implications for the difficulties in designing Figure 4
Radar chart of WebQual subcategories before and after site redesign
Stuart J. Barnes and Richard Vidgen
Measuring Web site quality improvements: a case study of the forum on strategic management knowledge exchange
Industrial Management & Data Systems
a multinational Web site that appeals to all FSMKE member countries. Some of these issues are surfaced more clearly in the qualitative results.
3.5. Qualitative data
Qualitative customer feedback was collected via open comments submitted as part of the questionnaire (Sampson, 1998). At an interpretive level, many of the features drawn out in the quantitative findings are supported in the qualitative data drawn from the open comments of respondents. This also adds richness and helps to explain the ``why?’’ behind some of these patterns in the quantitative data.
Before site redesign
As indicated in Figure 4, numerous areas were open to criticism in the initial FSMKE Web site. In terms of site design and usability, broken links, difficult navigation and aesthetics appeared common complaints. Comments included:
There is a broken link on Customs page Dutch Tax & Customs Admin. There are too many stages to drill down; the rule of three in navigation is broken. The site looks poor because of the bad choice of serif fonts i.e. it looks like a typed document. The navigation gif is not cached and at times takes more than 8 seconds to rendering full ± the turn off time for most users. Can this be compressed further or sliced so that it is rendered quickly in the browser.
The site is completely text based. There are few pictures. There could be more pop up screens or interesting features such as moving reminder banners or something with more pizzazz. This should be a showpiece and isn’t. Given the subject matter, I would have expected more imagination and technology woven into the site.
Far too many areas where links lead me to no content. This creates a very negative impression. Why have links leading nowhere?
Broken links, and Times Roman fonts are not good!
Not a bad effort but make it more attractive. I found the site bland and boring. (Sorry. It is not a site I would use unless I absolutely had to.) The information/content seemed to be good, and interesting, but I wasn’t enticed to stay or visit again.
The quality of the content provided was another concern, with a number of
respondents criticising the volume, language translation, relevance and currency of material:
Also, all documents should be fully translated. There is no point putting in documents that not everyone can read. Best
practices should be available to all, not just the select few who can read and understand the language.
I could not read Asian Languages.
A lot of the content appears dated. I did not find all titles very helpful ± e.g. where would I find Internet initiatives?
I could not find any information that I searched for in the 15 minutes I used the site. Every time, the results turned out ``0 documents met your search criteria’’. Maybe it was just my back luck that the topics I selected had no documents input as of yet. I also found that there were a lot of very broad topics (such as ``advice’’ or ``reporting’’ or ``research’’ which I didn’t find too helpful in selecting what to search. I hope there will be more info on Information Management specific practices, as there doesn’t seem to be anything yet. I also found that there were a lot of acronyms with which I was not familiar. There were fewer comments on the service aspects of the site, partly because
respondents saw this area as less important. However, some respondents clearly thought service aspects such were lacking; there were criticisms regarding the purpose of the site, participation of members and value for the individual. Comments included:
From a personal point of view it is somehow difficult to determine, where exactly one can find the value added for tax administrations by this open, none secure Web site.
The ranking of the site suffers in many of the questions because of content. There is not a lot of participation so it reflects negatively on credibility. For example the trade agreements search shows up the 2 same IRS documents for any country searched. Another weakness is the content provided often seems to be statements of intent or principal that provide no guidance or real insight. Other documents are of real interest however.
In principle the ideas are sound. However, I am not clear what knowledge is being exchanged, why or what it is hoped to get out of the site.
In dire need of cohesion, updating and a sense of purpose.
After site redesign
Once the new Web site had been completed, the comments were more upbeat, although it was evident that respondents still thought that there was considerable room for improvement. In terms of site design comments included:
Great site. Love the colours.
The structure, design, and format of the site is good; however, the crucial question is whether it will be maintained and kept up-to-date.
Much improved site. [ 306 ]
Stuart J. Barnes and Richard Vidgen
Measuring Web site quality improvements: a case study of the forum on strategic management knowledge exchange
Industrial Management & Data Systems
Will use the site more frequently after this experience.
Site is much improved, and I expect it to continue to evolve and get better.
The design, organization and navigation of the site are good. With a little more exposure to it I feel I could very easily find what I need. Overall, there were fewer negative
comments. Those that were made
emphasized the room for improvement in the visual elements and navigation links:
A great improvement since last time ± but needs more coherence and better labelling of themes.
The globe of the Earth on the home page is not at the correct angle, it needs to tilt another 90 degrees.
I want the link in the FSMKE site to be more directly accessible to the contents related (e.g. not to the top page of homepage).
In terms of the quality of information, there was a general feeling that this had improved, but that more information was needed to create a really valuable resource. The translation engine was also mentioned as problematic for complex tax terminology. For example, respondents suggested:
The reason I assigned an overall poor mark to the site is because content is weak. There seems to be ± from my limited perusing of the site ± items which fall into several categories. Press release, conceptual papers, and program samples (for particular population subsections). Unfortunately the first two types are already widely distributed and there is limited value in them. The third type is more interesting (actual work being done) but navigating through the actual sites of the relevant home country provides better context and a more complete picture. The quality of what I found was good, and useful, but only few countries are
represented. Hope that that will improve. This was my first look at FSMKE; I will definitely be using it often in the future. Great improvement from previous version. Translation engines are not sophisticated enough to translate tax terms.
Although service had improved on the WebQual Index, some individuals still considered that there were significant differences regarding the offerings of individual member countries:
Noticeable that UK does not seem to have contributed much compared with Canada and Norway.
To be a credible source much more
information is needed. Also better coverage. For example, in my own current work area (construction industry compliance/contract payments) there are numerous documents
available from (amongst other countries) Australia, Germany, USA, Canada, UK, and other places, but only some of the Canadian material appears on the site. You might want to consider asking industry/functional specialists attached to particular fiscs to provide some sort of editorial support.
4. Discussion and
recommendations
User perceptions of the FSMKE Web site following the redesign project indicate that quality has improved significantly. The WebQual Index has increased by 20 points from 58 per cent to 78 per cent. This quantitative improvement is supported by analysis of the comments made by respondents when completing the questionnaire. The comments provided richer insight into the assessment of the original site, fleshing out the quantitative evaluation in terms of the weaknesses in particular areas, such as site design and usability (especially broken links, difficult navigation and aesthetics), information quality (especially volume, language translation, relevance and currency) and service quality (especially purpose of the site, participation of members and value for the individual). After redesign, the qualitative analysis provides strong support for the improvement of the site in the various areas of quality, and areas where further
improvement is desirable.
The importance ratings assigned by respondents show that their primary concern is with accurate, believable, and relevant information from a Web site that is easy to use. However, information quality is the least improved dimension (15 per cent) ± this is an area for future development of the site that needs attention.
The site also ranked less highly in terms of empathy and community aspects. An area of development to be considered is
personalization (e.g. user registration) and secure areas for download. This would have the added benefit of allowing more content to be made available and help to improve perceptions of information quality. Comments suggested that adequate availability of content from member
countries and language translation was still a barrier.
Related to the last point, the third area for consideration is community and knowledge sharing. The site does not promote
knowledge sharing other than at the level of document sharing, i.e. it is, strictly speaking, a FSM Data Exchange. Knowledge sharing could be enhanced through the building of an Stuart J. Barnes and
Richard Vidgen
Measuring Web site quality improvements: a case study of the forum on strategic management knowledge exchange
Industrial Management & Data Systems
online community and the addition of facilities such as forums, promoting greater interaction between members and the sharing of best practices.
5. Conclusions
Through the Web, expectations of the service levels that e-government sites must provide have been raised considerably. Online e-government organizations are becoming ever more aware of the need to improve their offerings. This paper has shown how one cross-national e-government organization ± an OECD forum for strategic tax policy and administration ± has done just that. The analysis, using the WebQual instrument, has shown how the organization’s Web site has improved and also identified areas where there is still room for improvement. Such surveys are an important aspect of benchmarking. Indeed, they should be conducted regularly, especially when redesigns take place or major shifts in the environment occur which undermine the underlying basis for a Web site offering (e.g. when a related site is launched or when a significant new technology appears). WebQual also provides a powerful,
user-centred starting point for requirements engineering in Web site development.
Furthermore, Web sites are complex artefacts, often with multiple classes of user. Therefore, a Web site redesign affects many stakeholders. In our sample we collected data from a variety of FSMKE members. The multi-stakeholder analysis of the Web site redesign in this case has helped to enhance understanding on how quality is perceived differently among different groups rather than treating all site users as a homogeneous group. The perspectives of the range of international members emphasize the importance of a full understanding of how all users interact with the site when attempting redevelopment; an improvement for one group might be perceived as a lessening in quality for another group.
Although the findings are limited by the relatively small sample size, the research does provide some initial exploratory insights into an emerging area that has had little attention in the IS literature
± evaluating the quality of cross-national e-government Web sites. Notwithstanding, it would also be valuable to conduct the WebQual survey using a wider sample of the sites’ user bases in order to access a wider population and to evaluate users who have interacted with the sites over a period of time. The findings point toward the need for
systematic research into differences among international group members, particularly with regard to expectations, cultural variations, language, level of use and interaction, and commitment to the FSMKE, and the impact on the perception of Web site quality. It would be foolhardy to assume that what works in one national or cultural sitting will transfer directly into another and provide the same user perceptions or compete directly with local or localised Web offerings.
References
Bailey, J.E. and Pearson, S.W. (1983),
``Development of a tool for measuring and analyzing computer user satisfaction’’,
Management Science, Vol. 29 No. 5, pp. 530-44. Barnes, S.J. and Vidgen, R.T. (2001a), ``An
evaluation of cyber-bookshops: the WebQual method’’,International Journal of Electronic
Commerce, Vol. 6 No. 1, pp. 11-30.
Barnes, S.J. and Vidgen, R.T. (2001b), ``Assessing the quality of auction Web sites’’,Proceedings of the Hawaii International Conference on Systems Sciences, Maui, HI, 4-6 January. Barnes, S.J. and Vidgen, R.T. (2002), ``An
integrative approach to the assessment of e-commerce quality’’,Journal of Electronic Commerce Research, Vol. 3 No. 3.
Bitner, M.J., Brown, S.W. and Meuter, M.L. (2000), ``Technology infusion in service encounters’’,
Academy of Marketing Science, Vol. 28 No. 1,
pp. 138-49.
Cheung, W. (1998), ``The use of the World Wide Web for commercial purposes’’,Industrial
Management & Data Systems, Vol. 98 No. 4,
pp. 172-7.
Cook, M.E. (2000), ``What citizens want from e-government’’, available at:www.ctg.albany. edu/resources/htmlrpt/e-government/what_ citizens_want.html (accessed 9 August 2001). Davis, F. (1989), ``Perceived usefulness, perceived
ease of use, and user acceptance of information technology’’,MIS Quarterly, Vol. 13 No. 3, pp. 340-51.
(The)Economist(2000), ``No gain without pain’’, available at:www.economist.com/display Story.cfm?Story_ID=80764(accessed 25 June, 2001).
Elmagarmid, A.K. and McIver, W.J. (2001), ``The ongoing march toward digital government’’,
IEEE Computer, Vol. 34 No. 2, pp. 32-8. Gartner Research (2001),E-Government: What Are
Citizens Really Looking For?, Gartner Research, London.
Jarvenpaa, S.L., Tractinsky, N. and Vitale, M. (2000), ``Consumer trust in an Internet store’’,
Information Technology and Management, Vol. 1 No. 1, pp. 45-71.
Kim, E.B. and Eom, S.B. (2002), ``Designing effective cyber store user interface’’,
Industrial Management & Data Systems,
Vol. 102 No. 5, pp. 241-51.
[ 308 ]
Stuart J. Barnes and Richard Vidgen
Measuring Web site quality improvements: a case study of the forum on strategic management knowledge exchange
Industrial Management & Data Systems
Kubicek, H. and Hagen, M. (2001), ``Integrating e-commerce and e-government: the case of Bremen Online Services’’, in Prins, J. (Ed.),
Designing E-Government, Kluwer Law International, The Hague.
McManis, B.L., Ryker, R. and Cox, C. (2001), ``An examination of Web usage in a global context’’,Industrial Management & Data
Systems, Vol. 101 No. 9, pp. 470-8.
Nielsen, J. (2000),Designing Web Usability, New Riders Publishing, Indianapolis, IN.
Pitt, L., Watson, R. and Kavan, C. (1995), ``Service quality: a measure of information systems effectiveness’’,MIS Quarterly, Vol. 19 No. 2, pp. 173-87.
La Porte, T., Demchak, C. and Friis, C. (2001), ``Webbing governance: global trends across national-level public agencies’’,
Communications of the ACM, Vol. 44 No. 1,
pp. 63-7.
Sampson, S.E. (1998), ``Gathering customer feedback via the Internet: instruments and prospects’’,Industrial Management & Data
Systems, Vol. 98 No. 2, pp. 71-82.
Slabey, R. (1990), ``QFD: a basic primer. Excerpts from the implementation manual for the three day QFD workshop’’,Transactions from the Second Symposium on Quality Function Deployment, Novi, MI, 18-19 June.
Strong, D., Lee, Y. and Wang, R. (1997), ``Data quality in context’’,Communications of the ACM, Vol. 40 No. 5, pp. 103-10.
Zeithaml, V.A., Parasuraman, A. and Berry, L. (1990),Delivering Quality Service: Balancing Customer Perceptions and Expectations, The Free Press, New York, NY.
Stuart J. Barnes and Richard Vidgen
Measuring Web site quality improvements: a case study of the forum on strategic management knowledge exchange
Industrial Management & Data Systems