1
Effect of Clay toward Maturation and Potential of Organic
Material as Basis to Determine the Parameter of Laboratory
Test on Shale Material Processing
Ordas Dewanto
1,a), Bagus S Mulyanto
1,b), Sri Rizky
1,c) 1)Geophysics Engineering, Engineering Faculty, University of Lampung, Bandar Lampung 35145, Indonesia
a)
[email protected], b)[email protected], c) [email protected]
Abstract Previous researches about clay material motivate researchers to know more about the effect of clay toward heating process of organic materials mixture. The objective of the research is to characterize clay that amalgamate with organic material stearic acid, hereinafter called as shale material. The synthesis of shale material has been successful in accordance to reference, which shows the shale material character and can be used in the conversion of oil shale into crude oil. The result of SEM and XRD analysis shows that the shale material has a very tiny pores that are not even seen, because the pores are filled by the organic material which are accumulated and strongly bound with illinite/kaolinite and other materials in small percentage. TGA test result on two sample of shale material (clay+organic) shows that the material did not experience many phase
changing, so the time and temperature are relatively not high. Temperature for early maturation is Tmax=325OC-430OC and
Tmax=421OC-453OC. Then, at 650OC-1000OC, the shale material experience constant last changing (over mature). The result
of Tmax measurement using pyrolisis is same as TGA. The pyrolisis test on clay-organic material shows a very good hidrokarbon potential (PY=605,06-652,45 mg/g material clay-organic and TOC=19,94-34,38%). The test on both material that amalgamate with the organic shows that clay material gives alot of influences on the heating process of the organic material.
Keywords: shale material, clay organic, Tmax, over mature, TGA, TOC
1. INTRODUCTION
Research from Bartis et al (2005), exploitation of shale material are gathered and sent to be processed by directly burning the shale which then used as source of electrical energy. Bartis et al also did underground shale material mining using room and pillar mining method. Burhnham et al(2006) did ex-situ process on extraction of shale material processing result although several new technology did in-situ process (Al-Hamaiedh et al, 2010). This heating process separated the free organic component (shale material) from bond organic component in shale material. Barkia et al (2004) also did the research on on termal analysis used to determine the heating effect on shale material in Maroko, done at temperature 500°C. It is a significant research progress, since initially the burning is done without considering the effect. This result encourages researcher to do research development on shale material, e.g., Peters, Walters, dan Moldowan (2006). Then, Al-Hamaiedh et al (2010) conducted a research to know the result of exploitation on shale material combined with a large amount of ash.
Conversion technology involves heating material in the absence of oxygen to a temperature where the material breaks down into gas, condensed oil and solid residue. Commonly, it happens between temperature 450OC (842OF) and 500OC (932OF) (Youngquist dan Walter, 1998). Decomposition process is started in relatively low temperature (300OC/570OF), but the faster and more complete result is gotten on a higher temperature (Koel and Mihkel, 1999). So far, most of the research have not discussed or analyzed specifically the type of organic material associated with clay and received heating treatment. For example, Mg2Al10Si24O60(OH)12 (Montmorillonite/ Smectite), Al2Si2O5(OH)4 (kaolinite), Ky(AlFeMg)(Si2-yAly)O5(OH) (Illite), and (OH)4(SiAl)8 (Mg Fe) (Klorite).
Natural shale material is used by oil shale at certain depth. Meanwhile the appropriate selection and model process indicated by itshig h effect on shale material maturation for conversion process of oil shale into hydrocarbon in form of crude oil, will be done by creating a right shale material. The material used is, first, clay material Al2Si2O5(OH)4 (kaolinite) or Ky(Al Fe Mg) (Si2-yAly) O5 (OH) (Illite) with the organic (CH3COOH or C7H6O3). Using a careful process involving comparison method between organic material and clay/carbonat, theory of mixing and time interval before conducting the test, a good quality of shale material will be obtained which later allows the reseacher to conduct a modelling to process oil shale into hydrocarbon in form of crude oil.
ISBN: XXXX-XXX-XX
2
2. MATERIALS AND METHODS
The tools are glass tube for preparation, rock cutter, XRD, TGA, SEM, BET, pyrolisis testing tools and FTIR. The object used is natural clay that is pillarized and compacted with organic material: strearic acid, reference oil shale, oil shale that is going to be converted into crude oil.
2.1 Preparing Sample
Part of shale material, clay (illite/kaolinite), is used as organic container, prepared with petrophysical methods which then analyzed to gain the characteristic of the material. The organic material: stearic acid is prepared based on the matrix of oil shale. Cogo et al (2009) has done a research about the characteristic of sedimentary organic material using Electron Paramagnetic Resonance (EPR). Reference oil shale from the research is used as comparison and reference to the production of shale material from clay.
2.2 Characterization and Analysis
Once the organic container is ready, the shale material, clay-organic, is made. It is stirred and pressed, then kept for 48 hours, then stirred and pressed again so that it fills all the pores in the clay container. After that, the shale material is kept for two weeks so that the organic material is trapped, binded and compacted. Next, using BET, the researchers measure the size of the specific surface. Further, Thermogravimetric Analysis (TGA) is done to measure the changing on weight of the compound as the function of the temperature or even the duration. The ouput shows a continous diagram record and the changing on weight and phase on the material. Differential Termal Analysis (DTA) is a technique to compare the temperature of the sample with inert reference material during a programmed temperature change.
2.3 Pyrolysis Testing
Pyrolysis analysis is used to identify the type and the maturation of the shale material as well as detect hydrocarbon matrix of the shale material. For this analysis, the sample is destructed and dried. Pyrolysis method consists of heater (oven) on inert atmospher temperature (helium) and 100 mg sample to determine free hydrocarbon and cracking process on the shale material.
2.4 Maximum Temperature (Tmax)
Tmax is maximum temperature to release hydrocarbon from cracking process of material mixture during the pyrolysis (peak S2). Tmax is an indication of maturation level of organic material inside shale-clay, carbonate shale and oil shale. Tmax value is one of geochemical parameter used to determine maturation level of shale-clay and oil shale. Termal Maturation level is measured by Tmax.For example: if Tmax is <435 OC, it shows that shale-clay, carbonate shale and oil shale are not mature yet. If Tmax is >470OC, it is over mature. Chart of pyrolysis outcome is called Pirogram and can be seen in program figure.
3. RESULTS AND DISCUSSIONS
3.1 X-Ray Difraction Measurement
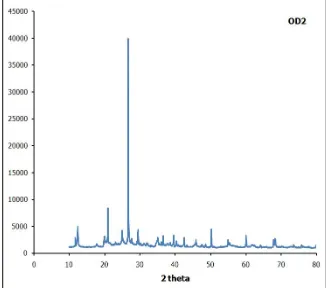
Figure 1 is the outcome of XRD test at high angle (10°-80°) on clay material (OD-2) with illite mineral and an observation with software match for Illite mineral is shown in figure 2. It also shows that the compound in this illite is SiO2.
3 Figure 1 and 2 shows similarity between those two charts to ensure that the clay used in this research is illite. Illite or kaolinite always goes along and attach around and inside the pores which ease ion exchange to change structure and pore size, as well as catalyst in organic maturation process.
Figure 2. Graph clay (illite) from Match Software
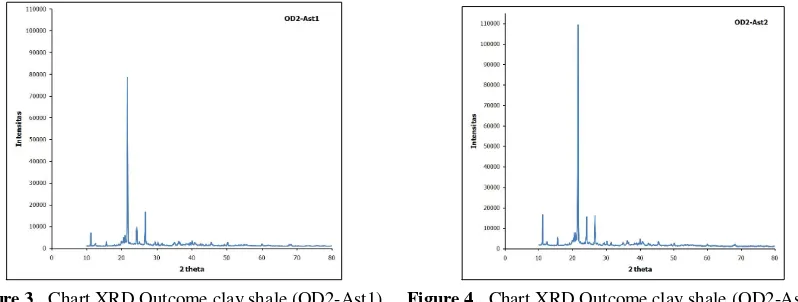
If we take a look closer, the highest peak happens on 2thetha angle between 10O to 30O (precisely 27O), because clay experiences changing on d001 basalt space, beside that a peak also appears on 2theta angle between 10O and 50O, in detail 11O, 21O, 27O (The highest peak), and 50.5O. Comparison can also be done with Figure 3 which shows clay material OD2 filled and bound with organic material Ast1, and become clay shale with TOC >12%. The chart shows the peaks on 2theta angle which is different from figure 4.
Figure 3. Chart XRD Outcome clay shale (OD2-Ast1) Figure 4. Chart XRD Outcome clay shale (OD2-Ast2)
Figure 4 shows XRD test on high temperature (10°-80°) on clay shale OD2-Ast2, the result can be compared to figure 3 which is the same clay shale with different organic volume. The chart shows peaks of the 2theta angle is not different from figure 3. No change on several new peaks of 2theta indicating the same condition in which the pores space on clay shale if filled and bound with organic material, and new material has increased to form bond on clay that contains SiO2, hence fit to clay shale theory with TOC>12%.
3.2 SEM Analysis on Clay Shale
ISBN: XXXX-XXX-XX
4 Figure 5. SEM analysis clay shale (OD2-Ast1)
Figure 5 shows the outcome of synthetic method discussed above. The formed clay shale shows that it has a very small pores which is unseen, because all the pores are filled by organic material, accumulated and bound with illite/kaolinite and some other materials in small percentage.
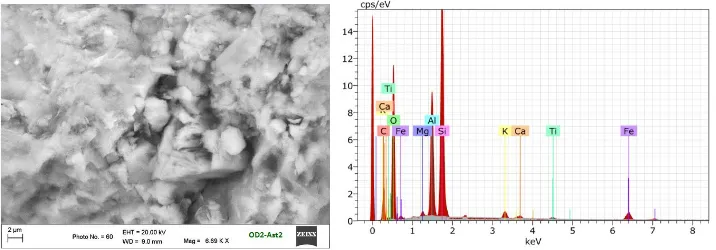
From Edax SEM on clay shale OD2-Ast1, it contains several elements with (wt,%) as follow: Carbon (21.77%), Oxygen (57.10%), Sodium (0.90%), Aluminium (1.89%), Silicon (27.40%) and Iron (0.43%). Figure 6 shows the same shale material OD2-Ast2. The difference is that it has 2 times amount of OD2-Ast1 organic material. The formation method of clay shale OD2-Ast2 is the same as OD2-Ast1. Clay shale is stirred and pressed slowly, then kept for 48 hours. The stirring and pressing is then conducted for the second time so that the organic material filled evenly the pores of the clay container. After kept for another 48 hours, the organic material is expected to trap (filled) all pores more tighly and compact. Specific surface measurement using BET shows that the surface of the shale has been filled by smaller organic, indicating that the clay container is successfully filled/bound by organic as the pores are dwindling. Figure 6 shows SEM analysis outcome on clay shale OD2-Ast2 with good quality supported by TOC12% as indicators of the nature of good oil shale in accordance to reference.
Figure 6. SEM analysis on clay shale (OD2-Ast2)
As shown in Figure 5, it is an expected condition where the clay shale can represent oil shale for basis in the processing of oil shale into crude oil (STM). Edax SEM on Clay shale OD2-Ast2 contains some elements with (wt,%) as follow: Carbon (30.85%), Oxygen (50.19%), Magnesium (0.31%), Aluminium (6.49%), Silicon (10.44%), Potassium (0.41%), Calcium (0.17%), Titanium (0.12%) and Iron (1.03%).
3.3 Outcome of TGA Analysis
5 Figure 7. Chart Thermogravimetry Analysis (TGA) outcome for reference oil shale
The first weight loss is caused by water evaporation in the crystal structure. Meanwhile, the second significant weight loss happens by the changing of structure of oil shale material and the evaporation of water molecules chemically. The weight loss that happens before the last temparature deflation indicates maximum temperature needed by clay molecules to start turning into oil shale. Further, when calcination is done from the beginning of the last loss to the constant weight (on temperature 600OC), many molecules in the oil shale are detached, causing some part of shale in the pores also detached, as seen in XRD analysis outcome This condition is called over mature, where the chart line tend to stay horizontal along with the increase of temperature up to 800OC. Therefore, the required temperature in a process of oil shale conversion into crude oil is between ± 305OC-430OC.
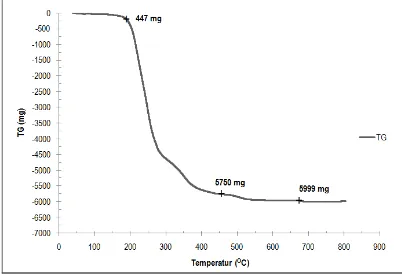
Figure 8. Chart Thermogravimetry Analysis (TGA) outcome on serpih clay (OD2-Ast1)
The first weight loss is caused the evaporation of water molecules in the crystal structure. The second weight loss is significant and indicates the change on the structure of clay shale and the evaporation of water molecules, chemically. Weight loss before the last temperature deflation indicating the maximum temperature required by clay shale to begin changing into oil shale. Over mature happens at temperature 800OC, indicating the structure of material has been broken and cannot be used as reference shale material anymore. Therefore, the required temperature in a process of oil shale conversion into crude oil is between ± (325OC-430OC).
3.4 TOC and Pyrolysis Analysis
TOC and Pyrolysis analysis on clay-organic material is shown in Table 1. Two clay-organic-material (sample 1 and 2) shows potential of good quality hydrocarbon PY=605,06-652,45 mg/g and TOC=19,94-34,38%.
TABLE 1. TOC Analysis Outcome TABLE 2. Potencial of clay shale material based on HI dan OI values
No TOC
(%)
PY
(mg/g) PI PC No
Tmax
(OC) HI OI
Main Products
1 19,94 605,06 0,90 50,22 1 323 308 87 Oil
ISBN: XXXX-XXX-XX
6 Table 2 shows the potential of clay material based on HI and OI. HI is the outcome of (S2×100)/TOC and OI for (S3×100)/TOC. The value of these two parameters will decrease along with the increase of maturation level. A high HI shows clay material is dominated by organic material or oil prone.. Beside, Tmax value as maturation indicator also has some limitations, such as cannot be used on materials with low TOC (<0,5) and HI < 50. The basis on choosing the potential of shale material based on previous research from Wales (1985) is used to know the potential of oil shale material (table 3).
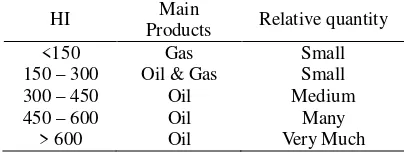
TABLE 3. Potencial of clay shale material based on HI dan OI values (by Waples, 1985)
HI Main
The use of clay material (OD2-Ast1, OD2-Ast2) is fit with the characteristic of good quality oil shale, which have good porosity value as place for material to accumulate. The synthetic of the clay material is successful. It fits the oil shale with TOC 12% (pyrolysis outcome). Value of oil shale Tmax is 421OC-453OC. TGA testing outcome shows clay material has a huge influence during organic maturation process. The apropriate temperature in the initial maturation is Tmax=325OC-430OC and over mature at temperatur 650OC-1000OC. Pyrolysis outcome shows that oil shale has high potential on shale material that contains clay (PY=605.06-652.45). OI and HI analysis outcome indicates that clay material is dominated by organic material with oil and gas feature.
5. ACKNOWLEDGEMENT
The authors would like to thank to Dikti who supported us by giving the research fund, LPPM Lampung University who give the opportunity and the support and Physics and chemics laboratories in Indonesia University and Lampung University that provided all the instrument to do the measuring.
REFERENCES
[1] Al-Hamaiedh, H., Maaitah, O., and Mahadin, S. 2010. Using Oil Shale Ash in Concrete Binder. EJGE Vol. 15, Bund. F. P. 601-608.
[2] Barkia, H., Belkbir, L. and Jayaweera, S.A.A. 2004. Thermal analysis studies of oil shale residual carbon. Journal of Thermal Analysis and Calorimetry, 76 (2), pp.615-622.
[3] Bartis, J.T., La Tourrette, T, Dixon, L., Peterson, D.J., Cecchine, G. 2005. Oil Shale Development in the United States. Prospects and Policy Issues. Prepared for the National Energy Technology Laboratory of the U.S. Department of Energy. The RAND Corporation. ISBN: 978-0-8330-3848-7. Retrieved 2007-06-29.
[4] Berraja, T., Barkia, H., Belkbir, L. and Jayaweera, S.A.A. 1988. Thermal analysis studies of the combustion of Tarfaya oil shale. Proceeding of an International Conference on Carbon, Carbon'88, Eds. B. Mc Ennaney and T.J. Mays. Univ. Newcastle Upon Tyne, UK. P. 18-23.
[5] Burnham, A.K., Mc Conaghy, J.R. 2006. Comparison of the Acceptability of Various Oil Shale Processes. 26th Oil Shale Symposium. Golden, Colorado: Lawrence Livermore National Laboratory. UCRL-CONF-226717. Retrieved 2007-06-23.
[6] Cogo, S.L., Brinatti, A.M., Saab, S.C., Simões, M.L., Martin-Neto, L., Rosa, J.A., and Mascarenhas, Y.P. 2009. Characterization Of Oil Shale Residue And Rejects From Irati Formation By Electron Paramagnetic Resonance. Brazilian Journal of Physics, vol. 39, no. 1.
[7] Dewanto, O., Mulyanto, B.S., Rustadi, Wibowo, R.C. 2017. Determining the Temperature of Shale Material Conversion Into Crude Oil Based on Organic Clay and Organic Carbonate Test Outside Reservoir. International Journal of Mechanical and Mechatronics Engineering IJMME-IJENS. 173105-4848. Vol:17 No:05. P 84-89.
7 [9] Katz, B.J. 1983. Limitations of ‘Rock-Eval’ pyrolysis for typing organic matter. Organic Geochemistry 4,
p.195-199.
[10] Koel and Mihkel. 1999. Estonian oil shale Oil Shale. A Scientific-Technical Journal (Estonian Academy Publishers) (Extra). ISSN 0208-189X. Retrieved 2007-07-21.
[11] Kogerman, A. 2001. Ten Years of Oil Shale. Estonian Academy Publishers. Oil Shale, Vol. 18, No. 1. ISSN 0208-189X. pp. 1-4.
[12] Peters, K.E., Walters, C.C. and Moldowan, J.M. 2006. The biomarker guide: V.1 Biomarkers and isotopes in the environment and human history. Cambridge University Press, 471 pp.
[13] Tjahjono, J.A.E. 2004. Preliminary Survey on Regional Deposition of Solid Bitumen Sendangharjo Area, Blora, Central Java Province. DIM, Bandung.
[14] Tobing, S.M. 2003. Inventory of Solid Bitumen with 'Outcrop Drilling' in Regional Ayah, Kebumen, Central Java Province. DIM, Bandung.
[15] Waples, D.W. 1985. Geochemistry in Petroleum Exploration. Brown and Ruth Laboratories Inc, Denver Colorado, 33 pp.
[16] Waples, D.W. 1985. Geochemistry in Petroleum Exploration. International Human Resources Developmen Co. Boston, 232 h.
[17] Widjaya, R.R. 2012. Cr Pillarization Bentonite And Zeolite HZSM-5 Catalyst For Ethanol Conversion Process Being Biogasolin. Thesis. Materials Science Program, Faculty of Mathematics and Natural Sciences. University of Indonesia.
[18]Yoshioka1, H. and Ishiwatari, R. 2002. Characterization of organic matter generated from Green River shale by infrared laser pyrolysis. Geochemical Journal. Vol. 36, pp. 73 to 82.