DISCOVERING
KNOWLEDGE IN DATA
An Introduction to Data Mining
DANIEL T. LAROSE
Director of Data MiningCentral Connecticut State University
DISCOVERING
DISCOVERING
KNOWLEDGE IN DATA
An Introduction to Data Mining
DANIEL T. LAROSE
Director of Data MiningCentral Connecticut State University
Copyright ©2005 by John Wiley & Sons, Inc. All rights reserved.
Published by John Wiley & Sons, Inc., Hoboken, New Jersey. Published simultaneously in Canada.
No part of this publication may be reproduced, stored in a retrieval system, or transmitted in any form or by any means, electronic, mechanical, photocopying, recording, scanning, or otherwise, except as permitted under Section 107 or 108 of the 1976 United States Copyright Act, without either the prior written permission of the Publisher, or authorization through payment of the appropriate per-copy fee to the Copyright Clearance Center, Inc., 222 Rosewood Drive, Danvers, MA 01923, 978-750-8400, fax 978-646-8600, or on the web at www.copyright.com. Requests to the Publisher for permission should be addressed to the Permissions Department, John Wiley & Sons, Inc., 111 River Street, Hoboken, NJ 07030, (201) 748-6011, fax (201) 748-6008.
Limit of Liability/Disclaimer of Warranty: While the publisher and author have used their best efforts in preparing this book, they make no representations or warranties with respect to the accuracy or completeness of the contents of this book and specifically disclaim any implied warranties of merchantability or fitness for a particular purpose. No warranty may be created or extended by sales representatives or written sales materials. The advice and strategies contained herein may not be suitable for your situation. You should consult with a professional where appropriate. Neither the publisher nor author shall be liable for any loss of profit or any other commercial damages, including but not limited to special, incidental, consequential, or other damages.
For general information on our other products and services please contact our Customer Care Department within the U.S. at 877-762-2974, outside the U.S. at 317-572-3993 or fax 317-572-4002.
Wiley also publishes its books in a variety of electronic formats. Some content that appears in print, however, may not be available in electronic format.
Library of Congress Cataloging-in-Publication Data: Larose, Daniel T.
Discovering knowledge in data : an introduction to data mining / Daniel T. Larose p. cm.
Includes bibliographical references and index. ISBN 0-471-66657-2 (cloth)
1. Data mining. I. Title. QA76.9.D343L38 2005
006.3′12—dc22 2004003680
Printed in the United States of America
Dedication
To my parents,
And their parents,
And so on...
For my children,
And their children,
And so on...
CONTENTS
PREFACE xi
1 INTRODUCTION TO DATA MINING 1
What Is Data Mining? 2
Why Data Mining? 4
Need for Human Direction of Data Mining 4
Cross-Industry Standard Process: CRISP–DM 5
Case Study 1: Analyzing Automobile Warranty Claims: Example of the
CRISP–DM Industry Standard Process in Action 8
Fallacies of Data Mining 10
What Tasks Can Data Mining Accomplish? 11
Description 11
Estimation 12
Prediction 13
Classification 14
Clustering 16
Association 17
Case Study 2: Predicting Abnormal Stock Market Returns Using
Neural Networks 18
Case Study 3: Mining Association Rules from Legal Databases 19
Case Study 4: Predicting Corporate Bankruptcies Using Decision Trees 21
Case Study 5: Profiling the Tourism Market Usingk-Means Clustering Analysis 23
References 24
Exercises 25
2 DATA PREPROCESSING 27
Why Do We Need to Preprocess the Data? 27
Data Cleaning 28
Handling Missing Data 30
Identifying Misclassifications 33
Graphical Methods for Identifying Outliers 34
Data Transformation 35
Min–Max Normalization 36
Z-Score Standardization 37
Numerical Methods for Identifying Outliers 38
References 39
Exercises 39
viii CONTENTS
3 EXPLORATORY DATA ANALYSIS 41
Hypothesis Testing versus Exploratory Data Analysis 41
Getting to Know the Data Set 42
Dealing with Correlated Variables 44
Exploring Categorical Variables 45
Using EDA to Uncover Anomalous Fields 50
Exploring Numerical Variables 52
Exploring Multivariate Relationships 59
Selecting Interesting Subsets of the Data for Further Investigation 61
Binning 62
Summary 63
References 64
Exercises 64
4 STATISTICAL APPROACHES TO ESTIMATION AND PREDICTION 67
Data Mining Tasks inDiscovering Knowledge in Data 67
Statistical Approaches to Estimation and Prediction 68
Univariate Methods: Measures of Center and Spread 69
Statistical Inference 71
How Confident Are We in Our Estimates? 73
Confidence Interval Estimation 73
Bivariate Methods: Simple Linear Regression 75
Dangers of Extrapolation 79
Confidence Intervals for the Mean Value ofyGivenx 80
Prediction Intervals for a Randomly Chosen Value ofyGivenx 80
Multiple Regression 83
Quantifying Attribute Relevance: Stretching the Axes 103
Database Considerations 104
k-Nearest Neighbor Algorithm for Estimation and Prediction 104
Choosingk 105
Reference 106
CONTENTS ix
6 DECISION TREES 107
Classification and Regression Trees 109
C4.5 Algorithm 116
Decision Rules 121
Comparison of the C5.0 and CART Algorithms Applied to Real Data 122
References 126
Exercises 126
7 NEURAL NETWORKS 128
Input and Output Encoding 129
Neural Networks for Estimation and Prediction 131
Simple Example of a Neural Network 131
Sigmoid Activation Function 134
Application of Neural Network Modeling 143
References 145
Exercises 145
8 HIERARCHICAL AND k-MEANS CLUSTERING 147
Clustering Task 147
Hierarchical Clustering Methods 149
Single-Linkage Clustering 150
Complete-Linkage Clustering 151
k-Means Clustering 153
Example ofk-Means Clustering at Work 153
Application ofk-Means Clustering Using SAS Enterprise Miner 158
Using Cluster Membership to Predict Churn 161
References 161
Exercises 162
9 KOHONEN NETWORKS 163
Self-Organizing Maps 163
Kohonen Networks 165
Example of a Kohonen Network Study 166
Cluster Validity 170
Application of Clustering Using Kohonen Networks 170
Interpreting the Clusters 171
x CONTENTS
Using Cluster Membership as Input to Downstream Data Mining Models 177
References 178
Exercises 178
10 ASSOCIATION RULES 180
Affinity Analysis and Market Basket Analysis 180
Data Representation for Market Basket Analysis 182
Support, Confidence, Frequent Itemsets, and the A Priori Property 183
How Does the A Priori Algorithm Work (Part 1)? Generating Frequent Itemsets 185
How Does the A Priori Algorithm Work (Part 2)? Generating Association Rules 186
Extension from Flag Data to General Categorical Data 189
Information-Theoretic Approach: Generalized Rule Induction Method 190
J-Measure 190
Application of Generalized Rule Induction 191
When Not to Use Association Rules 193
Do Association Rules Represent Supervised or Unsupervised Learning? 196
Local Patterns versus Global Models 197
References 198
Exercises 198
11 MODEL EVALUATION TECHNIQUES 200
Model Evaluation Techniques for the Description Task 201
Model Evaluation Techniques for the Estimation and Prediction Tasks 201
Model Evaluation Techniques for the Classification Task 203
Error Rate, False Positives, and False Negatives 203
Misclassification Cost Adjustment to Reflect Real-World Concerns 205
Decision Cost/Benefit Analysis 207
Lift Charts and Gains Charts 208
Interweaving Model Evaluation with Model Building 211
Confluence of Results: Applying a Suite of Models 212
Reference 213
Exercises 213
EPILOGUE: “WE’VE ONLY JUST BEGUN” 215
PREFACE
WHAT IS DATA MINING?
Data mining is predicted to be “one of the most revolutionary developments of the next decade,” according to the online technology magazineZDNET News(February 8, 2001). In fact, theMIT Technology Reviewchose data mining as one of ten emerging technologies that will change the world. According to the Gartner Group, “Data min-ing is the process of discovermin-ing meanmin-ingful new correlations, patterns and trends by sifting through large amounts of data stored in repositories, using pattern recognition technologies as well as statistical and mathematical techniques.”
Because data mining represents such an important field, Wiley-Interscience and Dr. Daniel T. Larose have teamed up to publish a series of volumes on data mining, consisting initially of three volumes. The first volume in the series, Discovering Knowledge in Data: An Introduction to Data Mining, introduces the reader to this rapidly growing field of data mining.
WHY IS THIS BOOK NEEDED?
Human beings are inundated with data in most fields. Unfortunately, these valuable data, which cost firms millions to collect and collate, are languishing in warehouses and repositories.The problem is that not enough trained human analysts are available who are skilled at translating all of the data into knowledge, and thence up the taxonomy tree into wisdom. This is why this book is needed; it provides readers with:
r Models and techniques to uncover hidden nuggets of information
r Insight into how data mining algorithms work
r The experience of actually performing data mining on large data sets
Data mining is becoming more widespread every day, because it empowers companies to uncover profitable patterns and trends from their existing databases. Companies and institutions have spent millions of dollars to collect megabytes and terabytes of data but are not taking advantage of the valuable and actionable infor-mation hidden deep within their data repositories. However, as the practice of data mining becomes more widespread, companies that do not apply these techniques are in danger of falling behind and losing market share, because their competitors are using data mining and are thereby gaining the competitive edge. InDiscovering Knowledge in Data, the step-by-step hands-on solutions of real-world business prob-lems using widely available data mining techniques applied to real-world data sets
xii PREFACE
will appeal to managers, CIOs, CEOs, CFOs, and others who need to keep abreast of the latest methods for enhancing return on investment.
DANGER! DATA MINING IS EASY TO DO BADLY
The plethora of new off-the-shelf software platforms for performing data mining has kindled a new kind of danger. The ease with which these GUI-based applications can manipulate data, combined with the power of the formidable data mining algo-rithms embedded in the black-box software currently available, make their misuse proportionally more hazardous.
Just as with any new information technology,data mining is easy to do badly. A little knowledge is especially dangerous when it comes to applying powerful models based on large data sets. For example, analyses carried out on unpreprocessed data can lead to erroneous conclusions, or inappropriate analysis may be applied to data sets that call for a completely different approach, or models may be derived that are built upon wholly specious assumptions. If deployed, these errors in analysis can lead to very expensive failures.
‘‘WHITE BOX’’ APPROACH: UNDERSTANDING THE
UNDERLYING ALGORITHMIC AND MODEL STRUCTURES
The best way to avoid these costly errors, which stem from a blind black-box approach to data mining, is to apply instead a “white-box” methodology, which emphasizes an understanding of the algorithmic and statistical model structures underlying the software.Discovering Knowledge in Dataapplies this white-box approach by:
rWalking the reader through the various algorithms
rProviding examples of the operation of the algorithm on actual large data sets
rTesting the reader’s level of understanding of the concepts and algorithms
rProviding an opportunity for the reader to do some real data mining on large
data sets
Algorithm Walk-Throughs
Discovering Knowledge in Datawalks the reader through the operations and nuances of the various algorithms, using small-sample data sets, so that the reader gets a true appreciation of what is really going on inside the algorithm. For example, in Chapter 8, we see the updated cluster centers being updated, moving toward the center of their respective clusters. Also, in Chapter 9 we see just which type of network weights will result in a particular network node “winning” a particular record.
Applications of the Algorithms to Large Data Sets
DATA MINING AS A PROCESS xiii
is attacked using a neural network model on a real-world data set. The resulting neural network topology is examined along with the network connection weights, as reported by the software. These data sets are included at the book series Web site, so that readers may follow the analytical steps on their own, using data mining software of their choice.
Chapter Exercises: Checking to Make Sure That You Understand It
Discovering Knowledge in Data includes over 90 chapter exercises, which allow readers to assess their depth of understanding of the material, as well as to have a little fun playing with numbers and data. These include conceptual exercises, which help to clarify some of the more challenging concepts in data mining, and “tiny data set” exercises, which challenge the reader to apply the particular data mining algorithm to a small data set and, step by step, to arrive at a computationally sound solution. For example, in Chapter 6 readers are provided with a small data set and asked to construct by hand, using the methods shown in the chapter, a C4.5 decision tree model, as well as a classification and regression tree model, and to compare the benefits and drawbacks of each.
Hands-on Analysis: Learn Data Mining by Doing Data Mining
Chapters 2 to 4 and 6 to 11 provide the reader with hands-on analysis problems, representing an opportunity for the reader to apply his or her newly acquired data mining expertise to solving real problems using large data sets. Many people learn by doing.Discovering Knowledge in Dataprovides a framework by which the reader can learn data mining by doing data mining. The intention is to mirror the real-world data mining scenario. In the real world, dirty data sets need cleaning; raw data needs to be normalized; outliers need to be checked. So it is withDiscovering Knowledge in Data, where over 70 hands-on analysis problems are provided. In this way, the reader can “ramp up” quickly and be “up and running” his or her own data mining analyses relatively shortly.
For example, in Chapter 10 readers are challenged to uncover high-confidence, high-support rules for predicting which customer will be leaving a company’s service. In Chapter 11 readers are asked to produce lift charts and gains charts for a set of classification models using a large data set, so that the best model may be identified.
DATA MINING AS A PROCESS
One of the fallacies associated with data mining implementation is that data mining somehow represents an isolated set of tools, to be applied by some aloof analysis department, and is related only inconsequentially to the mainstream business or re-search endeavor. Organizations that attempt to implement data mining in this way will see their chances of success greatly reduced. This is because data mining should be view as aprocess.
xiv PREFACE
involved in deploying the results. Thus, this book is not only for analysts but also for managers, who need to be able to communicate in the language of data mining. The particular standard process used is the CRISP–DM framework: the Cross-Industry Standard Process for Data Mining. CRISP–DM demands that data mining be seen as an entire process, from communication of the business problem through data col-lection and management, data preprocessing, model building, model evaluation, and finally, model deployment. Therefore, this book is not only for analysts and man-agers but also for data management professionals, database analysts, and decision makers.
GRAPHICAL APPROACH, EMPHASIZING EXPLORATORY
DATA ANALYSIS
Discovering Knowledge in Dataemphasizes a graphical approach to data analysis. There are more than 80 screen shots of actual computer output throughout the book, and over 30 other figures. Exploratory data analysis (EDA) represents an interesting and exciting way to “feel your way” through large data sets. Using graphical and numerical summaries, the analyst gradually sheds light on the complex relationships hidden within the data.Discovering Knowledge in Dataemphasizes an EDA approach to data mining, which goes hand in hand with the overall graphical approach.
HOW THE BOOK IS STRUCTURED
Discovering Knowledge in Dataprovides a comprehensive introduction to the field. Case studies are provided showing how data mining has been utilized successfully (and not so successfully). Common myths about data mining are debunked, and common pitfalls are flagged, so that new data miners do not have to learn these lessons themselves.
The first three chapters introduce and follow the CRISP–DM standard process, especially the data preparation phase and data understanding phase. The next seven chapters represent the heart of the book and are associated with the CRISP–DM modeling phase. Each chapter presents data mining methods and techniques for a specific data mining task.
r
Chapters 5, 6, and 7 relate to theclassificationtask, examining the k-nearest neighbor (Chapter 5), decision tree (Chapter 6), and neural network (Chapter 7) algorithms.
rChapters 8 and 9 investigate theclusteringtask, with hierarchical andk-means
clustering (Chapter 8) and Kohonen network (Chapter 9) algorithms.
rChapter 10 handles theassociationtask, examining association rules through
the a priori and GRI algorithms.
r
ACKNOWLEDGMENTS xv
DISCOVERING KNOWLEDGE IN DATA AS A TEXTBOOK
Discovering Knowledge in Datanaturally fits the role of textbook for an introductory course in data mining. Instructors may appreciate:
r
The presentation of data mining as aprocess
r The “white-box” approach, emphasizing an understanding of the underlying
algorithmic structures:
◦algorithm walk-throughs
◦application of the algorithms to large data sets
◦chapter exercises
◦hands-on analysis
r
The graphical approach, emphasizing exploratory data analysis
r The logical presentation, flowing naturally from the CRISP–DM standard
pro-cess and the set of data mining tasks
Discovering Knowledge in Datais appropriate for advanced undergraduate or graduate courses. Except for one section in Chapter 7, no calculus is required. An introductory statistics course would be nice but is not required. No computer programming or database expertise is required.
ACKNOWLEDGMENTS
Discovering Knowledge in Datawould have remained unwritten without the assis-tance of Val Moliere, editor, Kirsten Rohsted, editorial program coordinator, and Rosalyn Farkas, production editor, at Wiley-Interscience and Barbara Zeiders, who copyedited the work. Thank you for your guidance and perserverance.
I wish also to thank Dr. Chun Jin and Dr. Daniel S. Miller, my colleagues in the Master of Science in Data Mining program at Central Connecticut State University; Dr. Timothy Craine, the chair of the Department of Mathematical Sciences; Dr. Dipak K. Dey, chair of the Department of Statistics at the University of Connecticut; and Dr. John Judge, chair of the Department of Mathematics at Westfield State College. Your support was (and is) invaluable.
Thanks to my children, Chantal, Tristan, and Ravel, for sharing the computer with me. Finally, I would like to thank my wonderful wife, Debra J. Larose, for her patience, understanding, and proofreading skills. But words cannot express. . . .
Daniel T. Larose, Ph.D. Director, Data Mining @CCSU
C H A P T E R
1
INTRODUCTION TO
DATA MINING
WHAT IS DATA MINING?
WHY DATA MINING?
NEED FOR HUMAN DIRECTION OF DATA MINING
CROSS-INDUSTRY STANDARD PROCESS: CRISP–DM
CASE STUDY 1: ANALYZING AUTOMOBILE WARRANTY CLAIMS: EXAMPLE OF THE CRISP–DM INDUSTRY STANDARD PROCESS IN ACTION
FALLACIES OF DATA MINING
WHAT TASKS CAN DATA MINING ACCOMPLISH?
CASE STUDY 2: PREDICTING ABNORMAL STOCK MARKET RETURNS USING NEURAL NETWORKS
CASE STUDY 3: MINING ASSOCIATION RULES FROM LEGAL DATABASES
CASE STUDY 4: PREDICTING CORPORATE BANKRUPTCIES USING DECISION TREES
CASE STUDY 5: PROFILING THE TOURISM MARKET USINGk-MEANS CLUSTERING ANALYSIS
About 13 million customers per month contact the West Coast customer service call center of the Bank of America, as reported by CIO Magazine’s cover story on data mining in May 1998 [1]. In the past, each caller would have listened to the same marketing advertisement, whether or not it was relevant to the caller’s interests. However, “rather than pitch the product of the week, we want to be as relevant as possible to each customer,” states Chris Kelly, vice president and director of database marketing at Bank of America in San Francisco. Thus, Bank of America’s customer service representatives have access to individual customer profiles, so that the customer can be informed of new products or services that may be of greatest
Discovering Knowledge in Data: An Introduction to Data Mining, By Daniel T. Larose ISBN 0-471-66657-2 CopyrightC 2005 John Wiley & Sons, Inc.
2 CHAPTER 1 INTRODUCTION TO DATA MINING
interest to him or her. Data mining helps to identify the type of marketing approach for a particular customer, based on the customer’s individual profile.
Former President Bill Clinton, in his November 6, 2002 address to the Demo-cratic Leadership Council [2], mentioned that not long after the events of September 11, 2001, FBI agents examined great amounts of consumer data and found that five of the terrorist perpetrators were in the database. One of the terrorists possessed 30 credit cards with a combined balance totaling $250,000 and had been in the country for less than two years. The terrorist ringleader, Mohammed Atta, had 12 different addresses, two real homes, and 10 safe houses. Clinton concluded that we should proactively search through this type of data and that “if somebody has been here a couple years or less and they have 12 homes, they’re either really rich or up to no good. It shouldn’t be that hard to figure out which.”
Brain tumors represent the most deadly cancer among children, with nearly 3000 cases diagnosed per year in the United States, nearly half of which are fatal. Eric Bremer [3], director of brain tumor research at Children’s Memorial Hospital in Chicago, has set the goal of building a gene expression database for pediatric brain tumors, in an effort to develop more effective treatment. As one of the first steps in tumor identification, Bremer uses the Clementine data mining software suite, published by SPSS, Inc., to classify the tumor into one of 12 or so salient types. As we shall learn in Chapter 5 classification, is one of the most important data mining tasks.
These stories are examples ofdata mining.
WHAT IS DATA MINING?
According to the Gartner Group [4], “Data mining is the process of discovering meaningful new correlations, patterns and trends by sifting through large amounts of data stored in repositories, using pattern recognition technologies as well as statistical and mathematical techniques.” There are other definitions:
r“Data mining is the analysis of (often large) observational data sets to find
unsuspected relationships and to summarize the data in novel ways that are both understandable and useful to the data owner” (Hand et al. [5]).
r“Data mining is an interdisciplinary field bringing togther techniques from
machine learning, pattern recognition, statistics, databases, and visualization to address the issue of information extraction from large data bases” (Evangelos Simoudis in Cabena et al. [6]).
WHAT IS DATA MINING? 3
are in high demand this year, as organizations increasingly put data repositories online. Effectively analyzing information from customers, partners, and suppliers has become important to more companies. ‘Many companies have implemented a data warehouse strategy and are now starting to look at what they can do with all that data,’ says Dudley Brown, managing partner of BridgeGate LLC, a recruiting firm in Irvine, Calif.”
How widespread is data mining? Which industries are moving into this area? Actually, the use of data mining is pervasive, extending into some surprising areas. Consider the following employment advertisement [10]:
STATISTICS INTERN: SEPTEMBER–DECEMBER 2003
Work with Basketball Operations
Resposibilities include:
rCompiling and converting data into format for use in statistical models
rDeveloping statistical forecasting models using regression, logistic regression,data
mining, etc.
rUsing statistical packages such as Minitab, SPSS, XLMiner
Experience in developing statistical models a differentiator, but not required.
Candidates who have completed advanced statistics coursework with a strong knowledge of basketball and the love of the game should forward your r´esum´e and cover letter to:
Boston Celtics
Director of Human Resources 151 Merrimac Street Boston, MA 02114
4 CHAPTER 1 INTRODUCTION TO DATA MINING
WHY DATA MINING?
While waiting in line at a large supermarket, have you ever just closed your eyes and listened? What do you hear, apart from the kids pleading for candy bars? You might hear the beep, beep, beep of the supermarket scanners, reading the bar codes on the grocery items, ringing up on the register, and storing the data on servers located at the supermarket headquarters. Each beep indicates a new row in the database, a new “observation” in the information being collected about the shopping habits of your family and the other families who are checking out.
Clearly, a lot of data is being collected. However, what is being learned from all this data? What knowledge are we gaining from all this information? Probably, depending on the supermarket, not much. As early as 1984, in his bookMegatrends
[12], John Naisbitt observed that “we are drowning in information but starved for knowledge.” The problem today is not that there is not enough data and information streaming in. We are, in fact, inundated with data in most fields. Rather, the problem is that there are not enough trained human analysts available who are skilled at translating all of this data into knowledge, and thence up the taxonomy tree into wisdom.
The ongoing remarkable growth in the field of data mining and knowledge discovery has been fueled by a fortunate confluence of a variety of factors:
rThe explosive growth in data collection, as exemplified by the supermarket
scanners above
rThe storing of the data in data warehouses, so that the entire enterprise has
access to a reliable current database
rThe availability of increased access to data from Web navigation and intranets rThe competitive pressure to increase market share in a globalized economy rThe development of off-the-shelf commercial data mining software suites rThe tremendous growth in computing power and storage capacity
NEED FOR HUMAN DIRECTION OF DATA MINING
CROSS-INDUSTRY STANDARD PROCESS: CRISP–DM 5
misled many people into believing that data mining is a product that can be bought rather than a discipline that must be mastered.”
Very well stated! Automation is no substitute for human input. As we shall learn shortly, humans need to be actively involved at every phase of the data mining process. Georges Grinstein of the University of Massachusetts at Lowell and AnVil, Inc., stated it like this [15]:
Imagine a black box capable of answering any question it is asked. Any question. Will this eliminate our need for human participation as many suggest? Quite the opposite. The fundamental problem still comes down to a human interface issue. How do I phrase the question correctly? How do I set up the parameters to get a solution that is applicable in the particular case I am interested in? How do I get the results in reasonable time and in a form that I can understand? Note that all the questions connect the discovery process to me, for my human consumption.
Rather than asking where humans fit into data mining, we should instead inquire about how we may design data mining into the very human process of problem solving.
Further, the very power of the formidable data mining algorithms embedded in the black-box software currently available makes their misuse proportionally more dangerous. Just as with any new information technology, data mining is easy to do badly. Researchers may apply inappropriate analysis to data sets that call for a completely different approach, for example, or models may be derived that are built upon wholly specious assumptions. Therefore, an understanding of the statistical and mathematical model structures underlying the software is required.
CROSS-INDUSTRY STANDARD PROCESS: CRISP–DM
There is a temptation in some companies, due to departmental inertia and com-partmentalization, to approach data mining haphazardly, to reinvent the wheel and duplicate effort. A cross-industry standard was clearly required that is industry-neutral, tool-industry-neutral, and application-neutral. The Cross-Industry Standard Process for Data Mining (CRISP–DM) [16] was developed in 1996 by analysts representing DaimlerChrysler, SPSS, and NCR. CRISP provides a nonproprietary and freely avail-able standard process for fitting data mining into the general problem-solving strategy of a business or research unit.
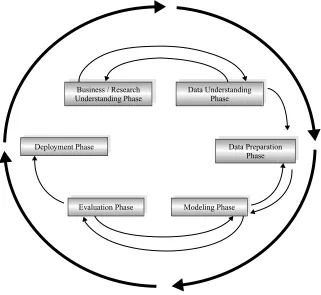
According to CRISP–DM, a given data mining project has a life cycle consisting of six phases, as illustrated in Figure 1.1. Note that the phase sequence isadaptive. That is, the next phase in the sequence often depends on the outcomes associated with the preceding phase. The most significant dependencies between phases are indicated by the arrows. For example, suppose that we are in the modeling phase. Depending on the behavior and characteristics of the model, we may have to return to the data preparation phase for further refinement before moving forward to the model evaluation phase.
6 CHAPTER 1 INTRODUCTION TO DATA MINING
Business / Research Understanding Phase
Data Understanding Phase
Data Preparation Phase Deployment Phase
Evaluation Phase Modeling Phase
Figure 1.1 CRISP–DM is an iterative, adaptive process.
Lessons learned from past projects should always be brought to bear as input into new projects. Following is an outline of each phase. Although conceivably, issues encountered during the evaluation phase can send the analyst back to any of the pre-vious phases for amelioration, for simplicity we show only the most common loop, back to the modeling phase.
CRISP–DM: The Six Phases
1. Business understanding phase. The first phase in the CRISP–DM standard process may also be termed the research understanding phase.
a. Enunciate the project objectives and requirements clearly in terms of the business or research unit as a whole.
b. Translate these goals and restrictions into the formulation of a data mining problem definition.
c. Prepare a preliminary strategy for achieving these objectives. 2. Data understanding phase
CROSS-INDUSTRY STANDARD PROCESS: CRISP–DM 7
b. Use exploratory data analysis to familiarize yourself with the data and dis-cover initial insights.
c. Evaluate the quality of the data.
d. If desired, select interesting subsets that may contain actionable patterns. 3. Data preparation phase
a. Prepare from the initial raw data the final data set that is to be used for all subsequent phases. This phase is very labor intensive.
b. Select the cases and variables you want to analyze and that are appropriate for your analysis.
c. Perform transformations on certain variables, if needed. d. Clean the raw data so that it is ready for the modeling tools. 4. Modeling phase
a. Select and apply appropriate modeling techniques. b. Calibrate model settings to optimize results.
c. Remember that often, several different techniques may be used for the same data mining problem.
d. If necessary, loop back to the data preparation phase to bring the form of the data into line with the specific requirements of a particular data mining technique.
5. Evaluation phase
a. Evaluate the one or more models delivered in the modeling phase for quality and effectiveness before deploying them for use in the field.
b. Determine whether the model in fact achieves the objectives set for it in the first phase.
c. Establish whether some important facet of the business or research problem has not been accounted for sufficiently.
d. Come to a decision regarding use of the data mining results. 6. Deployment phase
a. Make use of the models created: Model creation does not signify the com-pletion of a project.
b. Example of a simple deployment: Generate a report.
c. Example of a more complex deployment: Implement a parallel data mining process in another department.
d. For businesses, the customer often carries out the deployment based on your model.
8 CHAPTER 1 INTRODUCTION TO DATA MINING
CASE STUDY
1
ANALYZING AUTOMOBILE WARRANTY CLAIMS: EXAMPLE OF THE CRISP–DM INDUSTRY STANDARD PROCESS IN ACTION [17]
Quality assurance continues to be a priority for automobile manufacturers, including Daimler Chrysler. Jochen Hipp of the University of Tubingen, Germany, and Guido Lindner of Daim-lerChrysler AG, Germany, investigated patterns in the warranty claims for DaimDaim-lerChrysler automobiles.
1. Business Understanding Phase
DaimlerChrysler’s objectives are to reduce costs associated with warranty claims and im-prove customer satisfaction. Through conversations with plant engineers, who are the technical experts in vehicle manufacturing, the researchers are able to formulate specific business prob-lems, such as the following:
rAre there interdependencies among warranty claims?
rAre past warranty claims associated with similar claims in the future? rIs there an association between a certain type of claim and a particular garage?
The plan is to apply appropriate data mining techniques to try to uncover these and other possible associations.
2. Data Understanding Phase
The researchers make use of DaimlerChrysler’s Quality Information System (QUIS), which contains information on over 7 million vehicles and is about 40 gigabytes in size. QUIS contains production details about how and where a particular vehicle was constructed, including an average of 30 or more sales codes for each vehicle. QUIS also includes warranty claim information, which the garage supplies, in the form of one of more than 5000 possible potential causes.
The researchers stressed the fact that the database was entirely unintelligible to domain nonexperts: “So experts from different departments had to be located and consulted; in brief a task that turned out to be rather costly.” They emphasize that analysts should not underestimate the importance, difficulty, and potential cost of this early phase of the data mining process, and that shortcuts here may lead to expensive reiterations of the process downstream.
3. Data Preparation Phase
The researchers found that although relational, the QUIS database had limited SQL access. They needed to select the cases and variables of interest manually, and then manually derive new variables that could be used for the modeling phase. For example, the variablenumber of days from selling date until first claimhad to be derived from the appropriate date attributes.
CROSS-INDUSTRY STANDARD PROCESS: CRISP–DM 9
4. Modeling Phase
Since the overall business problem from phase 1 was to investigate dependence among the war-ranty claims, the researchers chose to apply the following techniques: (1) Bayesian networks and (2) association rules. Bayesian networks model uncertainty by explicitly representing the conditional dependencies among various components, thus providing a graphical visualization of the dependency relationships among the components. As such, Bayesian networks represent a natural choice for modeling dependence among warranty claims. The mining of association rules is covered in Chapter 10. Association rules are also a natural way to investigate depen-dence among warranty claims since the confidepen-dence measure represents a type of conditional probability, similar to Bayesian networks.
The details of the results are confidential, but we can get a general idea of the type of dependencies uncovered by the models. One insight the researchers uncovered was that a particular combination of construction specifications doubles the probability of encountering an automobile electrical cable problem. DaimlerChrysler engineers have begun to investigate how this combination of factors can result in an increase in cable problems.
The researchers investigated whether certain garages had more warranty claims of a certain type than did other garages. Their association rule results showed that, indeed, the confidence levels for the rule “If garageX, then cable problem,” varied considerably from garage to garage. They state that further investigation is warranted to reveal the reasons for the disparity.
5. Evaluation Phase
The researchers were disappointed that the support for sequential-type association rules was relatively small, thus precluding generalization of the results, in their opinion. Overall, in fact, the researchers state: “In fact, we did not find any rule that our domain experts would judge as interesting, at least at first sight.” According to this criterion, then, the models were found to be lacking in effectiveness and to fall short of the objectives set for them in the business understanding phase. To account for this, the researchers point to the “legacy” structure of the database, for which automobile parts were categorized by garages and factories for historic or technical reasons and not designed for data mining. They suggest adapting and redesigning the database to make it more amenable to knowledge discovery.
6. Deployment Phase
The researchers have identified the foregoing project as a pilot project, and as such, do not intend to deploy any large-scale models from this first iteration. After the pilot project, however, they have applied the lessons learned from this project, with the goal of integrating their methods with the existing information technology environment at DaimlerChrysler. To further support the original goal of lowering claims costs, they intend to develop an intranet offering mining capability of QUIS for all corporate employees.
10 CHAPTER 1 INTRODUCTION TO DATA MINING
Another lesson to draw is that intense human participation and supervision is required at every stage of the data mining process. For example, the algorithms require specific data formats, which may require substantial preprocessing (see Chapter 2). Regardless of what some software vendor advertisements may claim, you can’t just purchase some data mining software, install it, sit back, and watch it solve all your problems. Data mining is not magic. Without skilled human supervision, blind use of data mining software will only provide you with the wrong answer to the wrong question applied to the wrong type of data. The wrong analysis is worse than no analysis, since it leads to policy recommendations that will probably turn out to be expensive failures.
Finally, from this case study we can draw the lesson that there is no guarantee of positive results when mining data for actionable knowledge, any more than when one is mining for gold. Data mining is not a panacea for solving business problems. But used properly, by people who understand the models involved, the data requirements, and the overall project objectives, data mining can indeed provide actionable and highly profitable results.
FALLACIES OF DATA MINING
Speaking before the U.S. House of Representatives Subcommittee on Technology, Information Policy, Intergovernmental Relations, and Census, Jen Que Louie, presi-dent of Nautilus Systems, Inc., described four fallacies of data mining [18]. Two of these fallacies parallel the warnings we described above.
rFallacy 1. There are data mining tools that we can turn loose on our data
repositories and use to find answers to our problems.
◦ Reality.There are no automatic data mining tools that will solve your problems mechanically “while you wait.” Rather, data mining is a process, as we have seen above. CRISP–DM is one method for fitting the data mining process into the overall business or research plan of action.
rFallacy 2.The data mining process is autonomous, requiring little or no human
oversight.
◦ Reality.As we saw above, the data mining process requires significant human interactivity at each stage. Even after the model is deployed, the introduction of new data often requires an updating of the model. Continuous quality mon-itoring and other evaluative measures must be assessed by human analysts.
rFallacy 3.Data mining pays for itself quite quickly.
◦ Reality.The return rates vary, depending on the startup costs, analysis per-sonnel costs, data warehousing preparation costs, and so on.
rFallacy 4.Data mining software packages are intuitive and easy to use. ◦ Reality. Again, ease of use varies. However, data analysts must combine
WHAT TASKS CAN DATA MINING ACCOMPLISH? 11
To the list above, we add two additional common fallacies:
r Fallacy 5. Data mining will identify the causes of our business or research
problems.
◦Reality.The knowledge discovery process will help you to uncover patterns of behavior. Again, it is up to humans to identify the causes.
r Fallacy 6.Data mining will clean up a messy database automatically.
◦Reality.Well, not automatically. As a preliminary phase in the data mining process, data preparation often deals with data that has not been examined or used in years. Therefore, organizations beginning a new data mining operation will often be confronted with the problem of data that has been lying around for years, is stale, and needs considerable updating.
The discussion above may have been termedwhat data mining cannot or should not do. Next we turn to a discussion of what data mining can do.
WHAT TASKS CAN DATA MINING ACCOMPLISH?
Next, we investigate the main tasks that data mining is usually called upon to accom-plish. The following list shows the most common data mining tasks.
r Description
Sometimes, researchers and analysts are simply trying to find ways todescribepatterns and trends lying within data. For example, a pollster may uncover evidence that those who have been laid off are less likely to support the present incumbent in the presidential election. Descriptions of patterns and trends often suggest possible explanations for such patterns and trends. For example, those who are laid off are now less well off financially than before the incumbent was elected, and so would tend to prefer an alternative.
12 CHAPTER 1 INTRODUCTION TO DATA MINING
Estimation
Estimation is similar to classification except that the target variable is numerical rather than categorical. Models are built using “complete” records, which provide the value of the target variable as well as the predictors. Then, for new observations, estimates of the value of the target variable are made, based on the values of the predictors. For example, we might be interested in estimating the systolic blood pressure reading of a hospital patient, based on the patient’s age, gender, body-mass index, and blood sodium levels. The relationship between systolic blood pressure and the predictor variables in the training set would provide us with an estimation model. We can then apply that model to new cases.
Examples of estimation tasks in business and research include:
rEstimating the amount of money a randomly chosen family of four will spend
for back-to-school shopping this fall.
rEstimating the percentage decrease in rotary-movement sustained by a National
Football League running back with a knee injury.
rEstimating the number of points per game that Patrick Ewing will score when
double-teamed in the playoffs.
rEstimating the grade-point average (GPA) of a graduate student, based on that
student’s undergraduate GPA.
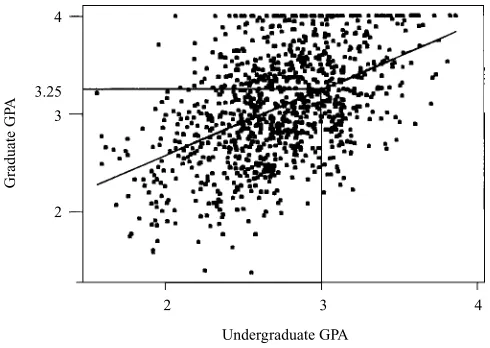
Consider Figure 1.2, where we have a scatter plot of the graduate grade-point averages (GPAs) against the undergraduate GPAs for 1000 students. Simple linear regression allows us to find the line that best approximates the relationship between these two variables, according to the least-squares criterion. The regression line, indicated in blue in Figure 1.2, may then be used to estimate the graduate GPA of a student given that student’s undergraduate GPA. Here, the equation of the regression line (as produced by the statistical packageMinitab, which also produced the graph) is ˆy=1.24+0.67x. This tells us that the estimated graduate GPA ˆyequals 1.24 plus
Undergraduate GPA
Graduate GP
A
2 3 4
4
3 3.25
2
WHAT TASKS CAN DATA MINING ACCOMPLISH? 13
0.67 times the student’s undergraduate GPA. For example, if your undergrad GPA is 3.0, your estimated graduate GPA is ˆy=1.24+0.67(3)=3.25.Note that this point (x =3.0, yˆ=3.25) lies precisely on the regression line, as do all linear regression predictions.
The field of statistical analysis supplies several venerable and widely used estimation methods. These include point estimation and confidence interval estima-tions, simple linear regression and correlation, and multiple regression. We examine these methods in Chapter 4. Neural networks (Chapter 7) may also be used for esti-mation.
Prediction
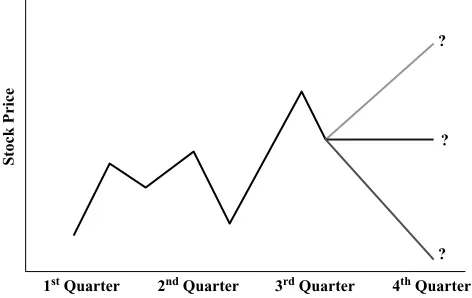
Prediction is similar to classification and estimation, except that for prediction, the results lie in the future. Examples of prediction tasks in business and research include:
r Predicting the price of a stock three months into the future (Figure 1.3) r Predicting the percentage increase in traffic deaths next year if the speed limit
is increased
r Predicting the winner of this fall’s baseball World Series, based on a comparison
of team statistics
r Predicting whether a particular molecule in drug discovery will lead to a
prof-itable new drug for a pharmaceutical company
Any of the methods and techniques used for classification and estimation may also be used, under appropriate circumstances, for prediction. These include the traditional statistical methods of point estimation and confidence interval estimations, simple linear regression and correlation, and multiple regression, investigated in Chapter 4, as well as data mining and knowledge discovery methods such as neural network (Chapter 7), decision tree (Chapter 6), andk-nearest neighbor (Chapter 5) methods. An application of prediction using neural networks is examined later in the chapter in Case Study 2.
Stock Price
? ?
?
1st Quarter 2nd Quarter 3rd Quarter 4th Quarter
14 CHAPTER 1 INTRODUCTION TO DATA MINING
Classification
In classification, there is a target categorical variable, such asincome bracket, which, for example, could be partitioned into three classes or categories: high income, middle income, and low income. The data mining model examines a large set of records, each record containing information on the target variable as well as a set of input or predictor variables. For example, consider the excerpt from a data set shown in Table 1.1. Suppose that the researcher would like to be able toclassifythe income brackets of persons not currently in the database, based on other characteristics associated with that person, such as age, gender, and occupation. This task is a classification task, very nicely suited to data mining methods and techniques. The algorithm would proceed roughly as follows. First, examine the data set containing both the predictor variables and the (already classified) target variable,income bracket. In this way, the algorithm (software) “learns about” which combinations of variables are associated with which income brackets. For example, older females may be associated with the high-income bracket. This data set is called thetraining set. Then the algorithm would look at new records, for which no information about income bracket is available. Based on the classifications in the training set, the algorithm would assign classifications to the new records. For example, a 63-year-old female professor might be classified in the high-income bracket.
Examples of classification tasks in business and research include:
rDetermining whether a particular credit card transaction is fraudulent rPlacing a new student into a particular track with regard to special needs rAssessing whether a mortgage application is a good or bad credit risk rDiagnosing whether a particular disease is present
rDetermining whether a will was written by the actual deceased, or fraudulently
by someone else
rIdentifying whether or not certain financial or personal behavior indicates a
possible terrorist threat
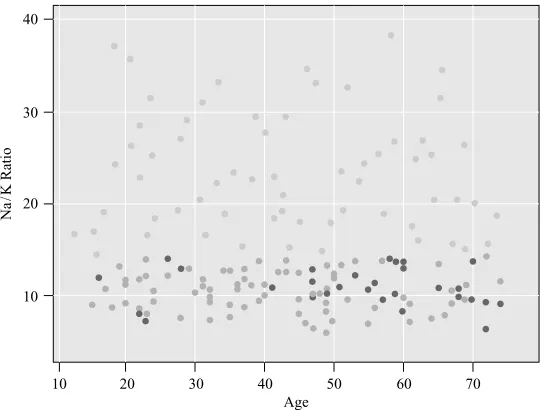
For example, in the medical field, suppose that we are interested in classifying the type of drug a patient should be prescribed, based on certain patient characteristics, such as the age of the patient and the patient’s sodium/potassium ratio. Figure 1.4 is a scatter plot of patients’ sodium/potassium ratio against patients’ ages for a sample of 200 patients. The particular drug prescribed is symbolized by the shade of the points. Light gray points indicate drug Y; medium gray points indicate drug A or X;
TABLE 1.1 Excerpt from Data Set for Classifying Income
Subject Age Gender Occupation Income Bracket
001 47 F Software engineer High
002 28 M Marketing consultant Middle
003 35 M Unemployed Low
WHAT TASKS CAN DATA MINING ACCOMPLISH? 15
Age
Na
/K Ratio
10 10 20 30 40
20 30 40 50 60 70
Figure 1.4 Which drug should be prescribed for which type of patient?
dark gray points indicate drug B or C. This plot was generated using the Clementine data mining software suite, published by SPSS.
In this scatter plot, Na/K (sodium/potassium ratio) is plotted on theY (vertical) axis and age is plotted on theX(horizontal) axis. Suppose that we base our prescription recommendation on this data set.
1. Which drug should be prescribed for a young patient with a high sodium/ potassium ratio?
◦Young patients are on the left in the graph, and high sodium/potassium ra-tios are in the upper half, which indicates that previous young patients with high sodium/potassium ratios were prescribed drug Y (light gray points). The recommended prediction classification for such patients is drug Y.
2. Which drug should be prescribed for older patients with low sodium/potassium ratios?
◦Patients in the lower right of the graph have been taking different prescriptions, indicated by either dark gray (drugs B and C) or medium gray (drugs A and X). Without more specific information, a definitive classification cannot be made here. For example, perhaps these drugs have varying interactions with beta-blockers, estrogens, or other medications, or are contraindicated for conditions such as asthma or heart disease.
16 CHAPTER 1 INTRODUCTION TO DATA MINING
Clustering
Clustering refers to the grouping of records, observations, or cases into classes of similar objects. Aclusteris a collection of records that are similar to one another, and dissimilar to records in other clusters. Clustering differs from classification in that there is no target variable for clustering. The clustering task does not try to classify, estimate, or predict the value of a target variable. Instead, clustering algorithms seek to segment the entire data set into relatively homogeneous subgroups or clusters, where the similarity of the records within the cluster is maximized and the similarity to records outside the cluster is minimized.
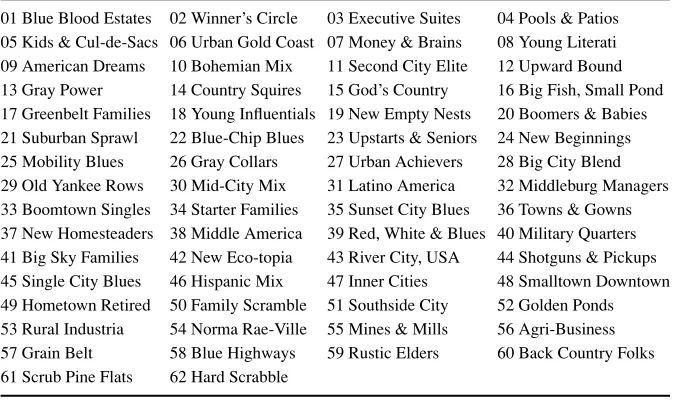
Claritas, Inc. [19] is in the clustering business. Among the services they provide is a demographic profile of each of the geographic areas in the country, as defined by zip code. One of the clustering mechanisms they use is the PRIZM segmentation system, which describes every U.S. zip code area in terms of distinct lifestyle types (Table 1.2). Just go to the company’s Web site [19], enter a particular zip code, and you are shown the most common PRIZM clusters for that zip code.
What do these clusters mean? For illustration, let’s look up the clusters for zip code 90210, Beverly Hills, California. The resulting clusters for zip code 90210 are:
rCluster 01:Blue Blood Estates rCluster 10:Bohemian Mix rCluster 02:Winner’s Circle rCluster 07:Money and Brains rCluster 08:Young Literati
TABLE 1.2 The 62 Clusters Used by the PRIZM Segmentation System
01 Blue Blood Estates 02 Winner’s Circle 03 Executive Suites 04 Pools & Patios 05 Kids & Cul-de-Sacs 06 Urban Gold Coast 07 Money & Brains 08 Young Literati 09 American Dreams 10 Bohemian Mix 11 Second City Elite 12 Upward Bound 13 Gray Power 14 Country Squires 15 God’s Country 16 Big Fish, Small Pond 17 Greenbelt Families 18 Young Influentials 19 New Empty Nests 20 Boomers & Babies 21 Suburban Sprawl 22 Blue-Chip Blues 23 Upstarts & Seniors 24 New Beginnings 25 Mobility Blues 26 Gray Collars 27 Urban Achievers 28 Big City Blend 29 Old Yankee Rows 30 Mid-City Mix 31 Latino America 32 Middleburg Managers 33 Boomtown Singles 34 Starter Families 35 Sunset City Blues 36 Towns & Gowns 37 New Homesteaders 38 Middle America 39 Red, White & Blues 40 Military Quarters 41 Big Sky Families 42 New Eco-topia 43 River City, USA 44 Shotguns & Pickups 45 Single City Blues 46 Hispanic Mix 47 Inner Cities 48 Smalltown Downtown 49 Hometown Retired 50 Family Scramble 51 Southside City 52 Golden Ponds 53 Rural Industria 54 Norma Rae-Ville 55 Mines & Mills 56 Agri-Business 57 Grain Belt 58 Blue Highways 59 Rustic Elders 60 Back Country Folks 61 Scrub Pine Flats 62 Hard Scrabble
WHAT TASKS CAN DATA MINING ACCOMPLISH? 17
The description for cluster 01, Blue Blood Estates, is: “Established executives, professionals, and ‘old money’ heirs that live in America’s wealthiest suburbs. They are accustomed to privilege and live luxuriously—one-tenth of this group’s members are multimillionaires. The next affluence level is a sharp drop from this pinnacle.”
Examples of clustering tasks in business and research include:
r Target marketing of a niche product for a small-capitalization business that does
not have a large marketing budget
r For accounting auditing purposes, to segmentize financial behavior into benign
and suspicious categories
r As a dimension-reduction tool when the data set has hundreds of attributes r For gene expression clustering, where very large quantities of genes may exhibit
similar behavior
Clustering is often performed as a preliminary step in a data mining process, with the resulting clusters being used as further inputs into a different technique downstream, such as neural networks. We discuss hierarchical andk-means clustering in Chapter 8 and Kohonen networks in Chapter 9. An application of clustering is examined in Case Study 5.
Association
Theassociationtask for data mining is the job of finding which attributes “go to-gether.” Most prevalent in the business world, where it is known asaffinity analysisor
market basket analysis, the task of association seeks to uncover rules for quantifying the relationship between two or more attributes. Association rules are of the form “If
antecedent, thenconsequent,” together with a measure of the support and confidence associated with the rule. For example, a particular supermarket may find that of the 1000 customers shopping on a Thursday night, 200 bought diapers, and of those 200 who bought diapers, 50 bought beer. Thus, the association rule would be “If buy dia-pers, then buy beer” with a support of 200/1000=20% and a confidence of 50/200=
25%.
Examples of association tasks in business and research include:
r Investigating the proportion of subscribers to a company’s cell phone plan that
respond positively to an offer of a service upgrade
r Examining the proportion of children whose parents read to them who are
themselves good readers
r Predicting degradation in telecommunications networks
r Finding out which items in a supermarket are purchased together and which
items are never purchased together
r Determining the proportion of cases in which a new drug will exhibit dangerous
side effects
18 CHAPTER 1 INTRODUCTION TO DATA MINING
Next we examine four case studies, each of which demonstrates a particular data mining task in the context of the CRISP–DM data mining standard process.
CASE STUDY
2
PREDICTING ABNORMAL STOCK MARKET RETURNS USING NEURAL NETWORKS [20]
1. Business/Research Understanding Phase
Alan M. Safer, of California State University–Long Beach, reports that stock market trades made by insiders usually have abnormal returns. Increased profits can be made by outsiders using legal insider trading information, especially by focusing on attributes such as company size and the time frame for prediction. Safer is interested in using data mining methodol-ogy to increase the ability to predict abnormal stock price returns arising from legal insider trading.
2. Data Understanding Phase
Safer collected data from 343 companies, extending from January 1993 to June 1997 (the source of the data being the Securities and Exchange Commission). The stocks used in the study were all of the stocks that had insider records for the entire period and were in the S&P 600, S&P 400, or S&P 500 (small, medium, and large capitalization, respectively) as of June 1997. Of the 946 resulting stocks that met this description, Safer chose only those stocks that underwent at least two purchase orders per year, to assure a sufficient amount of transaction data for the data mining analyses. This resulted in 343 stocks being used for the study. The variables in the original data set include the company, name and rank of the insider, transaction date, stock price, number of shares traded, type of transaction (buy or sell), and number of shares held after the trade. To assess an insider’s prior trading patterns, the study examined the previous 9 and 18 weeks of trading history. The prediction time frames for predicting abnormal returns were established as 3, 6, 9, and 12 months.
3. Data Preparation Phase
Safer decided that the company rank of the insider would not be used as a study attribute, since other research had shown it to be of mixed predictive value for predicting abnormal stock price returns. Similarly, he omitted insiders who were uninvolved with company decisions. (Note that the present author does not necessarily agree with omitting variables prior to the modeling phase, because of earlier findings of mixed predictive value. If they are indeed of no predictive value, the models will so indicate, presumably. But if there is a chance of something interesting going on, the model should perhaps be given an opportunity to look at it. However, Safer is the domain expert in this area.)
4. Modeling Phase
WHAT TASKS CAN DATA MINING ACCOMPLISH? 19
a. Certain industries had the most predictable abnormal stock returns, including: r
Industry group 36:electronic equipment, excluding computer equipment r
Industry Group 28:chemical products r
Industry Group 37:transportation equipment rIndustry Group 73:business services
b. Predictions that looked further into the future (9 to 12 months) had increased ability to identify unusual insider trading variations than did predictions that had a shorter time frame (3 to 6 months).
c. It was easier to predict abnormal stock returns from insider trading for small companies than for large companies.
5. Evaluation Phase
Safer concurrently applied a multivariate adaptive regression spline (MARS, not covered here) model to the same data set. The MARS model uncovered many of the same findings as the neural network model, including results (a) and (b) from the modeling phase. Such a conflu-ence of resultsis a powerful and elegant method for evaluating the quality and effectiveness of the model, analogous to getting two independent judges to concur on a decision. Data miners should strive to produce such a confluence of results whenever the opportunity arises. This is possible because often more than one data mining method may be applied appropri-ately to the problem at hand. If both models concur as to the results, this strengthens our confidence in the findings. If the models disagree, we should probably investigate further. Sometimes, one type of model is simply better suited to uncovering a certain type of re-sult, but sometimes, disagreement indicates deeper problems, requiring cycling back to earlier phases.
6. Deployment Phase
The publication of Safer’s findings inIntelligent Data Analysis[20] constitutes one method of model deployment. Now, analysts from around the world can take advantage of his methods to track the abnormal stock price returns of insider trading and thereby help to protect the small investor.
CASE STUDY
3
MINING ASSOCIATION RULES FROM LEGAL DATABASES [21]
1. Business/Research Understanding Phase
20 CHAPTER 1 INTRODUCTION TO DATA MINING
the delivery of legal services and just outcomes in law, through improved use of available legal data.
2. Data Understanding Phase
The data are provided by Victoria Legal Aid (VLA), a semigovernmental organization that aims to provide more effective legal aid for underprivileged people in Australia. Over 380,000 applications for legal aid were collected from the 11 regional offices of VLA, spanning 1997– 1999, including information on more than 300 variables. In an effort to reduce the number of variables, the researchers turned to domain experts for assistance. These experts selected seven of the most important variables for inclusion in the data set: gender, age, occupation, reason for refusal of aid, law type (e.g., civil law), decision (i.e., aid granted or not granted), and dealing type (e.g., court appearance).
3. Data Preparation Phase
The VLA data set turned out to be relatively clean, containing very few records with missing or incorrectly coded attribute values. This is in part due to the database management system used by the VLA, which performs quality checks on input data. The age variable was partitioned into discrete intervals such as “under 18,” “over 50,” and so on.
4. Modeling Phase
Rules were restricted to having only a single antecedent and a single consequent. Many in-teresting association rules were uncovered, along with many uninin-teresting rules, which is the typical scenario for association rule mining. One such interesting rule was:If place of birth=
Vietnam, then law type=criminal law, with 90% confidence.
The researchers proceeded on the accurate premise that association rules are interesting if they spawn interesting hypotheses. A discussion among the researchers and experts for the reasons underlying the association rule above considered the following hypotheses:
r
Hypothesis A:Vietnamese applicants applied for support only for criminal law and not for other types, such as family and civil law.
rHypothesis B:Vietnamese applicants committed more crime than other groups. rHypothesis C:There is a lurking variable. Perhaps Vietnamese males are more likely
than females to apply for aid, and males are more associated with criminal law. rHypothesis D:The Vietnamese did not have ready access to VLA promotional material.
The panel of researchers and experts concluded informally that hypothesis A was most likely, although further investigation is perhaps warranted, and no causal link can be assumed. Note, however, the intense human interactivity throughout the data mining process. Without the domain experts’ knowledge and experience, the data mining results in this case would not have been fruitful.
5. Evaluation Phase
WHAT TASKS CAN DATA MINING ACCOMPLISH? 21
6. Deployment Phase
A useful Web-based application, WebAssociator, was developed, so that nonspecialists could take advantage of the rule-building engine. Users select the single antecedent and single conse-quent using a Web-based form. The researchers suggest that WebAssociator could be deployed as part of a judicial support system, especially for identifying unjust processes.
CASE STUDY
4
PREDICTING CORPORATE BANKRUPTCIES USING DECISION TREES [22]
1. Business/Research Understanding Phase
The recent economic crisis in East Asia has spawned an unprecedented level of corporate bankruptcies in that region and around the world. The goal of the researchers, Tae Kyung Sung from Kyonggi University, Namsik Chang from the University of Seoul, and Gunhee Lee of Sogang University, Korea, is to develop models for predicting corporate bankruptcies that maximize the interpretability of the results. They felt that interpretability was important because a negative bankruptcy prediction can itself have a devastating impact on a financial institution, so that firms that are predicted to go bankrupt demand strong and logical reaso-ning.
If one’s company is in danger of going under, and a prediction of bankruptcy could itself contribute to the final failure, that prediction better be supported by solid “trace-able” evidence, not by a simple up/down decision delivered by a black box. Therefore, the researchers chose decision trees as their analysis method, because of the transparency of the algorithm and the interpretability of results.
2. Data Understanding Phase
The data included two groups, Korean firms that went bankrupt in the relatively stable growth period of 1991–1995, and Korean firms that went bankrupt in the economic crisis conditions of 1997–1998. After various screening procedures, 29 firms were identified, mostly in the man-ufacturing sector. The financial data was collected directly from the Korean Stock Exchange, and verified by the Bank of Korea and the Korea Industrial Bank.
3. Data Preparation Phase
Fifty-six financial ratios were identified by the researchers through a search of the literature on bankruptcy prediction, 16 of which were then dropped due to duplication. There remained 40 financial ratios in the data set, including measures of growth, profitability, safety/leverage, activity/efficiency, and productivity.
4. Modeling Phase
22 CHAPTER 1 INTRODUCTION TO DATA MINING
sets. Some of the rules uncovered for the normal-conditions data were as follows:
rIf the productivity of capital is greater than 19.65, predict nonbankrupt with 86% confidence.
rIf the ratio of cash flow to total assets is greater than
−5.65, predictnonbankruptwith 95% confidence.
rIf the productivity of capital is at or below 19.65andthe ratio of cash flow to total assets is at or below−5.65, predictbankruptwith 84% confidence.
Some of the rules uncovered for the crisis-conditions data were as follows:
rIf the productivity of capital is greater than 20.61, predict nonbankrupt with 91% confidence.
rIf the ratio of cash flow to liabilities is greater than 2.64, predict
nonbankruptwith 85% confidence.
rIf the ratio of fixed assets to stockholders’ equity and long-term liabilities is greater than 87.23, predictnonbankruptwith 86% confidence.
rIf the productivity of capital is at or below 20.61,andthe ratio of cash flow to liabilities is at or below 2.64,andthe ratio of fixed assets to stockholders’ equity and long-term liabilities is at or below 87.23, predictbankruptwith 84% confidence.
Cash flowandproductivity of capitalwere found to be important regardless of the eco-nomic conditions. Whilecash flowis well known in the bankruptcy prediction literature, the identification ofproductivity of capitalwas relatively rare, which therefore demanded further verification.
5. Evaluation Phase
The researchers convened an expert panel of financial specialists, which unanimously selected productivity of capitalas the most important attribute for differentiating firms in danger of bankruptcy from other firms. Thus, the unexpected results discovered by the decision tree model were verified by the experts.
To ensure that the model was generalizable to the population of all Korean manufacturing firms, a control sample of nonbankrupt firms was selected, and the attributes of the control sample were compared to those of the companies in the data set. It was found that the con-trol sample’s average assets and average number of employees were within 20% of the data sample.
Finally, the researchers applied multiple discriminant analysis as a performance benchmark. Many of the 40 financial ratios were found to be significant predictors of bankruptcy, and the final discriminant function included variables identified by the decision tree model.
6. Deployment Phase