CHAPTER III RESEARCH METHOD
This chapter discussed of Research design, Population and Sample, Research instrument of the study, Instruments Try Out, Instrument Validity, Instrument Reliability, Data collection procedures, Technique of processing data and Data analysis procedures.
A. Research Design
This study used the quantitative research. Quantitative research was design which makes used of numbers and statistical data to analyze and presents the results. Quantitative research paradigm was looking at the used of social life and the mechanistic assumptions of statistical science positivism flow of nature. Quantitative paradigm saw the world as a composite variable, meaning that a quantitative approach assumed by observing the behavior of visible (surface behavior) and the spoken word to describe human and his world.55
The writer investigated how the cause which would be an independent variable (in this study the use of word wall technique) affects the dependent variable (learning vocabulary). The writer used Experimental design because the writer had to draw the cause-effect relationship between the dependent and independent variables.56
55
Syamsudin AR, and Vismala S. Damaianti, Metode Penelitian Pendidikan Bahasa, PT Remaja Rosdakarya and Sekolah Pascasarjana Universitas Pendidikan Indonesia, 2011, p. 128-129.
56
Wina Sanjaya, Penelitian Pendidikan (jenis, metode dan prosedur), Kencana, 2013, p. 103.
The type of this study was quasi experimental design. Quasi experimental design was similar to randomized experimental design in that involves manipulation of independent variable but differ in that subjects were not randomly assigned to treatments groups.57 This design was compatible
with the writer’s purpose who wanted to evaluate the use of using word wall technique in teaching vocabulary.
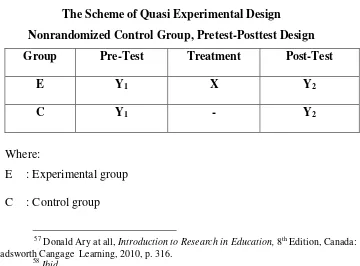
The design used nonrandomized control group pre-test, post-test design with a kind of treatment. There were two groups in this model; control class and experiment class. Both of groups were given pre-test to measure the score of students before the treatment (Y1 and Y2). The treatment was given for experiment class only (X). Post-test was given for both of groups to measure the score of students after the treatment (Y1 and Y2). The scheme of this model was:58
Table 3.1
The Scheme of Quasi Experimental Design
Nonrandomized Control Group, Pretest-Posttest Design
Group Pre-Test Treatment Post-Test
E Y1 X Y2
C Y1 - Y2
Where:
E : Experimental group C : Control group
57
Donald Ary at all, Introduction to Research in Education, 8th Edition, Canada: Wadsworth Cangage Learning, 2010, p. 316.
X : Treatment Y1 :Pre-test Y2 : Post-test B. Population and sample
1. Population
A population was defined as all members of any well defined class of people, events, or objects. If someone wanted to research all of the elements in research area, his/her research was called population research on census study.59
The population of this study was all of the eight grade students of MTs Darul Amin Palangka Raya amount 104 students, there were four classes; VIII-A, VIII-B, VIII-C and VIII-D. The scheme of this population was:
Table 3.2 the Number of the Eight Graders of MTs Darul Amin Palangka Raya
No. Classes The Number of Students
1. VIII-A 26
2. VIII-B 26
3. VIII-C 26
4. VIII-D 26
All Students 104
59
Donald Ary At All, Introduction to Research in Education, 8th Edition,
2. Sample
Sample was a subset of individuals or case from within a population.60 According to Donald Ary, the small group that was observed is called a sample.61
Cluster sampling was used if the population not an individual but a group of individuals who were naturally together.62 Because the population of this study was the students of the eight grade students of MTs Darul Amin Palangka Raya which was consist of four classes. The sample of this study was students of VIII-A as the experiment class and VIII-C as the control class. The scheme of this sample was:
Table 3.3 the Number of Samples
Class Group Number of Students
VIII-A Experiment 26
VIII-C Control 26
Total 52
C. Research Instrument of the Study
The instrument of the study was used to collect the data. The instrument used in the study was test. The test was students’ vocabulary score in multiple choice test form and there were 50 item for the try-out test. The result of the try out test was there were 15 items was invalid and there were 35 items was valid. The pre-test and pos-test used 35 items. For the pre-test in
60
David Nunan, Research Methods in Language Learning, Cambridge: Cambridge University Press, 1992, p. 232.
61
Donald Ary, Introduction to Research in Education, 2nd Edition, P. 129. 62Ibid.,
experiment class conducted on 10 August 2015 and for the pre-test in control class conducted on 11 August 2015. The post-test in experiment class conducted on 31 August 2015 and the post-test in control class conducted on 25 August 2015. The schedule to get the data was available (see appendix 1). The instrument of the study used to measure the effect of word wall technique on vocabulary mastery at eight graders of MTs Darul Amin Palangka Raya.
For the test type used the opinion from J.B Heaton. J.B Heaton stated that many types of test that could be used to test vocabulary. The test took type 1 and 2 as reference.63
Type 1, in these types of recognition items was replaced by picture. The testes saw the picture and have to select the most appropriate word.
Type 2, in this type of recognition item consisted of a definition. The testes have to select the correct option to which the definition refers.
D. Instrument Try Out
In order to prove the test was suitable to the students who were the sample of this study used try out test. Then, for try-out class was chosen the students in the same school but different class. VIII-B was as try out class with 26 students, but the students attend the class just 25 students. The test was students’ vocabulary score in multiple choice test form and there were 50 items. The try out test conducted on August, 8th 2015 at MTs Darul Amin Palangka Raya. The result of the try out test was there were 15 items was invalid and there were 35 items was valid (see appendix 6).
63
E. Instrument Validity 1. Content Validity
According to Heaton, a good test should posses’ validity: that
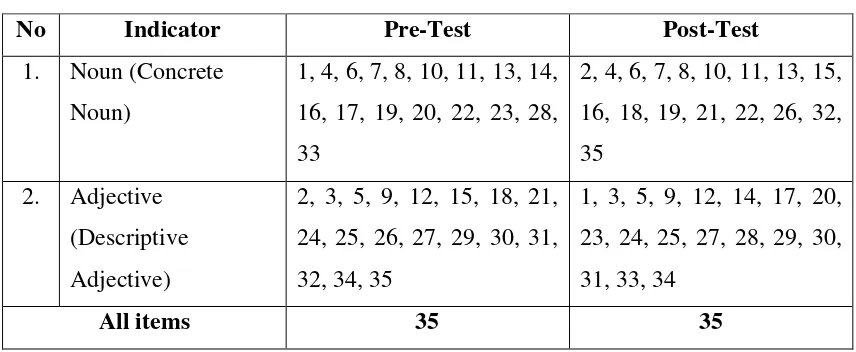
was to measure and nothing else.64 If a test does this, it said to be valid. All of the test must be related to what students learned. The test based on the material in the curriculum applied in MTs Darul Amin Palangka Raya. The following table shows the content specification of the instrument where the item distributed to the students.
Table 3.4 Content Specifications of Items Research Instrument
No Indicator Pre-Test Post-Test
1. Noun (Concrete formulation of Product Moment by Pearson as follows:65
r
xy =𝐍 𝐗𝐘−( 𝐗) ( 𝐘)
√{𝐍𝚺𝐗²−(𝚺𝐗)²}{𝐍𝚺𝐘²−(𝚺𝐘)²}
Where:
rxy : Total coefficient of correlation
64Ibid. , 65
∑X : Total values of score X
∑Y : Total values of score Y
∑XY : Multiplication result between score X and Y N : Number of students
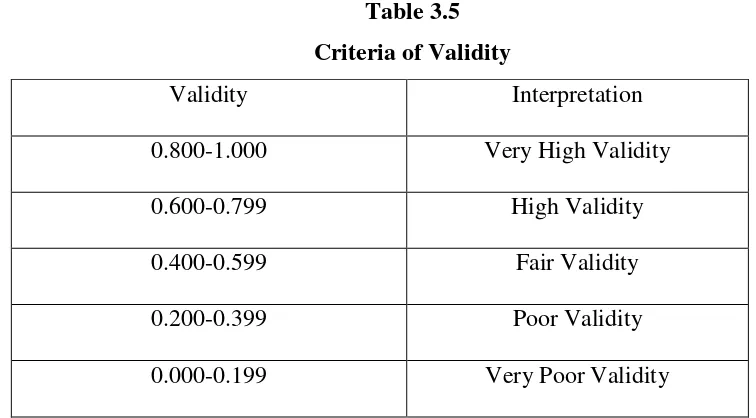
To know the level of validity of instrument, the value will be interpreted based on the qualification of validity as follows:
t-
test> t-
table = Validt-
test< t-
table = Not ValidTable 3.5 Criteria of Validity
Validity Interpretation
0.800-1.000 Very High Validity
0.600-0.799 High Validity
0.400-0.599 Fair Validity
0.200-0.399 Poor Validity
0.000-0.199 Very Poor Validity
2. Construct Validity
F. Instrument Reliability
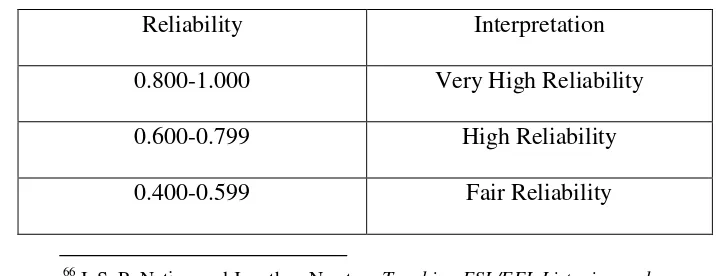
A reliable test was one whose results were not greatly affected by a change in the conditions under which it was given and marked.66 Reliability was a necessary of any good test: for to be valid at all, a test must first be reliable as a measuring instrument. The reliability test used formula of Alpha Cronbach to measure the reliability of the whole test:67
r
11=
r11 : Reliability of instrument k : Number of items
Table 3.6 Criteria of Reliability
Reliability Interpretation
0.800-1.000 Very High Reliability
0.600-0.799 High Reliability
0.400-0.599 Fair Reliability
66
I. S. P. Nation and Jonathan Newton, Teaching ESL/EFL Listening and Speaking, New York and London: Routledge, 2008, p. 166.
67
0.200-0.399 Poor Reliability
0.000-0.199 Very Poor Reliability
G. Data Collection Procedures
In collecting data, it was given pre-test first, then treatment for three times based on syllabus and ended with post-tets to the students. For treatment used Word Wall technique in experiment class and used memorizes technique in control class. In collecting the data, it used the procedure as follow:
a. The writer observed the school.
The observation purposed to get specific data were: 1. The syllabus and lesson plan of the school. 2. The number of class.
3. The number of students.
b. The writer determined two classes from the population into experiment class (VIII-A) and control class (VIII-C).
c. The writer gave try out test to try out class (VIII-B).
d. The writer gave a pre-test to the experiment class (VIII-A) and control class (VIII-C).
e. The writer taught the experiment class (VIII-A) by using word wall for three times.
g. The writer gave a post-test to experiment class (VIII-A) and control class (VIII-C).
h. The writer gave score to the main data from experiment class (VIII-A) and control class (VIII-C).
i. The writer analyzed the data that have been obtained from pre-test and pos-test used manual calculation and SPSS 21 program.
j. The writer interpreted the analysis result. Based on the scores obtained from pre-test and post-test, it was analyzed by finding the mean of the
students’ pos-test score to test the hypothesis. H. Technique of Processing Data
1. Editing: this activity did in order to check of the data that to anticipate mistakes happens, so the data should be valid and suitable with the need.
2. Coding: after the processing of editing, the second step was exchange codes from the data. Code was a sign made in number or letters that is given to identify in information or data that was to analyze to change
the students’ name. Each of the answer sheets was replaced by the code,
for example: A1, B1.
I. Data Analysis Procedures
The data of this study were students’ vocabulary score. Therefore,
the data were quantitative. The pre-test and post-test raw score converts into percentages. The mean, standard deviation and standard error of students’ score computed for the pre-test and post-test scores of the experiment and control groups. For calculation used statistical ttest to answer the problem of the study. In order to analyze the data, it did some way procedures:
1. Gave tests (pre-test and post-test) to the students at eight grade students of MTs Darul Amin Palangka Raya.
2. Collected the score of the students work sheet result. 3. Score the students’ answer using the formula:
S = 𝒏
𝑵
×
𝟏𝟎𝟎
Where:
S : Students’ score
n : Number of true answer N : Number of tests items
4. Tabulated the data into the distribution of frequency of score table, then
find out the mean of students’ score, standard deviation, and standard error of variable X1 (Experiment class) and X2 (Control class) by using the formulas bellow:
a. Mean of students’ score68
68
𝐗 = 𝒇𝑿ᵢ SD : Standard deviation
N : Number of cases 1 : Bilangan konstan 5. Normality Test
It used to know the normality of the data that was going to be analyzed whether both groups has normal distribution or not. For the normality test was used SPSS 21 program. Then, calculation result of X2observed was compared with X2table.
6. Homogeneity Test
69
Triwid Syafarotun Najah, Statistik Pendidikan, STAIN Palangka Raya, 2012, p. 62.
70
It used to know whether experimental group and control group that were decide, come from population that has relatively same variant or not. For the calculation used SPSS 21 program.
7. Calculates the data by using ttest to test the hypothesis of the study,
whether the using of word wall gave effect to the students’ vocabulary
scores or not. To examined the hypothesis used ttest formula as follows: a. It calculated the standard error of the difference between X1 and X2
as follow:71
SEM1– SEM2 = 𝑆𝐸𝑚1 2+ (𝑆𝐸𝑚2)²
b. Then, it inserted to the formula to get value of tobserved as follow:72 To = 𝑀1−𝑀2 freedom (df) with the formula:73
df = 𝑵𝟏+𝑵𝟐 − 𝟐 Where:
df: Degrees of freedom
71
Triwid Syafarotun Najah, p. 97. 72Ibid.,
73
N1: Number of subject group 1 N2: Number of subject group 2 2: Number of variable
After that, the value of ttest consulted on the ttable at the level of significance 1% and 5%. In this study, the writer used the level of significance at 5%. If the result or ttest was higher than ttable, it meant Ha was accepted. But if the result of ttest was lower than ttable, it means Ho was accepted.
9. After calculated the data by using manual, then calculated the result ttest to test the hypothesis of the study by using SPSS 21 program.
10.Then, the interpretation was made to answer the research problem. 11.The last, discussed and concluded the result of data analysis.
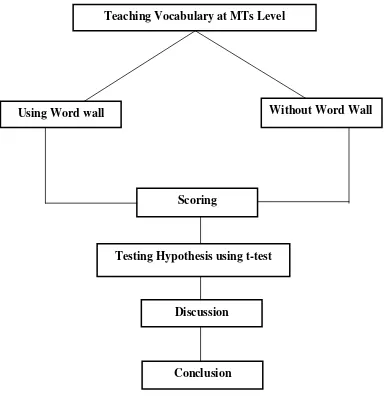
Figure 3.1
the Procedure of Collecting of the Data and Analysis of the Data
Teaching Vocabulary at MTs Level
Using Word wall Without Word Wall
Discussion
Testing Hypothesis using t-test