JIPSA. VOL. 16. No. 25. Desember 2016 61
RESIDENTIAL BUILDINGS RISK LEVEL AGAINST TSUNAMI IN ULEE LHEUE VILLAGE, MEURAXA SUB-DISTRICT, BANDA ACEH
Siti Nidia Isnin
Dosen Program Studi Geografi FKIP Universitas Almuslim
ABSTRACT
On 26th of December 2004, a giant wave ‘Tsunami’ was triggered by enourmous earthquake of 9 richter scale in magnitude located in Indian Ocean, to the west of Sumatra Island. Ulee Lheue is one of many villages that is bordered directly with coastal area and had endured negative impacts in term of damaging lands and infrastructures, especially residential buildings which are
the private property of the people. This event is critical to study further focusing on ‘Residential
Buildings Risk Level against Tsunami in Ulee Lheue Village, Meuraxa Sub-district, Banda Aceh’, in order to initiate disaster risk reduction activities. This study is aiming to determine the level of the Tsunami potential danger, to determine the level of vulnerability of Residential Buildings against the Tsunami and to determine the level of the residential buildingsrisk against the Tsunami . Determining the level of the Tsunami potential danger is based on coastal line inundation modelling which are 1 m, 2 m, 5 m, 15 m and 30 m. This study is considered the residential buildings as element at risk. The level of residential buildings vulnerability risk against the Tsunami is based on relative vulnerbility index (RVI) of PTVA-3 model and its modifications. The level of the residential buildings risk against the Tsunami is based on building nominal losses classification. The risk level of residential building according to PTVA-3 and modification model, the majority of Ulee Lheue residential buildings are at loss level class 1 and class 2.
Keyword: Risk, Tsunami, Residential Buildings, Ulee Lheue Village
INTRODUCTION
Aceh is the westernmost province in Indonesia which are part of Sumatra Island. The western part of Sumatra Island are the subduction zone between the Indo-Australian Plate with the Eurasian Plate. The Indo-Australian Plate subducting under the Eurasian plate under the influence of gravity. This movement causes the cracked. The cracked caused an earthquake 9 Richter scalefollowed by a tsunami on 26 December 2004 (Cassidy, 2015). According to (Hadmoko, et al., 2007), Tsunami which occurred in Aceh caused by an earthquake with a 9.00 magnitude in the Indian Ocean west of Sumatra.
Data from the Department of Regional Infrastructure and Resettlement Aceh Province in 2005 in the study (Zulkarnaini, 2007) showed that Meuraxa including one of the districts in Banda Aceh, which has most severely affected by the tsunami, for more details seen in Table 1.1 Sub-District is experienced the biggest victim 25.561 life whether dead or missing. The worst damage to houses that 4,949 houses, with details of 4,766 heavily damaged, 156 moderately damaged and 27 slightly damaged.
JIPSA. VOL. 16. No. 25. Desember 2016 62
measured using two factors, namely the level of danger and the degree of vulnerability.
The research of tsunami risk level in the Ulee Lheue Village Meuraxa district of Banda Aceh focused on physical vulnerability with the risk elements is shelter buildings. Shelter building become the most important issue in the post-disaster management, as shelter building become a primary need for humans. Shelter building into a human shelter from heat and rain, and can provide a sense of secure. Disaster risk level assessment will provide the location information that has a high and low risk level, which is useful for disaster management.
Based on the background and issues that have been explained, then compiled the research objectives:
1. To determine risk level of Tsunami in the Ulee Lheue Village
2. To determine vulnerability level of shelter building to Tsunami in the UleeLheue Village.
3. To determine the risk level of shelter buildings to Tsunami in the Ulee Lheue Village.
Hazard Level In UleeLheue Village
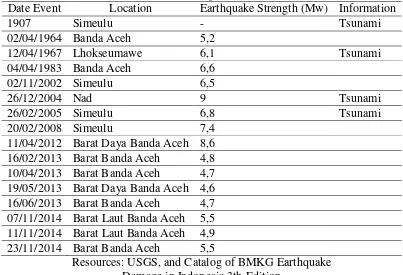
Table 1 shows the tsunami in Aceh. During the 107 years ever happened four times Tsunami. Tsunami that happened in Aceh is at 1907, 1967, 2004 and 2005. The tsunami disaster is an extreme disaster. The tsunami is a natural disaster that cannot be prevented and cannot also predict when it will happen (Triatmadja, 2010), therefore, in this study, the potential tsunami spatially expressed in insecurity, because of the potential Tsunami spatially cannot be declared adverb of time.
Table 1. Historical Data Earthquake and Tsunami in Aceh
Date Event Location Earthquake Strength (Mw) Information
1907 Simeulu - Tsunami
02/04/1964 Banda Aceh 5,2
12/04/1967 Lhokseumawe 6,1 Tsunami
04/04/1983 Banda Aceh 6,6
02/11/2002 Simeulu 6,5
26/12/2004 Nad 9 Tsunami
26/02/2005 Simeulu 6,8 Tsunami
20/02/2008 Simeulu 7,4
11/04/2012 Barat Daya Banda Aceh 8,6
16/02/2013 Barat Banda Aceh 4,8
10/04/2013 Barat Banda Aceh 4,7
19/05/2013 Barat Daya Banda Aceh 4,6
16/06/2013 Barat Banda Aceh 4,7
07/11/2014 Barat Laut Banda Aceh 5,5 11/11/2014 Barat Laut Banda Aceh 4,9
23/11/2014 Barat Banda Aceh 5,5
JIPSA. VOL. 16. No. 25. Desember 2016 63
Map of the vulnerability of the tsunami using the basis of a map of land use and slope, the potential hazard is determined from each scenario, the scenario height inundation 1 meter, scenario height of a inundation of 2 meters, the scenario height of a inundation of 5 meters, the scenario height inundation 15 meters, and the scenario height a inundation of 30 meters. Map of potential danger as presented in Figure 2.1, 2.2, 2.3, 2.4, and 2.5 using the basis of a map of land use and slope. From the data of land use converted to obtain surface roughness index. Roughness coefficient indicates the water's ability to qualify for admission to main land. Tsunami inundation modeling can be performed using a model of Hawke's Bay. This model consider height of the waves from the beach, the coefficient of surface roughness and slope (Berryman, 2006). Model Hawke's Bay has the equation as follows:
HLoss = (167. n2/H01/3)+5.Sin S
Description:
HLoss= Loss of wave height per meter of distance puddle
H0 = High waves from the beach
n = coefficient of surface roughness s = slope
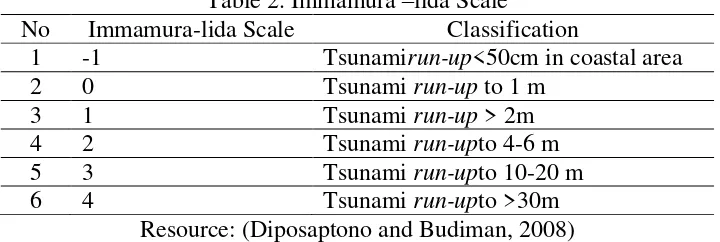
This equation can be implemented using Arcgis software. Arcgis software offers cost-distance function that is suitable for the applicationof the equation.(Diposaptono &Budiman, 2008) explains that the level of tsunami waves (run-up) and the resulting energy can be classified in the magnitude scale is called the scale Imamura. Imamura scale can be seen in Table 2.
Table 2. Immamura –lida Scale
No Immamura-lida Scale Classification
1 -1 Tsunamirun-up<50cm in coastal area
2 0 Tsunami run-up to 1 m
3 1 Tsunami run-up > 2m
4 2 Tsunami run-upto 4-6 m
5 3 Tsunami run-upto 10-20 m
6 4 Tsunami run-upto >30m
Resource: (Diposaptono and Budiman, 2008)
JIPSA. VOL. 16. No. 25. Desember 2016 64
Table 3. The area based on the level of vulnerability
Scenario (m)
Area of Vulnerability (Ha)
<1m 1-2m 2-5m 5-15m 15-30
m
Total
Very Low Low Medium High Very
High
1.00 21.91 - - - - 21.91
2.00 15.40 21.98 - - - 37.38
5.00 5.06 2.59 41.16 - - 48.81
15.00 0.98 1.39 6.75 80.96 - 90.08
30.00 - - - 1.75 90.091 91.841
Resource: Result of analysis, 2015
The Vulnerability Level Residential Buildings in Ulee LheueVillage
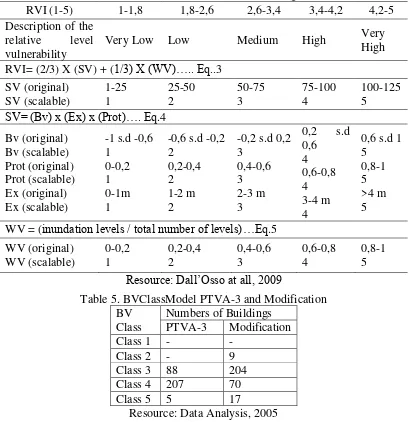
The assessment of the level of vulnerability used PTVA-3 model and the modified model. Model PTVA-3 was developed to provide a measurement of building vulnerability of tsunami. PTVA-3 models only consider to the effect of the tsunami inundation without considering the earthquake that caused the tsunami. Model modifications, continue to use the equations of the model PTVA-3, only the modification in the weighting of each variable structure of the equation PTVA-3 to include consideration of the earthquake in the measurement of vulnerability. According to (Dall'Osso et al, 2009) the results of measurements using models PTVA-3 is the index of relative vulnerability or RVI of each building. RVI value is computed based on the weighted two components, namely the vulnerability associated with the carrying capacity of the building (SV) and the vulnerability of the building because the building contact with water (WV). Variables to measure the bearing capacity of the building include the attributes of the building structure (BV), the degree of protection (Prot) is available for the building, the depth of puddles / exposure (Ex) on the location of the building standing. Variable for measuring contact with the water is high building homes that were flooded by the tsunami (Dall'Osso et al, 2009), as presented in Table 3.1. The RVI model equation is as follows:
RVI = 2/3 (SV) +1/3 (WV) SV = (BV) x (prot)
BV (-1 + 1) = 1/423 (100.s + 80.m + 60.f 63.g + + 51.mo + 46.so + 23 .pc) so: the shape of the building orientation
mo: moving objects s: number of floors
m: building materials and construction techniques g: hidrodinamisasi ground floor
f: foundation
pc: building maintenance
Prot (0 + 1) = 1/301 (100 SwProtProtbw + 73 + 73 + 55 Protwprotnb) Protbw: rows of buildings
Protsw: the existence of a sea wall Protnb: natural obstacles
JIPSA. VOL. 16. No. 25. Desember 2016 65
WV = (inundation levels / total number of levels)
The differences of ballast in BV indicators of both models produce a number of residential buildings in each class of the two models are also different. The number of buildings using models PTVA-3 majority were in grade 4, which amounted to 207 buildings, the cause is the number of buildings that have first floor are a number of 218 buildings. Indicator of the number of floors in the model PTVA-3 be an indicator that has the highest weight of the overall indicator. The number of buildings using the modification model majority are class 3, which shows a lower class level be compared using PTVA models. This is because the effect of the number of residential building shallow foundations are 284 buildings. The foundations of buildings in the modified model has the second highest weight after weight building materials. The details of material for both models, can be seen in Table 4.
Table 4. RVI Scores for Each Building
RVI (1-5) 1-1,8 1,8-2,6 2,6-3,4 3,4-4,2 4,2-5
WV = (inundation levels / total number of levels)…Eq.5
WV (original)
JIPSA. VOL. 16. No. 25. Desember 2016 66
Ulee Lheue on shelter buildings, including low, it is in 3rd class, 4th class and 5th class. There are 50 buildings that were in the 3rd grade, 164 buildings are in grade 4 and 86 buildings are in 5th class. The low level of protection in the village of Ulee Lheue is caused by the lack of coastal protection and it also because a lot of shelter buildings do not have a brick wall around the building.
Table 6. Protection Class
Class Protection Number of Buildings Percentage
Class 3 50 17
Class 4 164 55
Class 5 86 29
Total 300 100
Resource: Data Analysis, 2015
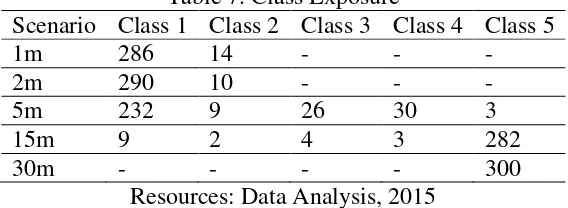
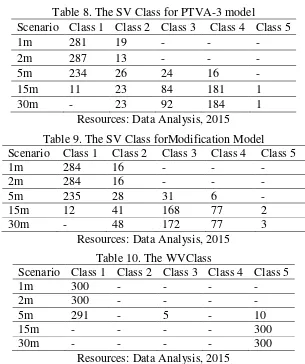
Exposure is one of the vulnerability levels of buildings for the tsunami inundation model. The higher the tsunami inundation of the shelter building, the greater the damage will be. Tsunami inundation heights obtained from inundation modeling scenarios. Table 7. presents the class exposure for each inundation scenario. In the scenarios of 1 m and 2 m, shelter buildings are in 1st and 2nd class. In the scenario of 5m, the exposure grade against the stagnant building has been diverse, there are 232 residential buildings are in 1st grade, 9 buildings are in 2nd class, 26 buildings are in 3rd class, 30 buildings are in 4th and 5th class. For the 15 m scenario, only few buildings are in 1st to 4th class, almost every building (282 buildings) are in 4th class. For the 30 m scenario, every building is in 3rd class.
Table 7. Class Exposure
Scenario Class 1 Class 2 Class 3 Class 4 Class 5
1m 286 14 - - -
2m 290 10 - - -
5m 232 9 26 30 3
15m 9 2 4 3 282
30m - - - - 300
Resources: Data Analysis, 2015
The calculation of SV level by using the PTVA-3 model and the modified model has a vulnerability class from 1st to 5th class. Based on each scenario, SV wave height levels are vary. Table 7 presents the level of PTVA-3 models and Table 7. presents the SV level of modification models for each scenario.
JIPSA. VOL. 16. No. 25. Desember 2016 67
Table 8. The SV Class for PTVA-3 model
Scenario Class 1 Class 2 Class 3 Class 4 Class 5
1m 281 19 - - -
2m 287 13 - - -
5m 234 26 24 16 -
15m 11 23 84 181 1
30m - 23 92 184 1
Resources: Data Analysis, 2015
Table 9. The SV Class forModification Model Scenario Class 1 Class 2 Class 3 Class 4 Class 5
1m 284 16 - - -
2m 284 16 - - -
5m 235 28 31 6 -
15m 12 41 168 77 2
30m - 48 172 77 3
Resources: Data Analysis, 2015
Table 10. The WVClass
Scenario Class 1 Class 2 Class 3 Class 4 Class 5
1m 300 - - - -
2m 300 - - - -
5m 291 - 5 - 10
15m - - - - 300
30m - - - - 300
Resources: Data Analysis, 2015
In the scenario of 1 m and 2 m wave height, the entire residential buildings are in very low class. In the scenario of 2 m, the entire shelter buildings are also in very low class. This is caused by the SV value of each building that is also in low class, those are in class 1 or 2. In the scenario of 5 m, 15 m and 30 m, RVI class varies greatly. In the scenario of 5 m, almost all of the buildings are in very low class, the number of it are 243 shelter buildings. The rest are in the low class, medium and high. At the high class there were only three shelter buildings. In the scenario of 15 m, most of shelter buildings are in high class, there are 175 shelter buildings. In the low class there are 11 shelter buildings. In the scenario 30 m, the most of buildings in the high class, there are 177 shelter buildings and 146 shelter buildings in medium class. The description RVI Class can be showed in Table 11.
Table 11. RVI Class Modification
Scenario Very low Low Medium High Very High
1m 300 - - - -
2m 300 - - - -
5m 259 31 10 - -
15m - 11 39 175 75
30m - - 46 177 77
JIPSA. VOL. 16. No. 25. Desember 2016 68
Risk Level of Shelter Building toward Tsunami
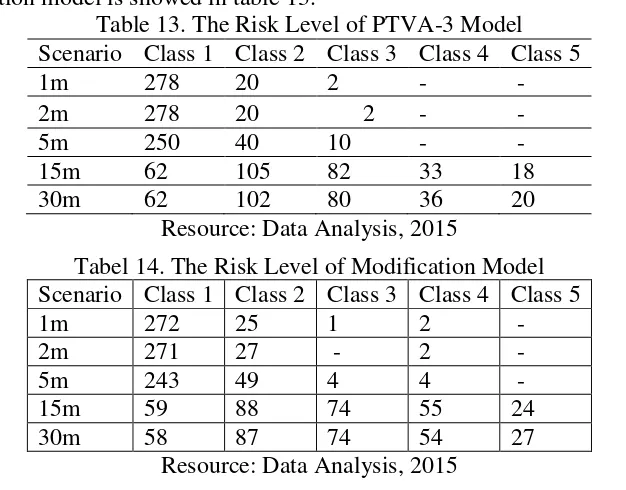
The building risk is counted based on hazard function, vulnerability, and building cost. The calculation of Tsunami risk is based on each the high of Tsunami scenario. The result of risk is divided into 5 class, start form 1st class to 5th class. The level of risk is stated as class. The class as high as nominal that showed as high as level of its losses. Table 4.1 showed the class risk with PTVA-3 Model and modification model.
Table 12. Class Risk with Model PTVA-3 and Modification Class1 IRD 219.120 IRD 1.365.056
Class 2 IRD 1.365.056 IRD 2.510.992 Class 3 IRD 2.510.992 IRD 3.656.928 Class 4 IRD 3.656.928 IRD 4.802.864 Class 5 IRD 4.802.864 IRD 5.948.800
Resource: Data Analysis, 2015
PTVA-3 Risk Model is a function from PTVA-3 model for vulnerability level, hazard, and taxable value of building. Class detail based on scenario can show on table 4.2. On the scenario 1 m there are three class, class 1-3. Class 1 there are 270 shelter buildings, class 2 there are 28 shelter buildings, and class 3 there are 2 shelter building. On the scenario 2 m has three class, class 1-3. The numbers of shelter buildings on class 1 are 270 buildings, class 2 are 28 buildings, and class 3 are 2 buildings. On the scenario 5 m there are three class, class 1 are 240 buildings, class 2 are 49 buildings, and class 3 are 11 buildings. On the scenario 15 m and 30 m has five class, class 1-5. Class 1 on scenario 15 m there are 42 shelter buildings, class 2 there are 116 shelter buildings, class 3 there are 78 shelter buildings, class 4 there are 42 shelter buildings, and class 5 there are 22 shelter buildings. Class 1 on the scenario 30 m there are 39 shelter buildings, class 2 there are 117 shelter buildings, class 3 there are 76 shelter buildings, class 4 there are 44 shelter buildings, and class 5 there are 24 shelter buildings. Scenario 1 m, 2 m and 5 m the most numbers of buildings is class 1 or very low class. Scenario 15 m and 30 m the most numbers of shelter buildings is class 2, but it has not significant different among its class. The map of PTVA-3 Risk level model can see on appendix 29, 30, 31, 32, and 33.
JIPSA. VOL. 16. No. 25. Desember 2016 69
buildings is in class 2 but the same thing with PTVA-3 model, the numbers of buildings in each class has a value with not significant different. The risk level of modification model is showed in table 13.
Table 13. The Risk Level of PTVA-3 Model Scenario Class 1 Class 2 Class 3 Class 4 Class 5
1m 278 20 2 - -
2m 278 20 2 - -
5m 250 40 10 - -
15m 62 105 82 33 18
30m 62 102 80 36 20
Resource: Data Analysis, 2015
Tabel 14. The Risk Level of Modification Model Scenario Class 1 Class 2 Class 3 Class 4 Class 5
1m 272 25 1 2 -
2m 271 27 - 2 -
5m 243 49 4 4 -
15m 59 88 74 55 24
30m 58 87 74 54 27
Resource: Data Analysis, 2015
CONCLUSION
The result of research that discussion on previous session give us conclusion as bellow:
1. The Tsunami hazard based o scenario run-up is different each other, both in hazard level and wide and high of inundation. Scenario 1 -5 m has hazard level in very low class till medium. Scenario 15-30 m, hazard level has been in very high class. The prone level of Tsunami is influenced by run-up, surface roughness, topography, and distance inland from the sea. The lower run-up, high surface roughness, rugged topography and distance inland away from the sea shows a low level of vulnerability. The higher the run-up, low coefficient of surface roughness, topography sloping, and the distance of the land and sea are close, would indicate a high level of vulnerability.
2. The vulnerability level of shelter buildings on the scenario run-up 1-5 m majority the buildings is in very low class, on scenario 15-30 m majority buildings is in high class. The vulnerability level of shelter buildings is influenced by buildings structure, building exposures with water, protection, and the numbers of floors that inundation. The better the quality of the building structure, the lower the exposure of the building to the water, the higher the protection, and the smaller the number of floors that inundated the lower the level of vulnerability.
JIPSA. VOL. 16. No. 25. Desember 2016 70
buildings. If the vulnerability in period of time has been decrease so that risk level will be decrease too. Hazard level is a something certainly happened, and value of element at risk will increased, so that to ensure that the risk level decrease is considered the quality of shelter buildings and protection to its shelter buildings.
REFERENCES
Bastian, I. (2006). Valuasi Risiko Bencana. Prosiding Seminar Nasional
Pelacakan Valuasi Risiko Bencana (p. 5). Yogyakarta: Pusat Studi
Bencana Universitas Gadjah Mada.
Cassidy, J. F. (2015). The 2004 Sumatra Earthquake And Tsunami: Lesson Learned In Subduction Zone Science And Emergency Management For The Cascadia Subduction Zone. Pure Appl. Geophys, 835.
Dall'Osso, F., Gonella, M., Gabbianelli, G., Withycombe, G., & Dominey, D. H. (2009). A Revised (PTVA-3) Model for Assessing the Vulnerability of Buildngs to Tsunami Damage. Natural Hazard Earth System Science, 1557-1565.
Mardiatno, D., Marfa'i, M. A., Rahmawati, K., Tanjung, R., Sianturi, R. S., & Mutiarni, Y. S. (2012). Penilaian Multirisiko Banjir Dan ROB Di
Kecamatan Pekalongan Utara. Yogyakarta: RedCarpet Studio.
Zulkarnaini. (2007). Kinerja Badan Rehabilitasi Dan Rekontruksi (BRR) Dalam Pembangunan Rumah Pengungsi Korban Gempa Dan Tsunami Di