SIMULATION OF ONE-WAY TRAFFIC FLOW
WITH DATA OF ROAD CHARACTERISTICS
AS INPUT
Junaidi, Said Munzir and Marwan Ramli
Abstract. This study examines the Traffic Flow models to build an application that is used to simulate the evacuation of the earthquake and tsunami in Banda Aceh. The application is built so that it is possible to entry the path characteristics data as input. Tests performed simulations using the path characteristic data of T. Nyak Arief from Simpang Mesra until Bundaran Rukoh. Simulations are built using traffic flow model and finite difference numerical method for the solution approach. In this study, numerical simulations built with the aim to determine the length of the vehicle density in the evacuation path of the earthquake and tsunami. This study uses a model Greenshield to build traffic flow models and numerical finite difference method to build numerical simulation. To resolve this problem required initial conditions and boundary conditions. Point of the vehicle on track inflows into the boundary condition simulation study. Initial conditions of this study is the density of vehicles along the path simulation at timet0is zero. Implementation of numerical simulation use Graphical User Interfaces (GUI), to look at the charac-teristics of the movement of the traffic flow. Applications built also able to calculate the level of efficiency of the evacuation process in a way.
1. INTRODUCTION
Transportation is part of society mechanism which is in line with the increased mobility needs of the society. The level of mobility in the society will influence the character of the community and their levels of productivity.
Received 15-11-2014, Accepted 25-12-2014.
2010 Mathematics Subject Classification: 81T80
Key words and Phrases: Traffic simulation, Finite difference method, Greenshield model.
Ground transportation activity associated with roads and vehicles as its facilities is commonly called as road traffic. The common problems of the road are traffic accidents and congestion. Traffic jams are usually increased with increment of mobility transport users, especially during busy times [?]. There are three parameters that can be used to analyze the traffic behavior namely speed, density and traffic flow. These three parameters affect each other and those parameters can be expressed in a mathematical model. The study about mathematical model for estimating and controlling traffic flow has been carried out since 1935 [2].
The approach used to model traffic flow is consisted of picoscope, mi-croscopic, mesoscopic and macroscopic approaches [3]. One of researches conducted on traffic flow models was made by Kabir et al [4] by using a traffic flow model approach with inconstant speed which was depend on its rider, then, the model of traffic flow was simulated by Nahidet al [5]. Traffic flow model studied by Kabir is the of traffic flow model at inconstant speed which was depended on its driver. The model studied is a model that has special characteristics. As the result, the model cannot be used to solve the traffic problems. The congestion occurred produces quite a big negative impact. Therefore, many researches related to decrement of bottlenecks pro-cess have been conducted. Ahmadet al [6] have analyzed the traffic flow at the intersection of urban road by using a timer digital on the traffic lights. Yang et al [7] have gained the model of traffic flow network for highways and urban roads by developing NTFM (Network Level Traffic Flow Model). Congestion is one of the factors that affect the level of success in the process of evacuation. Including the evacuation of disaster due to the catas-trophe such as forest fires, floods, earthquakes, tsunamis or due to human activities such as disasters caused by industrial accident, nuclear reactor leak for example. The problem arise from these disasters is about finding the way to evacuate people to avoid many casualties. Ground transportation is a disaster evacuation route that is widely used as mentioned by Dash and Gladwin [8]. According to Lindell and Prater [9] the success of an evacuation is dependent on many factors including warning time, community prepared-ness, response time, information and dissemination of guidance procedures, evacuation routes, traffic conditions and steps of the dynamic traffic man-agement. A disaster evacuation scenario can be used to plan the best way to avoid or reduce the impact of the disaster.
evacua-tion of man-made disasters like chemical leak in factories. Mahfuzailda [12] conducted a study on modeling and simulating the traffic flow in the area of disaster evacuation route in Banda Aceh. Aceh geographical conditions that are at a meeting between Asian and Australian plates as well as at the tip of Sumatra fault, resulting in placing Aceh in the disaster-prone areas. Disaster-prone areas are including the areas of the tidal wave, flood-prone and prone to tsunamis. On December 2004 Aceh was hit by the earthquake and tsunami, based on the experience, people tried to escape to plateau region. One of their destinations was the Sultan Iskandar Muda Airport at Blang Bintang. One path to get there was through Darussalam. As a re-sult, congestion on the bridge Lamnyong arise. This is underlying research to assess the disaster scenario of a good evacuation route and expected to minimize the risk of disasters. Scenarios evacuation route studied is one-way evacuation route with the characteristics of the road as the input. So, it is expected that the simulation result can be used on the evacuation route for other areas.
This study is related to one-way traffic flow in order to evacuate the earthquake and tsunami with the characteristics of the road as the input by using traffic flow modeling. The characteristics mean the density and the average speed of vehicles for motorcycles and cars. This study aims to build an evacuation application of the earthquake and tsunami as well as to simulate it based on the road conditions around the city of Banda Aceh. Application constructed in such a way that it is possible to input the data of road characteristics as the input. So the application is expected to be applied to variety of roads in Banda Aceh.
2. RESEARCH METHODOLOGY
2.1. Identification of problems and requirements
To create a mathematical model of traffic density, early identification is needed to determine the boundary conditions and initial conditions. As-sumptions considered indispensable in building a mathematical model. In this study assumptions used as follows:
1. Data taken in the form of a single data is one-way street used as an evacuation route of the earthquake and tsunami around Banda Aceh.
3. No vehicles precede each other.
4. Vehicle studied consisted of motorcycles and cars.
2.2. Formulations
To obtain formulations of traffic flow modeling in one-way evacua-tion route, it is used the data density of vehicles in several one-way streets. This model is obtained by using the method Greenshield where the data den-sity of vehicles regressed early, then substituted into the model Greenshield namely:
ρd is obtained by the formula:
vf
To get the speed of the motorcycle formulation, it is assumed that
a0=vf anda1 =−ρvfd, value ofa0, a1 gained from the regression of the data density and average speed of the motorcycle. To get the speed of the car formulation, it is assumed that b0=vf and b1=−vρfd, value ofb0, b1 gained from the regression of the data density and average speed of the car. The value a0 =vf and b0, b1 are substituted into the model Greenshield. Thus, it is obtained the formulation of motorcycles and cars speeds as follows:
vs(ρ) =a0+a1ρs (1)
vm(ρ) =b0+b1ρm (2)
where a0 and a1 are regression coefficient for the speed of the motorcycle thenb0 and b1 are regression coefficient for the speed of the car.
Equation (1) is an equation of average speed for motorcycle that depen-dent on density and equality. Equation (2) is the average velocity equation cars that depend on the density. Those two equations then substituted into the model of traffic flow as follows:
∂ρ ∂t +
∂q
To obtain the traffic flow formulations (q) for motorcycle and car, equation (1) and (2) are substituted to equation of q=v×ρ, results:
qs(ρ) = (a0+a1ρs)ρs (4)
qm(ρ) = (b0+b1ρm)ρm (5)
Because the function of traffic flow (q) is dependent function toward the density (ρ), so the equation (3) can be written as:
Equation (4) and (5) substituted into the equation (6) so it is obtained a model of traffic flow for motorcycles and cars as follows:
∂ρ
The initial value of this research is assumed as a disaster occurs at night, so that the density of the vehicle at time t= 0 is zero. The equation is formed from the initial value problem is namely:
ρ(0, x) = 0, 0< x <road length (meters)
This study boundary condition assumed is the changes of vehicle den-sity over time in each of inflow. Models studied are using equation (7) and (8) with the initial conditions and boundary conditions as follows:
1. Initial conditions:
The initial conditions in this study are:
(a) a) It is assumed that the disaster occurs at the time of vehicle density in any point in initial time (t = 0) is zero, stated as follows:
(b) b) It is assumed that the disaster occurs at the busy time (working time) so that the vehicle density in any point at the time of zero seconds is expressed as follows:
ρ(0, x) =ρ0, 0< x <road length (meters)
2. Boundary conditions:
Vehicle density in any point of inflow was started from the starting point to the end point of the evacuation route.
2.3. Mathematical Solutions
Mathematical model equations (7) and (8) are solved numerically to obtain its solution. Steps completion as follows:
1. Mathematical model and conditions that exist are discredited using finite difference method. It aims to transform the model of continuous function into discrete form. The discretization used as follows:
(a) ∂ρ∂t using different approaches advanced difference to be ρi,j+1−ρi,j
△t (b) ∂ρ∂xusing different approaches accelerated difference to be ρi,j−ρi−1,j
△x
2. Determined value of△xand△twhich are corresponding, in this study, select any value (an input) by doing stability simulations testing. Cri-teria for the limit of stability for traffic flow models on the numerical upwind scheme based on Courant number (C). If the explicit method is used, the value should be C ≤1, v: C = q△′△xt so that the value of
3. RESULTS AND DISCUSSION
3.1. Data Processing
To test simulations built, it has been selected earthquake and tsunami evac-uation route at T. Nyak Arief streets from Mesra intersection towards traffic roundabout of Rukoh as shown by the Figure 1.
This study used two kinds of data, primary data and secondary data. Primary data were obtained through direct vehicle survey at the streets of Mesra intersection towards bridge of Lamnyong. So, the speed and density of vehicles data on the road can be gained. Secondary data were used to get the number of motorcycles and cars in the surrounding T. Nyak Arief streets. This data was obtained from the office of Pengelolaan Kekayaan Aceh (DPKA) in the form of data on the number of vehicles, motorcycles and cars, in Syiah Kuala District.
Figure1. Simulation testing location map
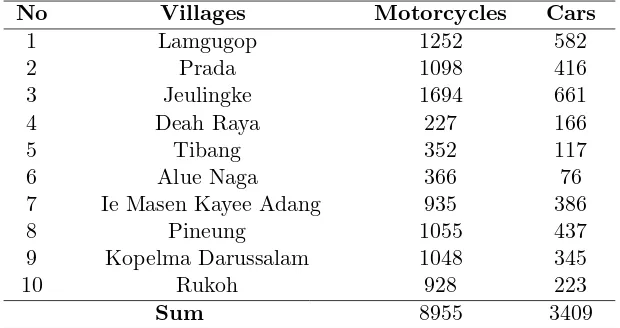
Secondary data will be used to determine the maximum number of vehicles which will enter the streets of Mesra intersection, Prada, Lamgugob, Tibang, and Alue Naga. Secondary data were shown as in Table 1.
Table 1: Data on the number of vehicles at Syiah Kuala District
No Villages Motorcycles Cars
1 Lamgugop 1252 582
2 Prada 1098 416
3 Jeulingke 1694 661
4 Deah Raya 227 166
5 Tibang 352 117
6 Alue Naga 366 76
7 Ie Masen Kayee Adang 935 386
8 Pineung 1055 437
9 Kopelma Darussalam 1048 345
10 Rukoh 928 223
Sum 8955 3409
Source : UPT. Pendapatan Daerah Wilayah
for each ten (10) seconds obtained from the survey results is multiplied by a factor of equivalence smp for each vehicle types. Equivalent factor derived from the Indonesian Highway Capacity Manual which is presented in Table 2.
Table 2: Equivalent factor passenger car unit (smp)
No Kind of Vehicles Smp
1 Light Vehicles 1.00
2 Heavy Vehicles 1.20
3 Motorcycles 0.25
4 Non-Motorized Vehicles 0.80 Source : MKJI, 1997
3.2. Traffic Flow Model
1. Initial conditions:
Initial conditions and boundary conditions are shown as follows:
(a) It is assumed that the disaster occurs at night so the vehicle density in any point at time of (t= 0) is zero, stated as follows:
ρ(0, x) = 0, 0< x <road length (meters)
(b) It is assumed that the disaster occurs at the busy time (working time) so that the vehicle density in any point at time of (t= 0) is expressed as follows:
ρ(0, x) =ρ0, 0< x <road length (meters)
2. Boundary conditions:
The boundary conditions in this study were assumed as the change in vehicle density towards the time in any point of inflow from the starting point to the end point of the evacuation route. The equation is as follows :
∂ρ
∂t(xi, t) =Ki, t0≤t≤T
with:
xi : Length of inflow to-i from initial point
Ki : The number of vehicles entering inflow to-i
i : 1,2, . . . the number of inflow
Time of t0 for each point boundary value is varied. This value is dependent on the mileage of the vehicle to the boundary point. The value of K is a constant value of the vehicle onto the road (in flow). In this study, the constant value is 0.25 smp for the motorcycles and 1 smp for the cars. From the explanation, traffic flow model, initial conditions and boundary conditions for the traffic problem has been constructed.
3.3. Finite Difference Method
This section will explain about the numerical scheme of finite differ-ence method from the problems of traffic flow models described above. To develop a numerical scheme, initially performed discretization of positionx
and timet.
At the time of partial derivatives ∂ρ∂t used advance difference formula and at the partial derivatives position of ∂x∂ρ used backward difference for-mula. Thus obtained the following models :
1. For the motorcycles
After discretization model of traffic flow, then boundaries condition of the model should be discretized by using advance difference formula, as follows :
ρi,j+1(xp, t) =△tKp+ρi,j
with:
xp : Length of inflow to-pfrom initial point
Ki : The number of vehicles entering inflow to-p
p : 1,2, . . . The number of inflow
3.4. Evacuation Efficiency
Evacuation efficiency is the measure used to assess the merits of the evacuation process. Model of traffic flow disaster evacuation route is considered good if the level of its efficiency evacuation is high. The shorter congestion caused by the evacuation process, the more efficient evacuation process is. To calculate the efficiency level of the evacuation process, it can be used the following equation:
with :
T E : Level of Efficiency
T I : Level of Inefficiency
n : Simulation Time
3.5. Numerical Simulation
From the models described above, the computer program will be de-veloped by using Graphical User Interfaces (GUI) to implement a numerical scheme in order to know the characteristics of the traffic flow on the road that will be used as an evacuation route of the earthquake and tsunami. The parameters used in this traffic flow simulation are a number of vehicles and t0 time of society’s vehicles, The time is depended on vehicle mileage towards the boundary point of simulation. Simulation built is a flexible simulation where road characteristics become the input. So the simulation can be applied for all roads that will be used as an evacuation route of the earthquake and tsunami in Banda Aceh.
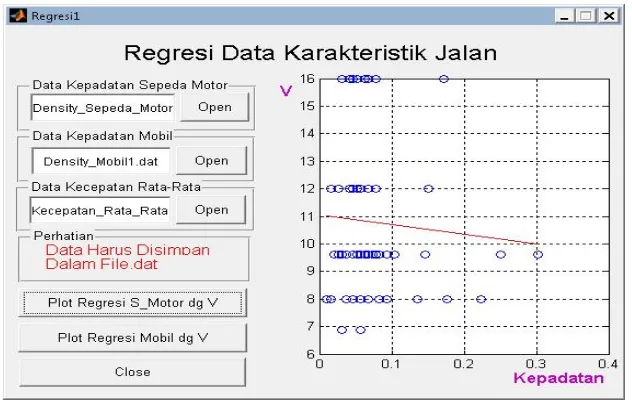
Once the data density and average vehicle speed are input then the data is regressed to get the regression coefficients of a0, a1, b0 and b1 . On application built regression process is performed using regression Form Characteristic Data Path as shown in Figure 2.
Figure 2. Form regression process of the vehicle data density and speed
com-pleted, then the value of △x and △t are determined. After that, stability testing simulations are done by using Stability Simulation Test Form as shown in Figure 3.
Gambar3. Form to determine△x and △tand stability simulations test
The simulation process is then performed using One-Way Traffic Flow Simulation Form as shown in Figure 4.
In this section will be presented some cases.
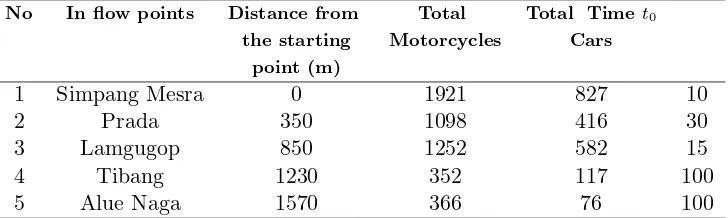
Cases 1. In this case, the initial conditions at the timet0 are zero and the number of society’s vehicles which the data have been obtained from the DPKA office. The timet0The time oft0on the society’s vehicles for this first case was obtained from applications on the website www.maps.google.com. The inflow of the vehicles choose are 5 (five) points, there are initial point (Mesra Intersection), vehicles entering at point of Mesra Intersection is as-sumed to come from the area of Jeulingke and Deyah Raya, then the points of Prada, Lamgugob, Tibang and Alue Naga. The inflow data can be seen at Table 3.
Figure 4. Form for the simulation of one-way traffic flow
route became more than ever and Alue Nagax= 1570 for motorcycle began to decrease, while for the number of cars more dense than before.
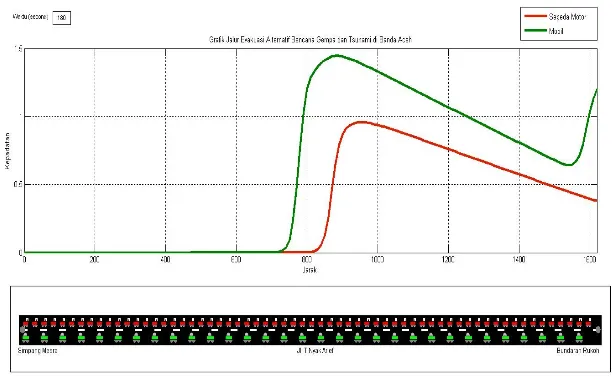
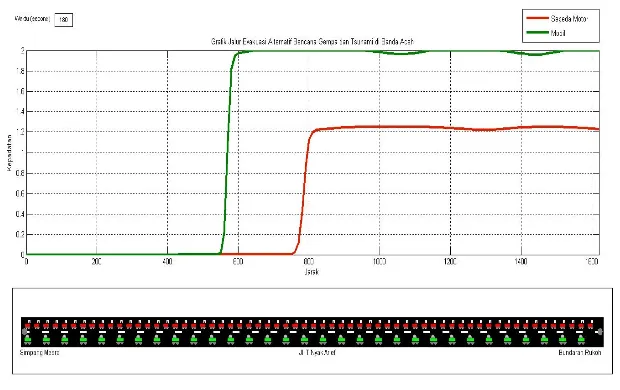
Cases 2. In this case, the initial condition is chosen equal to half of the maximum density of the road. Inflow vehicles are the same as the first case andt0time society’s vehicles for the third case was obtained from appli-cations on the website www.maps.google.com. This case will be simulated for about 180 seconds with △t= 0.1 second and the road length x= 1.617 617 meters with △x = 10 meters. Figure 6. Shows the results of numeri-cal simulations for the second case which is simulated for t = 180 seconds
t= 180 seconds. It can be seen in the simulation results that a number of vehicles on the congested occur at the boundaries from Lamgugop to Alue Naga. This is caused by there are a number of people’s vehicles on the evac-uation route (initial conditions). At the boundary of Mesra Intersection and Prada, vehicles of the society have been depleted.
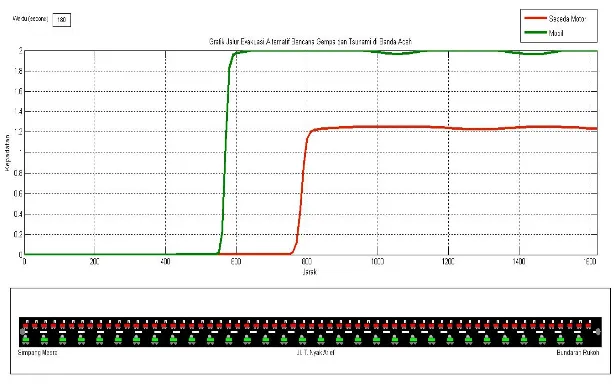
Cases 3. In this case, the initial condition is chosen equal to the maximum density of the road. Inflow vehicles are the same as the first case and t0 time society’s vehicles for the forth case was obtained from applica-tions on the website www.maps.google.com. This case will be simulated for about 180 seconds with△t= 0.1 second and the road lengthx= 1.617 with
Table 3: Data in flow for the first case of simulation
No In flow points Distance from Total Total Time t0 the starting Motorcycles Cars
point (m)
1 Simpang Mesra 0 1921 827 10
2 Prada 350 1098 416 30
3 Lamgugop 850 1252 582 15
4 Tibang 1230 352 117 100
5 Alue Naga 1570 366 76 100
simulation results that a number of vehicles on the congested occur from the boundaries of Lamgugop to Alue Naga. This is caused by there are a number of people’s vehicles on the evacuation route (initial conditions). At the boundary of Mesra Intersection and Prada, vehicles of the society have been depleted.
.
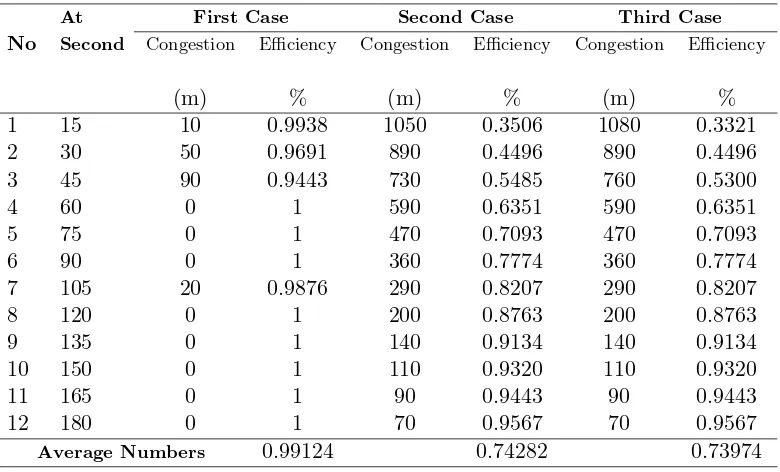
Table 4 shows the level of efficiency of the evacuation process for the third cases with simulation time t = 180 seconds. The average level of efficiency for the first case is about 0.99124% and it can be concluded that the evacuation process is very efficient because it does not cause congestion. The average level of efficiency for the second and the third cases are about 0.74284% and 0.73974%. It can be concluded that the evacuation process is still efficient because it only cause congestion along 70 meters. This is because there are vehicles already in the path of the evacuation at the time of the evacuation began.
4. CONCLUSION
Figure 5. Numerical simulation of the first case at the timet= 180 seconds
Figure 6. Numerical simulation of the second case at the timet= 180 seconds
REFERENCES
1. Sudrajat, Sumartono, T., Asropi. 2007. Model Jalan Lalulintas Jalan Tol Dalam Persamaan Diferensial Parsial. Bandung : Universitas Padjad-jaran.
2. Poli JrJ and Monteiro LHA. 2005. Improving Vehicle Flow with Traffic Lights. Advances in Complex Systems. Vol: 08, pp: 59-63.
3. Ni, Daiheng. 2011. Multisacle Modelling of Traffic Flow. Mathematica Aeterna, vol. l, no. 01, 27-54
4. Kabir, M.H., Gani, M.O. and Andallah, L.S. 2010. Numerical Simulation of a Mathematical Traffic Flow Model Based on a Nonlinear Velocity-Density Function. Journal of Bangladesh Academy of Sciences, Vol. 34, No. l, pp. 15- 22.
5. Nahid S., Parvin, M., Sarker, R. and Andallah, L.S. 2013. Simulation of Traffic flow with Traffic Controller Boundary. International Journal of Science and Engineering (IJSE). Vol 5.
Figure 7. Numerical simulation of the third case at the time = 180 seconds
7. Chao Yang, Prescott, R.R., and Andrews, J. 2013. A Network Traffic Flow Model for Motorway and Urban Highways. Journal of The Opera-tional Research Society. pp: 1-14.
8. Dash, N. and Gladwin, H. 2007. Evacuation Decision Making and Be-havioral Responses: Individual and Household. Natural Hazards Review, Vol. 8, No. 3, pp. 69-77.
9. Lindell, M.K. and Prater, C.S. 2007. Critical Behavioral Assumptions in Evacuation Time Estimate Analysis for Private Vehicles: Examples from Hurricane Research and Planning. Journal of Urban Planning andDevel-opment, Vol. 133, No. 1, pp. 18-29.
10. Kimms, A. and Maassen, K.C. 2011. Optimization and Simulation of Traffic Flows in the Case of Evacuating Urban Areas. Springer. Vol. 33, pp: 571-593.
11. Kaisar, E. and Parr, S. 2012. Traffic Simulation Modeling for an Urban Chemical Disaster: Emergency Evacuation Development and Case Study. Latin American And Caribbean Journal Of Engineering Education, Vol. 6(1), pp: 1-8.
Table 4: Data rate of efficiency
At First Case Second Case Third Case No Second Congestion Efficiency Congestion Efficiency Congestion Efficiency
(m) % (m) % (m) %
1 15 10 0.9938 1050 0.3506 1080 0.3321
2 30 50 0.9691 890 0.4496 890 0.4496
3 45 90 0.9443 730 0.5485 760 0.5300
4 60 0 1 590 0.6351 590 0.6351
5 75 0 1 470 0.7093 470 0.7093
6 90 0 1 360 0.7774 360 0.7774
7 105 20 0.9876 290 0.8207 290 0.8207
8 120 0 1 200 0.8763 200 0.8763
9 135 0 1 140 0.9134 140 0.9134
10 150 0 1 110 0.9320 110 0.9320
11 165 0 1 90 0.9443 90 0.9443
12 180 0 1 70 0.9567 70 0.9567
Average Numbers 0.99124 0.74282 0.73974
Junaidi: Program Studi Magister Matematika Universitas Syiah Kuala, Banda Aceh
E-mail: Junaidi [email protected]
Said Munzir: Program Studi Matematika Universitas Syiah Kuala, Banda Aceh