THE JOURNAL OF TROPICAL LIFE SCIENCE OPEN ACCESS Freely available online
VOL. 6, NO. 3, pp. 184 - 189, September 2016 Submitted October 2015; Revised August 2016; Accepted September 2016
Evaluation of Pulasan (Nephelium ramboutan-ake) Genetic Diversity in Bogor, West Java, Using
Microsatellite Markers
Amelia Luisyane Puhili, Tatik Chikmawati*, Nina Ratna Djuita
Department of Biology, Faculty of Mathematics and Natural Sciences, Bogor Agricultural University, Bogor, Indonesia
ABSTRACT
Pulasan (Nephelium ramboutan-ake (Labill.) Leenh) fruit is highly similar to rambutan rapiah (Nephelium lap-paceum) fruit with ovate shape, sweet and sour fresh taste, but it has a thick rind. The diversity of pulasan is little informed including in Bogor. The objective of this study was to analyze the genetic diversity of pulasan from Bo-gor revealed by microsatellite marker. The DNA of 63 individuals from 10 populations of pulasan were extracted using CTAB method and amplified using two primer sets, LMLY6 (GA)9(CA)2(GA)4 dan LMLY12 (CT)11. DNA amplification product was visualized and arranged in a matrix of binary data then analyzed the value of the number of different alleles (Na), the number of effective alleles (Ne), Shannon information index (I), heterozygosity (He), and the percentage of polymorphism (PLP). The results of the analysis showed the highest genetic diver -sity was found in North Bogor (He=0.313). The genetic diver-sity within a population (61%) was higher than that among populations (39%). A dendrogram was constructed using the Unweighted Pair Group Method with arith-metic Mean (UPGMA). The similarity index ranged from 52 to 100% that means there are close relationships among individuals. Cluster analyses grouped some individuals originated from different locations in the same group. The levels of heterozygosity within a population was determined by the history of each individual in a pop-ulation.
Keywords: Bogor, genetic diversity, Nephelium ramboutan-ake, microsatellite
In Java, pulasan is known as rambutan babat, rambutan ake, and rambutan leci. The plant has leaves and branches that similar to those of rambutan, but it has a smaller size. pulasan fruit is like rambutan, ovate shape with a sweet taste and a slightly sour, but it has a thick rind and with no hairs. Pulasan has many uses. It has quite a hard stem, so it is often used for making household appliances. The seeds contain vegetable oils that can be used to make candles and soaps [1]. In ad-dition, the seeds can be eaten after baked, and the taste likes beans. The baked seeds can be made into a pow-der and used it like cocoa powpow-der. Pulasan fruit can be eaten directly like rambutan or as an additional ingre-dient in ice cream, pudding, jam, syrup and mixed in drinks such as cocktails [2].
Pulasan is a native species of Java, Borneo, and the
Philippines [3]. Unfortunately, it is now hard to find in Java Island since people’s interest to grow pulasan tree decreases due to its low production. Pulasan given its many benefits, and has huge potential for its develop-ment as an alternative fruit in the future, however, its diversity in Java island, especially in Bogor, has not been identified. Therefore, it is important to evaluate its genetic diversity.
Microsatellite marker can be used to describe the genetic diversity of pulasan. This marker is often used to describe the diversity of organisms at the species level because its existence is abundant, it produces high polymorphisms, and co-dominant marker [4]. Mi-crosatellite markers had been successfully used to de-scribe the genetic diversity at the species level, for ex-ample in rice [5], sorghum [6], and apple [7]. This study aimed to analyze the genetic diversity of pulasan INTRODUCTION
*Corresponding author: Tatik Chikmawati
Department of Biology, Faculty of Mathematics and Natural Sciences, Bogor Agricultural University
Jalan Raya Darmaga, Bogor 16680, Indonesia E-mail: [email protected]
How to cite:
in Bogor, West Java, using microsatellite markers.
Sampling
pulasan leaves were taken from four districts in Bo-gor Municipality (West BoBo-gor Barat, North BoBo-gor, South Bogor and Central Bogor) and six districts in Bogor Regency (Cileungsi, Sukaraja, Babakan Madang, Ciomas, Parung, and Cibinong). Total samples of the plant taken are 63 trees. From each tree, as many as four to five mature leaves were taken. The leaves were put into plastic bags, added with silica gel, covered, and stored in a -20ºC temperature.
DNA isolation, Polymerase Chain Reaction (PCR) and visualization of PCR results
Isolation of DNA used the CTAB method [8] with some modifications. PCR amplification method was based on the method conducted by Sim et al. [9] using two pairs of primers, namely LMLY 6 and LMLY 12 (Table 1).
Amplification process was carried out in 25 µL mix solution contained 12.5 µL of Go Taq Green master mix, 1 µL each of primer forward and reverse, 0.25 µL BSA, 2 µL of DNA, and 8.25 µL ddH2O. This process was performed for 35 cycles consisting of several stages: initial denaturation at a temperature of 94ºC for 35 seconds, denaturation at 94ºC for minute, annealing at 46ºC for the LMLY6 primer and 46.3ºC for LMLY12 for 35 seconds, and elongation at a tempera-ture of 72ºC for 10 minutes. Amplification results were then examined using horizontal electrophoresis and used 2.5% of agarose gel for 100 minutes. Results of electrophoresis were visualized using UV light and then photographed.
Data analysis
The resulted visualization of PCR was observed by looking at the presence or absence of band considered microsatellite alleles on pulasan accession. When there was a band, then a score of one was given, and when there was none, a score of zero was given. The resulted scores were arranged in a matrix of binary data and then analyzed using the software GenAlex to generate the value of the number of different alleles (Na), the number of effective alleles (Ne), Shannon information
index (I), heterozygosity (He), the percentage of polymorphism (PLP) and the analysis of molecular variation (AMOVA). The sample from the Parung District was not analyzed because only one sample was found. Polymorphism percentage value is calculated coefficient and Unweighted Pair Group Method with Arithmatic Mean (UPGMA), it performed using the software NTSYS-pc ver 2.1 [10].
Pulasan exploration
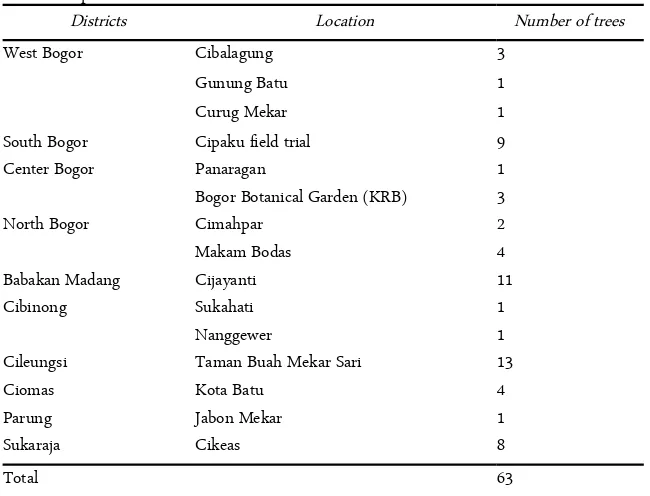
Based on the resulted exploration in Bogor Regency and Municipality, the study found pulasan plants in ten districts (Table 2). pulasan trees found on all loca-tions are 63 trees in number. The district with the highest number of trees is Cileungsi with as many as 13. The district with the least number of trees is Parung. The number of locations where pulasan trees found varies with each district.
Pulasan DNA amplification
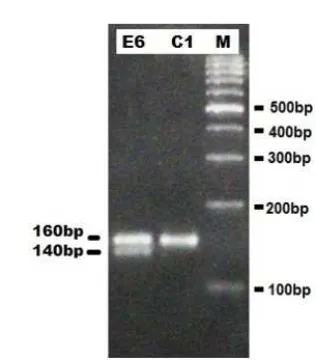
All pulasan plants of Bogor have successfully been amplified using LMLY6 and LMLY12. LMLY6 Primer generated PCR products in the form of two DNA bands of 140 bp and 160 bp (Figure 1). The bands with the size of 160 bp were amplified in all plants, while the size of 140 bp only amplified in some plants. Thus, the 140 bp band shows variations in LMLY6 primer. Unlike LMLY6 primer, LMLY12 produced PCR prod-ucts with 2 - 7 DNA bands per individual pulasan (Fig-ure 2). The band sizes generated by LMLY12 were of 150 bp, 200 bp, 225 bp, 250 bp, 400 bp, 450 bp and 500 bp. Among the resulted PCR of LMLY12, two bands tend to be amplified in each plant, namely the sizes of 225 bp and 450 bp. While the other bands pro-duced using LMLY12, show variation among indi-RESULTS AND DISCUSSION
Table 1. List of microsatellite primer name and sequences used in the study
Figure 1. DNA amplification of pulasan genome in several dis-tricts in Bogor using LMLY6 primer and an anneal-ing temperature of 46.3ºC on agarose gel of 2.5%. (M: DNA Marker 1000 bp; E: North Bogor; C: Ciomas.)
Figure 2. Variations in DNA amplification results of pulasan genome in several districts in Bogor using LMLY12 primer and an annealing temperature of 46ºC on agarose gel of 2.5%. (M: DNA Marker 1000 bp; A: Cileungsi; D: Sukaraja; E: North Bogor; F: Babakan Madang; G: West Bogor; H: Central Bogor. I: Cibi-nong)
vidual pulasan tree. Thus, the higher level of polymor-phism is generated by the LMLY12 primer.
Genetic diversity of pulasan
The analysis of genetic diversity on two microsatel-lite primers showed that pulasan in the District of North Bogor has the highest values of heterozygosity (He = 0313), Shannon information index (I = 0458), and percentage of polymorphism (77.78%) (Table 3). The lowest values of heterozygosity, Shannon informa-tion index and the percentage of polymorphism were found in Ciomas District. Cileungsi District is the dis-trict with the highest number of pulasan trees (13
trees). However, the genetic diversity value in the Dis-trict is low (He = 0102, I = 0175, and PLP = 55.56). This value is lower than those of heterozygosity and polymorphism percentage in North Bogor District where only six trees are found. pulasan in Babakan Madang District is also the same as that of Cileungsi District, with a large population size but it has low ge-netic diversity. In contrast to those locations, pulasan found in Central Bogor and Cibinong districts are less than five trees, but they have high values of heterozy-gosity and polymorphism. pulasan is also found less than five trees in Ciomas, but the values of heterozy-gosity (He = 0.026) and polymorphism percentage (11 : 11%) of pulasan in Ciomas District are lower than those of Central Bogor District and Cibinong.
The average percentage of polymorphism of Bogor pulasan is 44.44%. A locus is categorized as polymor-phic if the frequency of an allele is <99% [11]. Thus, all loci generated by Bogor pulasan is polymorph. Eval-uation of the genetic diversity using microsatellite markers on annual plant been made. An observation of genetic diversity of apples coming from the Swiss Fed-eral Research Staton, Switzerland and Philip Forsline at The National germplasm repository for Apple and Grape, USA, showed that the average of heterozygosity value was 0.78, which is categorized as very high [7]. In contrast to the observation on apples, the genetic di-versity of woody plants in tropical forests was lower, He=0.149 [12]. Comparing to the previous studies, the average value of pulasan heterozygosity is quite high, He=0.161.
in addition to the population size, two other possibili-ties are affecting the genetic diversity level of pulasan, the origin of the individuals making up the population and the multiplication through vegetative reproduction. According to the previous study, other factors may af-fect the value of heterozygosity within a population,
such as mutation, reproductive and recombinant traits, random mating, and natural selection [15].
AMOVA results show that the variation in the pop-ulation (61%) is higher than the variation between populations (39%) (Table 3). Variations in large popu-lations can occur as a result of interbreeding (Hamrick
Table 2. Exploration locations and the number of trees found
Districts Location Number of trees
West Bogor
South Bogor
Cibalagung Gunung Batu Curug Mekar Cipaku field trial
3 1 1 9
Center Bogor Panaragan 1
Bogor Botanical Garden (KRB) 3
North Bogor Cimahpar 2
Makam Bodas 4
Babakan Madang Cijayanti 11
Cibinong Sukahati 1
Nanggewer 1
Cileungsi Taman Buah Mekar Sari 13
Ciomas Kota Batu 4
Parung Jabon Mekar 1
Sukaraja Cikeas 8
Total 63
Table 3. Genetic Diversity of pulasan in ten districts in Bogor
Populations N Na Ne I He PLP
West Bogor 5 1.444 1.387 0.319 0.218 55.56%
South Bogor 9 0.889 1.118 0.111 0.073 22.22%
Center Bogor 4 1.222 1.368 0.309 0.209 55.56%
North Bogor 6 1.778 1.541 0.458 0.313 77.78%
Babakan Mandang 11 1.333 1.334 0.260 0.180 44.44%
Cibinong 2 1.556 1.393 0.336 0.230 55.56%
Cileungsi 13 1.333 1.142 0.175 0.102 55.56%
Ciomas 4 0.778 1.034 0.044 0.026 11.11%
Sukaraja 8 0.778 1.179 0.141 0.099 22.22%
Average 6.889 1.235 1.277 0.239 0.161 44.44%
Note: N = number of samples; Na = number of different alleles; Ne = number of effective alleles; I = index of Shannon information; He = het-erozygosity; PLP = percentage of polymorphisms
Table 4. Analysis of molecular variation (AMOVA) of pulasan populations
df SS MS Est. Var. %
Among populations 8 33.256 4.157 0.503 39%
Within populations 53 42.486 0.802 0.802 61%
Total 61 75.742 1.304 100%
1989). In addition, a broader distribution of plants, a large size, and an adjacent location of populations will produce considerable variation in the population be-cause it will facilitate the occurrence of gene flow [16].
Pulasan relationship
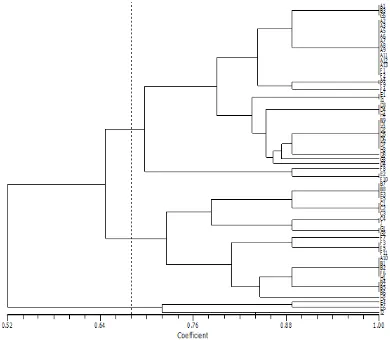
The degree of similarity in the 63 samples of pu-lasan varies from 0.52 to 1.00. In the similarity level of 68%, all of the samples split and form into three main groups. The first group is pulasan of the Districts: Cib-inong, Babakan Madang, Ciomas, and North Bogor. The second group is pulasan of the Districts: Ciomas, South Bogor, North Bogor, Parung, West Bogor, Babakan Madang, Cileungsi, and Central Bogor. The third group is pulasan of the Districts: Cileungsi, Babakan Madang, North Bogor, West Bogor, South Bogor, Cibinong, Sukaraja, and Central Bogor.
The results of cluster analysis (Figure 3) shows that individual pulasan do not cluster based on the origin of the population but they are scattered randomly, except
for the population of Sukaraja District. pulasan from this district is identical, with the similarity level of 100%. The same individual trees occur since all pu-lasan of Sukaraja comes from trees grafted from the oldest tree in the area. pulasan B3 from the Experimen-tal Garden of Cipaku is grouped together with pulasan of Cileungsi District, indicating that it is the progeni-tor of pulasan in Taman Buah Mekar Sari, Cileungsi.
Pulasan Individual from Bogor Botanical Gardens (KRB) and Cibinong District are grouped into popula-tions from different locapopula-tions. This result can be ex-plained since KRB is a garden of plant collection that gathers all plants from different places. Pulasan indi-viduals of Cibinong is also found from various and dis-tant locations.
As many as 63 pulasan trees were found in ten Dis-tricts and Municipality of Bogor. All pulasan trees have been successfully amplified using the primers LMLY6 CONCLUSION
and LMLY12 with the annealing temperature of 46.3ºC and 46ºC respectively. Primer LMLY6 produces two bands of 140 bp and 160 bp, while, Primer LMLY12 produced seven sizes of DNA bands, 150 bp, 200 bp, 225 bp, 250 bp, 400 bp, 450 bp and 500 bp. The high-est genetic variation of pulasan population is found in North Bogor (He = 0.313). The percentage of variation within a population (61%) is higher than between pop-ulations, 39%. The level of genetic similarity between pulasan trees ranged 52 - 100%, which means that the relationship among pulasan individuals is quite close. The origins of the individuals that make up the popu-lation determine the level of the popupopu-lation heterozy-gosity.
We gratefully acknowledge Indonesian Directorate General of Higher Education (DIKTI) for providing financial support through the research project of Penelitian Unggulan Perguruan Tinggi, on behalf of Dr. Tatik Chikmawati, M.Si. in 2014-2015.
1. [BK-Kehati] Balai Kliring Keanekaragaman Hayati In-donesia (2013) Tenggaring. [Internet]. [diunduh pada 24 November 2013]. Tersedia pada: http://www.bk.menlh.-go.id/.
2. Lim TK (2013) Edible Medicinal and Non Medicinal Plants: Volume 6, Fruits. Canberra (AU): Springer Netherlands.
3. Leenhouts P W (1986) A taxonomic revision of Nephelium (Sapindaceae). Blumea 31, 373-436.
4. McCouch SR, Teytelman L, Xu Y et al. (2002) Develop-ment and mapping of 2240 new SSR markers for rice (Oryza sativa L.) DNA Res. 9:199–207.
5. Brondani C, Hideo P, Rangel N, Borba TCO, Brondani RPV (2003) Transferability of microsatellite and ISSR markers in Oryza species. Hereditas 138:187–192. 6. Gianfranceschi L, Seglias N, Tarchini R, Komjanc M,
Gessler C (1998) Simple sequence repeats for the genetic analysis of apple. Theor Appl Genet. 96: 1069-1076. 7. Doyle JJ, Doyle JL (1990) Isolation of plant DNA from
fresh tissue. Focus.12: 13-15.
8. Sim CC, Mahani MC, Choong YC, Salma I (2005) Trans-ferability of SSR markers from lychee (Litchi chinensis Sonn.) to pulasan (Nephelium ramboutan-ake L.) Fruits. 60:379-384.
9. Peakall R, Smouse PE (2012) GenAlEx 6.5: genetic analy-sis in Excel. Population genetic software for teaching and research. Bioinformatics 28: 2537-2539.
10. Rohlf FJ (2000) NTSYS pc Numerical Taxonomy and Multivariate Analysis System Version 2.1. New York (US): Applied Biostatistic Inc.
11. Li WH, Graur D (1991) Fundamentals of Molecular Evo-lution. Massachusetts (US): Sinaur Associates Inc. 12. Hamrick JL, Godt MJW, and Sherman-Broyles SL (1992)
Factors influencing levels of genetic diversity in woody plantspecies. New For. 6: 95–124.
13. Ferguson A (1980) Biochemical Systematics and Evolu-tion. London (GB): The Queens University of Belfast. 14. Nei M (1987) Molecular Evolutionary Genetics. New
York (US): Columbia Press.
15. Pai AC (1992) Dasar-Dasar Genetika. Jakarta (ID): Pener-bit Erlangga.
16. Hartati D, Rimbawanto A, Taryono, Sulistyaningsih E, Widyatmoko AYPBC (2007) Pendugaan keragaman genetik di dalam dan antar provenan pulai (Alstonia scholaris (L) R. Br.) menggunakan penanda RAPD. Jurnal Pemuliaan Tanaman Hutan 2: 98-98.
ACKNOWLEDGMENT