GGE BIPLOT ANALYSIS FOR GENOTYPE X ENVIRONMENT INTERACTION ON YIELD
TRAIT OF HIGH FE CONTENT RICE GENOTYPES IN INDONESIAN IRRIGATED
ENVIRONMENTS
Untung Susanto 1*), Wage R. Rohaeni 1), Sarah B Johnson 2) and Ali Jamil 1) 1)
Indonesian Center for Rice Research, Indonesian Agency for Agricultural Research and Development Street 9th Sukamandi, Subang, West Java, Indonesia, 41256
2)
International Rice Research Institute, Los Banos-Phillipines *) Corresoponding author: E-mail: [email protected]
Received: August 28, 2015/ Accepted: September 23, 2015
ABSTRACT environment inter-action (GEI) on yield of 21 high Fe content rice genotypes under 5 irrigated field environments. The research was conducted at DS 2011 in 2 locations and DS 2012 in 3 locations following randomized complete block design with three replications in each location. Combined ana-lysis of variance showed genotype x environment inter-action at 1% probability level, where G and GEI captured totally 88.8% of total variability. There were two Mega-environments constructed, i.e. Mega-E1 that contained environments of trials in dry season 2011 (E4 and E5) with the winner of G12 (BP9474C-1-1-B) and Mega-E2 that con-tained environments of trials in dry season 2012 (E1, E2, and E3) with the winner of G3 (A69-1). E1 (Subang, DS 2012), E2 (Karawang, DS 2012), and E3 (Indramaru, DS 2012) had good discrimina-tiveness and representasiveness for yield trait of high Fe content rice lines. Mean performance and stability of genotypes indicated that G3 (A69-1; average 6.72 t ha-1) was highly stable with high yield.
Keywords:GGE analysis; GEI; stability; paddy INTRODUCTION
Micronutrient malnutrition is recognized as a massive and rapidly growing public health issue especially among poor people living on an unba-lanced diet dominated by a single staple grain such as rice. It was reported that the prevalence of Fe deficiency anemia was estimated to be
55.1% in children under five, 31% in schooling age children, 63.5% in pregnant women, and 35% in manual laborer (Directorate of Public Nu-trition, 1993). The problem for women and chil-dren is more severe because of their physiological need. Fe deficiency during child-hood and adolescence impairs physical growth, mental development and learning capacity.
Breeding staples such as rice with high
micronutrient content dubbed as ‘biofortification’
provides a cost effective and sustainable solution to combat malnutrition (Bouis, 2004). Breeding for functional rice had been done in IRRI and ICRR. IRRI had develop high Fe and Zn content rice (Gregorio et al., 2000; Gregorio, 2004). Those lines is predicted to be adapted for Indonesian agro-ecosystem condition and could be then widely planted by farmers.
Yield is a quantitative traits that is strongly affected by environment (Hadi and Sa’diyah, 2004; Rasyad and Anhar, 2007; Widyastuti et al., 2013). GxE study on yield trait of the high Fe and Zn rice lines would give information about the yield and stability, so that it could be selected the best geno-types with high yield and stable accross envi-ronment. Some parameters could be used to study the stability, such as regression slope (bi), equiv-alency (Wi2), coefficient of determination (Ri2) and Si2. Those techniques has been widely used for to evaluate representation of an environment, genotype stability, and the effect of GxE to the performance of a genotype (Yan, 2001; Asfaw et Accredited SK No.: 81/DIKTI/Kep/2011
al., 2009; Jambormias, 2011; Karimizadeh et al., 2013). GGE biplot analysis provides an easy and comprehensive solution to genotype by environ-ment data analysis, which has been a challenge to plant breeders, geneticists, and agronomists. Data does not only address short-term, applied ques-tions but also provides insights on long-term, basic problems (Yan and Tinker,2006). GGE biplot ana-lysis is a statistical method which used multivariate approach in the analysis. It is better than univariate approach in dissecting GxE components into spe-cific interaction between genotype and envi-ronmental components (Flores et al., 1998). GGE could explain the source of variation of G ( geno-type) and GE (genotype x environment) more detail compared to AMMI ana-lysis (Yan et al., 2007). GGE biplot had some graphical visual-ization function such as visualvisual-ization of genotypes performance in a specific environment, visual-ization of relative adaptability of a genotype into various environment, visualization of comparison of two genotypes in different environment, visual-ization of identifying the best genotypes in every environment condition, visualization of environ-mental group for a specific genotpe(s), visual-ization of genotype average performance and stability, and visualization of disccrimination and representation of environment (Yan and Hunt, 2002). GGE biplot is able to show the best geno-type with the highest yield in a quadran containing identical locations (Mega-E), genotype average performance and stability, ideal genotype and ideal location to increase yield, and specific location (Jambormias and Riry, 2008; Fashadfar et al., 2013; Fashadfar and Sadegi, 2014).
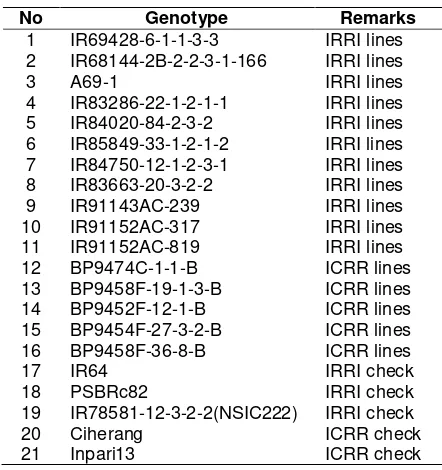
This research is aimed to know which high IRRI check varieties, and 2 ICRR check varieties (Table 1).
Table 1. High Fe content rice lines for GGE study, Indonesia, DS 2011-2012
No Genotype Remarks
1 IR69428-6-1-1-3-3 IRRI lines 2 IR68144-2B-2-2-3-1-166 IRRI lines
3 A69-1 IRRI lines
4 IR83286-22-1-2-1-1 IRRI lines 5 IR84020-84-2-3-2 IRRI lines 6 IR85849-33-1-2-1-2 IRRI lines 7 IR84750-12-1-2-3-1 IRRI lines 8 IR83663-20-3-2-2 IRRI lines 9 IR91143AC-239 IRRI lines 10 IR91152AC-317 IRRI lines 11 IR91152AC-819 IRRI lines 12 BP9474C-1-1-B ICRR lines 13 BP9458F-19-1-3-B ICRR lines 14 BP9452F-12-1-B ICRR lines 15 BP9454F-27-3-2-B ICRR lines 16 BP9458F-36-8-B ICRR lines
17 IR64 IRRI check
18 PSBRc82 IRRI check 19 IR78581-12-3-2-2(NSIC222) IRRI check 20 Ciherang ICRR check 21 Inpari13 ICRR check
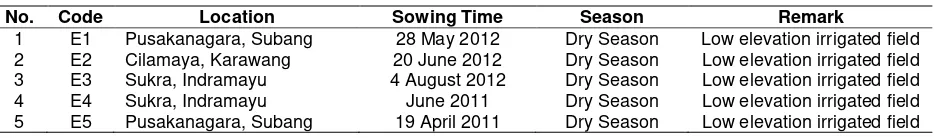
Table 2. Location and year of the trials for high Fe content rice lines in Indonesia
No. Code Location Sowing Time Season Remark
1 E1 Pusakanagara, Subang 28 May 2012 Dry Season Low elevation irrigated field 2 E2 Cilamaya, Karawang 20 June 2012 Dry Season Low elevation irrigated field 3 E3 Sukra, Indramayu 4 August 2012 Dry Season Low elevation irrigated field 4 E4 Sukra, Indramayu June 2011 Dry Season Low elevation irrigated field 5 E5 Pusakanagara, Subang 19 April 2011 Dry Season Low elevation irrigated field
Analysis of variance for yield trait was conducted by STAR ver 2.0.1. software, while to determine yield level, stability, environmental representation, the effect of environment (E), genotype (G), and genotype by environment interaction (GEI) by PBTools Ver 1.4.
Combine variance analysis was conducted into yield data of the five locations following the mathematical model as follows (Sumertajaya, 2007):
Yij = μ + Gi + Lj + GLij + εij Remarks:
Yij = yield of genotype i in location j
Μ = general mean Gi = effect of genotype-i Lj = effect of location-j
GLij = effect of interaction of genotype-i in location-j
εij = error
The two biggest effect principle components we used to a biplot by GGE biplot analysis. The basic model for a GGT biplot is:
Where = the mean yield of genotype i
(=1,2,….,n) in environment j(=1,2,…m), μ = the
grand mean, = the main effect of environment j, (μ + ) being the mean yield of environment, = the singular value (SV) of lth principal component (PC), the square of which is the sum
of squares explained by PCl=(l=1,2,….,k with k<
min (m,n) and k=2 for a two- dimensional biplot), = the eigenvector of genotype i for PCl, = the eigenvector of environment j for PCL, = the residual associated with genotype I in environment j.
To integrated a biplot that can be used in visual analysis of MET data, the SVs had to be partitioned into the genotype and environment eigenvenctor so that the model (1) could be
written in the form of
where and were called PCl score for genotype i and environment j, respectively. In a biplot, genotype i is displayed as a point defined by all values, and environment j is displayed as a point defined by all values (l=1 and 2 for a two-dimensional biplot) (Farshadfar et al., 2013).
RESULTS AND DISCUSSION
Combine Variance Analysis
Table 3. Combine variance analysis of yield trait of high Fe content rice in 5 sites
Source of variation
Degree of freedom
(DF)
Sum of square (SS) Mean square (MS) F value Probability
Location 4 1033.16 258.290** 354.02 0.0001
Replication (location) 10 55.53 5.553** 7.61 0.0001
Genotype 20 157.75 7.888** 10.81 0.0001
Genotype x Location 80 133.83 1.673** 2.29 0.0001
Error 200 145.92 0.730
c.v % 15.77
Remarks: **= significant at the confidence level of 1%
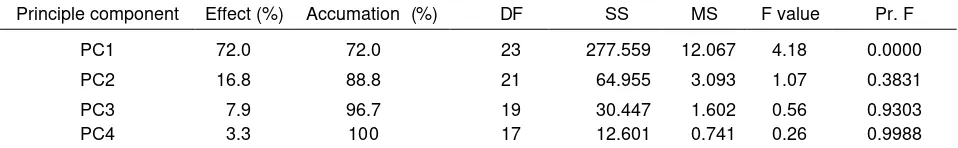
Table 4. Analysis of variance of principle components of biplot genotype and location of the trial of high Fe rice lines in five sites, DS 2011 and DS 2012
Principle component Effect (%) Accumation (%) DF SS MS F value Pr. F PC1 72.0 72.0 23 277.559 12.067 4.18 0.0000
PC2 16.8 88.8 21 64.955 3.093 1.07 0.3831
PC3 7.9 96.7 19 30.447 1.602 0.56 0.9303
PC4 3.3 100 17 12.601 0.741 0.26 0.9988
GGE biplot analysis identified 4 principle components (PCs) which PC1 had very signi-ficant variation (Prob. F < 0.01). PC1 contribute 72 % variation to the total. PC2 contribute 16.8 % to the total variation, with Pr. F value more than 0.005. It means that by using PC1 and PC2, the analysis could explain 88.8 % variation (Table 4).
Mega Environment (Mega-E)
Mega-E is environmental group which has similarity to support performance of some geno-types simultaneously (Crossa et al., 2002). Mega-E is determines by the vertex genotype, i.e. the highest yield genotypes in each quadran developed by GGE analysis visualization (Yan and Hunt, 2002). Position of the vertexs were connected by connecting lines, i.e. a linear line started from the base of biplot that cross perpen-dicularly each connecting line and separated the biplots into some sectors. Sectors containing en-vironments, i.e. sectors containing dots repre-senting environments, called as Mega-E (Jam-bormias, 2011).
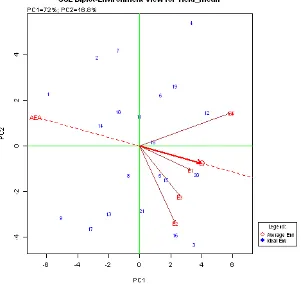
Figure 1. Visualization of the difference of Mega-E on GGE biplot on yield trait of 21 high Fe content rice genotypes in five locations or years, DS 2011 and 2012
Evaluation of Environment
Evaluation of environment is useful to know the appropiateness of an environment that is useful to determine appropiate environment to increase productivity. Evaluation of enviromnent based on GGE biplot analysis (Figure 3) showed that angle of two arrows showed the correlation between two environments. Yan and Tinker (2006) explain that the narrower the angle of two arrows meant the closer the relation between two environments and vice versa. The wider the angle of two arrows meant the more different of the results, because of the bigger effet of GxE of the observed traits.
Vector angle of E5 (Subang, DS 2011 ) and E2 (Karawang, DS 2012) was 900 indicating negative correlation and representation of the
sites, thus analysis in both locations would be different. It also indicted the big different of yield of the tested genotypes in both locations. It showed also that GxE interaction was very strong.
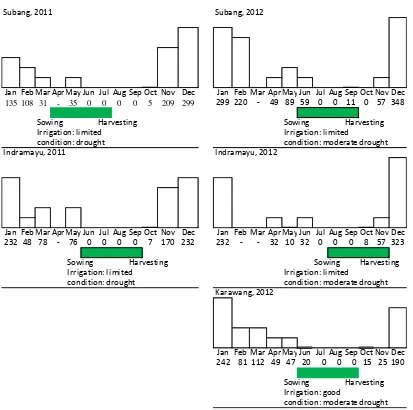
Remarks: rainfall criteria 20-100 = low, 101-300 = medium, 301-400 = high, 401-500 = very high (Source : BMKG 2011 and 2012)
Figure 2. Rainfall occurence (mm) and drought condition during the trials of high Fe rice lines in five specified sites during DS 2011 and DS 2012
Subang, 2011 Subang, 2012
Jan Feb Mar Apr May Jun Jul Aug Sep Oct Nov Dec Jan Feb Mar Apr May Jun Jul Aug Sep Oct Nov Dec
135 108 31 - 35 0 0 0 0 5 209 299 299 220 - 49 89 59 0 0 11 0 57 348
Sowing Harvesting Sowing Harvesting
Irrigation: limited Irrigation: limited
condition: drought condition: moderate drought
Indramayu, 2011 Indramayu, 2012
Jan Feb Mar Apr May Jun Jul Aug Sep Oct Nov Dec Jan Feb Mar Apr May Jun Jul Aug Sep Oct Nov Dec
232 48 78 - 76 0 0 0 0 7 170 232 232 - - 32 10 32 0 0 0 8 57 323
Sowing Harvesting Sowing Harvesting
Irrigation: limited Irrigation: limited
condition: drought condition: moderate drought
Karawang, 2012
Jan Feb Mar Apr May Jun Jul Aug Sep Oct Nov Dec
242 81 112 49 47 20 0 0 0 15 25 190
Sowing Harvesting
Irrigation: good
Figure 3. GGE Biplot power to discriminate (discriminativeness) and power of representation of an environment (representasiveness) of testing of 21 genotypes in 5 environments
Table 5. Standard error of mean and coefficient of variation (CV) of yield trait of 21 high Fe contend rice genotypes in 5 environments (DS 2011 and DS 2012)
Code Location Time St.Error of mean CV (%)
E1 Subang DS 2012 0.090167 15.01
E2 Karawang DS 2012 0.094495 12.60
E3 Indramayu DS 2012 0.072427 8.94
E4 Indramayu DS 2011 0.185600 17.38
E5 Subang DS 2011 0.153479 34.73
GGE biplot analysis showed that there was no location linkage with AEA line (average environment axis). Nevertheless, there were 3 environmetal vector lines which were laid in the same quadrant which had the same quadrant with AEA line, i.e. E1, E2, and E3. The narrow-est angle fo AEA line was was made by E1. It indicated that E1 (Subang, DS 2012) was the ideal location to discriminate and show the per-formance of the tested genotypes. Eventhough E2 and E3 had bigger angles to AEA, both locations laid ini the same quadrant and tended
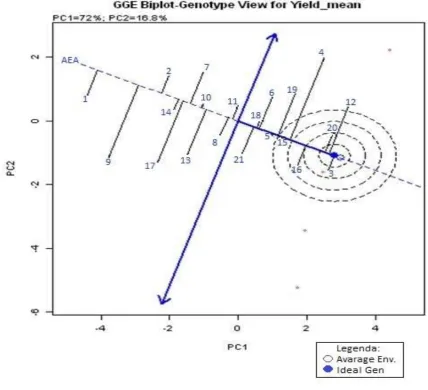
Figure 4. Visualization of GGE biplot showing the stability of genotypes, which linear line showing the axis of environment mean and interupted circle is confidential range
Stability of Genotypes
Visualization of GGE is very useful to evaluate and find the most stable genotypes (Farshadfar et al., 2013). Genotypes laid in the concetris area were the more stable in giving the yield compared to the genotypes laid outside, eventhough the environmental effect was very strong.
Based on GGE biplot, G3 (A691) is the ideal genotype (shown by the bold dot in the center of the concentric area). G3 (A691) had highest yield based on the average from all the
environment, and it was viusalized by its position in the most right end of AEA line. G3 (A691) had the yield average of 6.72 t/ha (Table 6) with vector deviance relatively not so far from the origin point of the vector, indicating the genotype stability (Figure 4).
the average and it is relatively stable. Nevertheless, G3 (A69-1) had relatively higher yield than Ciherang and it was significantly higher than Inpari 13. G3 (A69-1) had highest yield of 6.72 t ha-1, while G20 (Ciherang) had 6.26 t/ha and G21 (Inpari 13) had 5.58 t ha-1 (Table 6). The second highest yield genotypes was G12 (BP9474C-1-1-B) with the average yield of 6.40 t/ha. Nevertheless, the deviation of the vector line was very high and the end of the vector line was laid outside the threshold line. It indicated that G12 was not widely adaptable and the yield was not stable accross the environmetns. Based on GGE biplot, G16 (BP 9458F-36-8-B) and G15 (BP9454F-27-3-2-B) had comparable yield and stability with
Cihe-rang. G16 (BP9458F-36-8-B; 6.21 t/ha) had higher yield than G15 (BP9454F-27-3-2-B; 5.83 t/ha), but less stable than G15.
G15 (BP9454F-27-3-2-B) and G5 (IR840 20-84-2-3-2) were the most stable genotypes, indicated by their position which were excactly on the AEA lines having very small vector devia-tion. It meant that G15 (BP9454F-27-3-2-B) and G5 (IR84020-84-2-3-2) had the widest adapt-ability and stable yield accross the environment compared to other 19 genotypes. Nevertheless, their yields were not higher than Ciherang. Akmal et al., (2014) reported that genotypes with highest yield average was not necesserily be the most stable and vice versa.
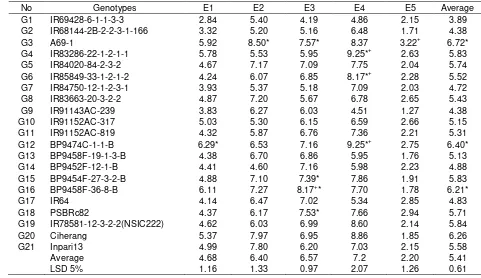
Table 6. Yield (t/ha) of 21 high Fe content rice lines in five locations or years, DS 2011 - 2012
No Genotypes E1 E2 E3 E4 E5 Average
G1 IR69428-6-1-1-3-3 2.84 5.40 4.19 4.86 2.15 3.89 G2 IR68144-2B-2-2-3-1-166 3.32 5.20 5.16 6.48 1.71 4.38 G3 A69-1 5.92 8.50* 7.57* 8.37 3.22+ 6.72* G4 IR83286-22-1-2-1-1 5.78 5.53 5.95 9.25*+ 2.63 5.83 G5 IR84020-84-2-3-2 4.67 7.17 7.09 7.75 2.04 5.74 G6 IR85849-33-1-2-1-2 4.24 6.07 6.85 8.17*+ 2.28 5.52 G7 IR84750-12-1-2-3-1 3.93 5.37 5.18 7.09 2.03 4.72 G8 IR83663-20-3-2-2 4.87 7.20 5.67 6.78 2.65 5.43 G9 IR91143AC-239 3.83 6.27 6.03 4.51 1.27 4.38 G10 IR91152AC-317 5.03 5.30 6.15 6.59 2.66 5.15 G11 IR91152AC-819 4.32 5.87 6.76 7.36 2.21 5.31 G12 BP9474C-1-1-B 6.29* 6.53 7.16 9.25*+ 2.75 6.40* G13 BP9458F-19-1-3-B 4.38 6.70 6.86 5.95 1.76 5.13 G14 BP9452F-12-1-B 4.41 4.60 7.16 5.98 2.23 4.88 G15 BP9454F-27-3-2-B 4.88 7.10 7.39* 7.86 1.91 5.83 G16 BP9458F-36-8-B 6.11 7.27 8.17+* 7.70 1.78 6.21*
G17 IR64 4.14 6.47 7.02 5.34 2.85 4.83
G18 PSBRc82 4.37 6.17 7.53* 7.66 2.94 5.71
G19 IR78581-12-3-2-2(NSIC222) 4.62 6.03 6.99 8.60 2.14 5.84
G20 Ciherang 5.37 7.97 6.95 8.86 1.85 6.26
G21 Inpari13 4.99 7.80 6.20 7.03 2.15 5.58
Average 4.68 6.40 6.57 7.2 2.20 5.41
LSD 5% 1.16 1.33 0.97 2.07 1.26 0.61
CONCLUSIONS
G3 (A69-1, 6.72 t/ha) had highest yield acrross the environmets with the stability comparable to G20 (Ciherang; 6.26 t/ha) and yield were not the highest.
E1 (Subang, DS 2012), E2 (Karawang, DS 2012), and E3 (Indramaru, DS 2012) had good discriminativeness and representasiveness for yield trait of high Fe content rice lines, due to narrow angle of environmental vector arrow to the line of AEA (average environment axis) and locted in the same quadrant with AEA line.
ACKNOWLEDGEMENT
The research was supported collaboratively by IRRI through Harvest Plus Project (DPPC 2009-60 for 2011 and 2012) and IAARD through ICRR. Seed of ICRR lines from Dr. Aan A Daradjat and team, technical assistance from Irmantoro, S.P., Umi Barokah, S.P., Meru, Holil, and Nono Sumaryono are also acknowledged.
REFERENCES
Abdullah, B. and H. Safitri. 2014. Yield stability of elite rice lines (in Indonesian). Food Crop Res. J. 33 (3): 163-168.
Akmal, C. Gunarsih and M.Y. Samaullah. 2014. Adaptation and stability of aromatic rice lines in North Sumatera (in Indonesian). Food Crop Res. J. 33 (1): 9-16.
Asfaw, A., F. Alemayehu, F. Gurum and M. Atnaf. 2009. AMMI and SREG GGE biplot analysis for matching varieties onto soybean production environments in Ethiopia. Sci. Res. Essays 4(11): 1322-1330.
Bouis, H.E. 2004. The potential of biofortified rice for reducing micronutrient malnutrition. Proceedings of the 1st International
Conference on ‘Rice for the Future’. 31
August-2 September 2004. Kasetsart University. Bangkok, Thailand. p. 43-64.
Crossa, J., P.L. Cornelius and W. Yan. 2002. Biplots of linear-bilinear models for studying crossover genotype x environ-ment interaction. Crop Sci. 42 (2): 619-633. doi: 10.2135/cropsci2002.6190 Directorate of Public Nutrition. 1993. Food and
nutrition information (in Indonesian). Food and Nutrition Information Network. Indonesian Ministry of Health. Vol. 4 No. 4.
Farshadfar, E. and M. Sadeghi. 2014. GGE biplot analysis of genotype × environment interaction in wheat-agropyron disomic addition lines. Agric. Commun. 2 (3): 1-7. Farshadfar, E., M. Rashidi, M.M. Jowkar and H.
Zali. 2013. GGE biplot analysis of geno-type × environment interaction in chickpea genotypes. Euro. J. Exp. Bio. 3 (1): 417-423.
Flores, F., M.T. Moreno and J.I. Cubero. 1998. A comparison of univariate and multivariate methods to analyze G xE interaction. Field Crops Res. 56 (3): 271-286. doi: 10.1016/S0378-4290(97)00095-6
Gregorio, G.B. 2004. How IRRI produce the rice we partook. In: Rice Micronutrient Project. Proceedings of Feedback Seminar to Rice Feeding Study Participants. Pasay City, Philippines. October 5, 2003. Institute of Human Nutrition and Food. College of Human Ecology. University of The Phi-lippines. Los Banos. p. 43-53.
Gregorio, G.B., S. Dharmawansa, H. Htut and R.D. Graham. 2000. Breeding for trace mineral density in rice. Food Nutr. Bull. 21 (4): 382-386.
Hadi, A.F and H. Sa’diyah. 2004. AMMI model
for genotype x environment interaction analysis (in Indonesia). Basic Sci. J. 5 (1): 33-41.
Jambormias, E. 2011. Describing of GGE-biplot graphics to evaluate genotypes performance and changes of environ-mental stress in small islands (in Indonesian). Proceedings of National Conference: Development of Small Islands (PERMAMA). University of Pattimura. Ambon. p. 299-310.
multi-environment trials data (in Indonesian). J. Agric. 4 (2): 84-93.
Karimizadeh, R., M. Mohammadi, N. Sabaghni, A.A. Mahmoodi, B. Roustami, F. Seyyedi and F. Akbari. 2013. GGE biplot analysis of yield stability in multi-environment trials of lentil genotypes under rainfed condition. Not. Sci. Biol. 5 (2): 256-262.
Rasyad, A. and A. Anhar. 2007. Genotype × environment interaction and yield stability of several yield components among adapted rice cultivars in West Sumatera. Zuriat 18 (2): 100-105. Satoto, M.J. Mejaya, Y. Widyastuti and I.A.
Rumanti. 2013. Yield stability and potency of hybrid rice new varieties (in Indonesian). Food Crop Res. J. 32 (2): 67-73.
Sumertajaya, I.M. 2007. Statistical analysis of genetic and environment interaction (in Indonesian). Department of Statistics, Faculty of Mathematics and Science. Bogor Agricultural University. Bogor. Widyastuti, Y., Satoto and I.A. Rumanti. 2013. The
application of regression analysis and
AMMI to evaluate the stability of rice genotype and interaction effect between genotype and environment (in Indo-nesian). J. Agric. Inform. 22 (1): 21-27. Yan, W., M.S. Kang, B. Ma, S. Woods and P.L.
Cornelius. 2007. GGE biplot vs. AMMI analysis of genotype-by-environment data. Crop Sci. 47: 641-655.
Yan, W. and N.A. Tinker. 2006. Biplot analysis of multi-environment trial data: Principles and applications. Can. J. Plant Sci. 86: 623-645.
Yan, W. and L.A. Hunt. 2002. Biplot analysis of multi-environment trial data. In: Quantitative genetics, genomics and plant breeding. M.S. Kang (ed.). CABI Publishing. Walingford, Oxon. UK. p. 289-303.