http://dx.doi.org/10.17503/Agrivita-2014-36-1-p009-013
PATH COEFFICIENT ANALYSIS ON G39×CIHERANG AND MENTIK WANGI×G39
RICE
IN F4 GENERATION
Totok Agung D H1), Fuad Nur Azis1*), Ponendi Hidayat1), Dyah Susanti1), Agus Riyanto1) and Shao Hui Zheng2)
1)
University of Jenderal Soedirman
Kampus Grendeng UNSOED, Mailbox 109 Central Java Indonesia 53122
2)
Saga University Japan
*) Corresponding author Phone: +62- 281 638791 E-mail: [email protected]
Received: August 19, 2013/ Accepted: January 29, 2014
ABSTRACT coefficient correlation directly and indirectly to gain information about nature relationship between yield component and protein content to grain yield. Research material consisted of 61 selected plants from G39×Ciherang and 66 selected plants from Mentik Wangi×G39 at F4 generation. Plants were planted in Banyumas in May 2011. Number of panicles per plant, panicle length, 1000 g of grain weight, percentage of filled grain per panicle, protein content, and grain yield were correlated by using Pearson correlation and were followed by path coefficient. Number of panicles per plant, panicle length, 1000 g of grain weight, percentage filled grain per panicle, and protein content were used as dependent variable, while grain yield was used as independent variable. The result showed that protein content in both populations was not correlated with all yield components. The numbers of panicles, followed by panicle length, had highest positive direct effect to yield. The number of panicle was a positive mediator variable to yield from another variable.
Keywords: correlation, direct effect, indirect effect, mediator variable, path analysis
INTRODUCTION
Rice (Oryza sativa L.) is the predominant staple food for Indonesia. Quantity stock and nutrient quality of rice must be fulfilled in order to
achieve national food security (Pangan, 2012). Rice harvest areas in Indonesia decrease every year due to rice fields conversed to residences. On the contrary, rice consumption keep important nutrients in rice. Rice provides 38% of dietary protein intake even though the protein content in rice is low (Indrasari, 2006). Increasing protein content in rice would result in more protein intake in large number (Juliano, 1993).
Grain yield is one complex variable that depends on another variable. Number of panicles per plant, panicle length, percentage of filled grain per panicle, and 1000 g grain weight are variables which significantly contribute to rice. Matsue et al. (1994) has reported that grain yield of rice has negative correlation with protein content. Protein content in rice is reported to have negative correlation with 1000 weight grain. This presents difficulty in the selection to gain high yield and protein content in rice.
Information about relationship among variable will improve selection method to gain high yield and high protein content in rice. Path coefficient, which measures direct and indirect effect for one variable upon another, was applied to partition the correlation into its component (Dewey et al.,1959). Path coefficient can identify nature relationship between variables (Bhatt, 1973).
In this study, an attempt was made to investigate the direct and indirect influences of number of panicles per plant, panicle length, percentage of filled grain per panicle, 1000 g
grain and protein on grain yield in high protein breeding lines by adopting correlation and path coefficient analysis. The results might be used to adopt selection criteria in further studies. It may increase the selection efficiency. Therefore, breeders save time and expenses during selection.
MATERIALS AND METHODS
Plant Material
Plant materials comprised 61 selected plants from G39×Ciherang and 66 selected plants from Mentik Wangi×G39 at F4 generation. Mentik Wangi was upland rice with high protein content (14.53). G39 was pure line genotype created from Mentik Wangi×Poso. This genotype has high protein content potential (11.78) for parental genotype. Ciherang is a high yielding cultivar commercialized in 2000 with potential yield of 5-8.5 t/ha). Both G39×Ciherang and Mentik Wangi×G39 population were planted in Banyumas, Central Java, Indonesia with augmented design. The plant grew from May to September 2011. Spacing between plant genotypes was 25 cm. Fertilizer was applied at the rate of 200 kg ha-1 Urea (46.6% N) and 300 kg NPK (15% N, 15 P2O5, and 15% KCl).
Yield Component and Crude Protein Content Analysis
Yield component in this study consisted of numbers of panicles per plant, panicle length,
1000 g grain weight, and percentage of filled grain per panicle. Crude protein content was measured according to the kjeldahl. Protein content was calculated by multiplying conversion factor of 5.95. Crude protein content was analyzed at Coastal Bioenvironmental Center, Saga University. Path coefficient analysis was performed by using phenotypic correlation considering grain yield as the responding variable and panicles per plant, panicle length, 1000 g grain weight, and percentage of filled grain per panicle by method described by Wright (1934).
RESULTS AND DISCUSSION
Correlation Coefficient
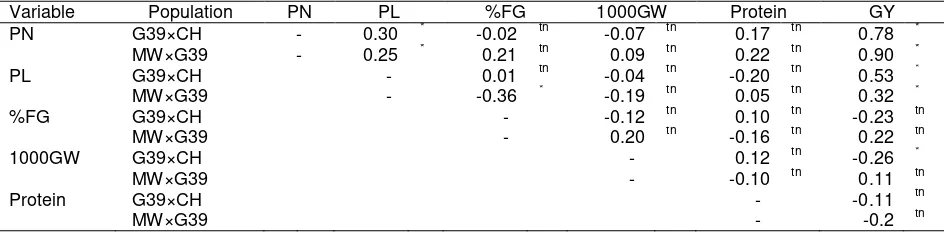
The phenotypic correlations are presented in Table 1. Results revealed that grain yield showed positive significance with the number of panicles per plant and panicle length under G39×Ciherang and Mentik Wangi×G39 population. G39×Ciherang population showed negative correlation between yields and 1000 grain weight. Negative correlation was shown between panicle length and percentage of filled grain per panicle in Mentik Wangi×G39. Lower correlation and negative correlation among those variables indicated that the relationship was affected by environment at phenothypic level. Environment influence on correlated coefficient in rice was also reported by Prasad et al. (2001).
Table 1. Phenotypic correlation coefficients of yield and yield component protein G39×Ciherang and Mentik Wangi×G39 population
Variable Population PN PL %FG 1000GW Protein GY
PN G39×CH - 0.30 * -0.02 tn -0.07 tn 0.17 tn 0.78 *
MW×G39 - 0.25 * 0.21 tn 0.09 tn 0.22 tn 0.90 *
PL G39×CH - 0.01 tn -0.04 tn -0.20 tn 0.53 *
MW×G39 - -0.36 * -0.19 tn 0.05 tn 0.32 *
%FG G39×CH - -0.12 tn 0.10 tn -0.23 tn
MW×G39 - 0.20 tn -0.16 tn 0.22 tn
1000GW G39×CH - 0.12 tn -0.26 *
MW×G39 - -0.10 tn 0.11 tn
Protein G39×CH - -0.11 tn
MW×G39 - -0.2 tn
Table 2. Path coefficient of yield component protein to yield G39×Ciherang
Variable
Direct Indirect effect by
GY
Effect PN Protein PL %FG 1000GW
PN 0.66 0.01 0.10 0.00 0.01 0.78 *
Protein 0.07 0.11 -0.07 0.02 -0.02 -0.11
PL 0.34 0.20 -0.01 0.00 0.01 0.53 *
%FG 0.21 -0.01 0.01 0.00 0.02 -0.23
1000GW -0.18 -0.05 0.01 -0.01 -0.03 -0.26 *
Remarks:ɛ=0.20 PN: number of panicles per plant, PL: panicle length, %FG: percentage of filled grain per panicle, 1000GW: 1000 ggrain weight, GY: Grain yield
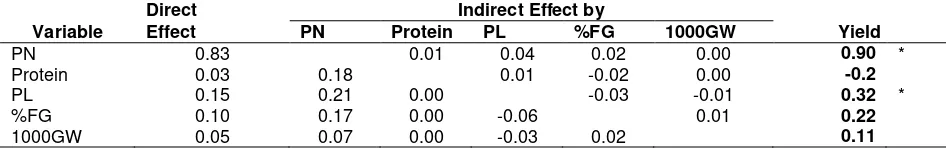
Table 3. Path coefficient of yield component protein to yield Mentik Wangi×G39
Variable
Direct Indirect Effect by
Yield
Effect PN Protein PL %FG 1000GW
PN 0.83 0.01 0.04 0.02 0.00 0.90 *
Protein 0.03 0.18 0.01 -0.02 0.00 -0.2
PL 0.15 0.21 0.00 -0.03 -0.01 0.32 *
%FG 0.10 0.17 0.00 -0.06 0.01 0.22
1000GW 0.05 0.07 0.00 -0.03 0.02 0.11
Remarks: ɛ=0.17 PN: number of panicles per plant, PL: panicle length, %FG: percentage of filled grain per panicle, 1000GW: 1000 g grain weight, GY: Grain yield
Protein and 1000 g grain weight were not correlated with another yield component. This correlation value informed that G39×Ciherang and Mentik Wangi×G39 population have potential for high yield and high protein genotype selection. Percentage of filled grain per panicle has negative correlation with panicle length under Mentik Wangi×G39 population. Panicle length has positive correlation with the number of panicles per plant under G39×Ciherang and Mentik Wangi×G39 population.
Path Coefficient
Correlation coefficients were analyzed further by path coefficient technique for direct and indirect effects via alternative characters. The direct and indirect effects of the grain yield G39×Ciherang population related traits are shown in Table 2. The path coefficient analysis showed that the number of panicles per plant has the highest direct effect on grain yield (0.66). Grain yield was affected by panicle length (0.34), percentage of filled grain per panicle (0.21), and 1000 g grain weight (-0.18). Protein has the lowest direct effect to grain yield (0.07).
The number of panicles per plant functioned as a high mediator variable for grain yield from protein (0.11) and panicle length
(0.20). One-thousand-gram grain weight has negative indirect effect on yield with the number of panicles per plant 0.05), panicle length (-0.01), and percentage of filled grain per panicle (-0.03). The negative direct effect made coefficient correlation between 1000 g grain weight and grain yield higher than the percentage of filled grain per panicle. This information showed that selection with 1000 g grain weight was ineffective to gain high yield because it has complex relationship with other yield components.
Table 3 showed direct and indirect effects of grain yield from Mentik Wangi×G39 population. The path coefficient analysis showed that the number of panicles per plant had the highest direct effect on grain yield (0.83). Grain yield was affected by panicle length (0.15) and percentage of filled grain per panicle (0.10). Grain yield was affected by protein (0.03) and 1000 g grain weight (0.05) with low scale. Number of panicles per plant served as high mediator variable for grain yield from protein (0.18) and panicle length (0.21) and percentage of filled grain per panicle (0.17).
panicle from G39×Ciherang population had higher direct effect than 1000 g grain weight but 1000 g grain weight affected yield by another variable higher than percentage of filled grain per panicle. Negative effect on grain yield by 1000 g grain weight increased because the number of panicles per plant, panicle length and percentage of filled grain per panicle gave negative mediator variable to yield from 1000 g grain weight (Shipley, 2002). It is different from Mentik Wangi×G39, where there was no negative correlation or negative path coefficient in 1000 g grain weight and yield except the indirect effect from panicle length. Thus, different population had different correlation and path coefficient.
Protein was not correlated with grain yield and had low direct effect on yield in G39×Ciherang and Mentik Wangi×G39, but it had positive effect on yield by number of panicles per plant. It may be caused by varied proteins between panicles in one plant (Matsue et al., 1994). This is valuable information for the next generation selection. High yield cultivar can be selected by investigating the number of panicles in high protein content of G39×Ciherang and Mentik Wangi×G39 population. The number of panicles per plant served as a good mediator variable for yield in both G39×Ciherang and Mentik Wangi×G39 population. It was because another variable had positive indirect effect to yield by the number of panicles per plant. The number of panicles per plant can function as a great variable in indirect selection for grain yield because the number of panicles per plant gives positive effect from another variable (Edwards and Lambert, 2007; Garson, 2009; MacKinnon et al., 2002).
CONCLUSIONS
The result indicated that protein content in both populations was not correlated with all yield components. The number of panicles followed by panicle length had the highest positive direct effect on yield. The number of panicles served as a positive variable for yield from another variable. Selection through the number of panicles was suggested to gain high yield cultivar in high protein content population.
ACKNOWLEDGEMENTS
Many thanks are addressed to the Bureau of Planning and International Cooperation for the financial support and National Strategy Research Grant from Directorate General of Higher Education, Ministry of Education and Culture of Indonesia. Gratitude is also addressed to Coastal Bio-environmental Center for the Laboratory research support, Saga University Japan.
REFERENCES
Bhatt, G.M. 1973. Significance of path coefficient analysis in determining the nature of character association. Euphytica, 22(2): 338-343.
Dewey, R. Douglas and K.H.Lu. 1959. A correlation and path-coefficient analysis of components of crested wheatgrass seed production. Agronomy Journal. 51(9): 515-518.
Edwards, J.R. and L.S. Lambert 2007. Methods for integrating moderation and mediation: a general analytical framework using moderated path analysis. Psychological methods. 12(1):1-22
Garson, G.D. 2009. Path analysis. from Statnotes: Topics in Multivariate Analysis. Retrieved. March 17, 2009.
Indrasari, S.D. 2006. Mineral Content in Excellent Paddy Cultivar and its correlation with Health (in Indonesian). Science and Technology (Iptek) in Crops. 1:88-99. Juliano, B.O. 1993. Rice in Human Nutrition (FAO
Food and Nutrition Series. No. 26). FAO: Rome. pp 162.
MacKinnon, D.P., C.M. Lockwood, J.M. Hoffman, S.G. West and V. Sheets. 2002. A comparison of methods to test mediation and other intervening variable effects. Psychological methods, 7(1): 83.
Matsue, Y., K. Odahara and M. Hiramatsu. 1994. Differences in protein content, amylose content and palatability in relation to location of grains within rice panicle. Japanese Journal of Crop Science. 63(2): 271-277.
Panuju, D.R., K. Mizuno and B.H. Trisasongko. 2013. The dynamics of rice production in Indonesia 1961–2009. Journal of the Saudi Society of Agricultural Sciences. 12(1): 27-37.
Prasad, B., A.K. Patwari and P.S. Biswas. 2001. Genetic Variability and Selection Criteria in Fine Rice (Oryza sativa L.). Pakistan Journal of Biological Science. 4(10):1188-1190.
Shipley, B. 2002. Cause and Correlation in Biology: A User's Guide to Path Analysis, Structural Equations and Causal Inference. Cambridge University Press: Cambridge. pp. 317.
Sumaryanto, S. Friyatno and B. Irawan. 2001. Land Conversion from Paddy Fields to Non-agricultural Lands and Its Negative Impacts. National Seminar on Paddy Field Multifunction (In Indonesian). The Department of Agriculture. p. 1-18. Susanto, U., A.A. Daradjat and B. Suprihatno.
2003. The Development of Plant Breeding in Paddy Field in Indonesia (in Indonesian). Agricultural Development and Research. 22(3): 125-131.