Mudasir, et al.
SPECTROPHOTOMETRIC DETERMINATION OF PYROCATHECOL AND
PYROGALLOL BASED ON THEIR REDOX REACTION WITH
IRON(III)/PHENANTHROLINE SYSTEM
Mudasir, Mugiyanti, Ngatidjo HadipranotoDepartment of Chemistry, Faculty of Mathematics and Natural Sciences, Gadjah Mada University, Sekip Utara, P.O. Box Bls. 21, Yogyakarta 55281, Indonesia
Fax: (+62) 274 513339, E-mail: [email protected]
ABSTRACT
An analytical method for the spectrophotometric determination of some phenolic compounds, i.e.: pyrocathecol and pyrogallol based on their redox reaction with iron(III)-phenanthroline complex has been developed. These two compounds, in appropriate conditions, reduce iron(III)-phenanthroline complex to yield very stable and color-intense complex of iron(II)-phenanthroline, [Fe(phen)2]
2+
, whose concentration is equivalent to the amount of pyrocathecol or pyrogallol in the solution, and is easily detected by spectrophotometric method. Some parameters influencing the sensitivity of the determination were optimized. These included maximum absorption wavelength, pH of the solution, time and temperature of heatingand reagent to analyte minimum mole-ratio. Using the optimum conditions obtained, the analytical performance of the method was examined and the developed method was then applied to analyzed pyrocathecol and pyrogallol contents in several river water of Yogyakarta, Indonesia.
Result of the study showed that the optimum conditions for the determination of pyrocathecol are as follows: maximum absorption wavelength (λmax) at 510 nm, pH of the solution = 4, heating time = 120 min, heating temperature = 70 0C and the minimum mole ratio of reagent to analyte is 8. On the other hand, the optimum conditions for the determination of pyrogallol are as follows: maximum absorption wavelength (λmax) at 510 nm, pH of the solution = 5, heating time = 90 min, heating temperature = 90
0 C and the minimum mole ratio of reagent to analyte is 7. At the corresponding conditions of analysis, calibration curves for pyrocathecol and pyrogallol are linear in the range concentration of 0.00 – 0.16 ppm and 0.00 – 0.24 ppm, respectively. The correlation coefficients for both compounds were found to be higher than 0.998 and the detection limits went down below 0.07 ppm. It has been demonstrated that the developed method can be applied for the determination of pyrocathecol and pyrogallol contents in natural samples.
Keywords:Spectrophotometry, phenolic compounds, 1,10-phenanthroline, redox reaction
INTRODUCTION
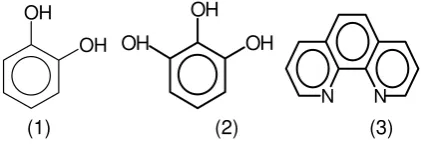
Phenolic compounds such as pyrochatecol and pyrogallol are, for different purposes, widely used chemicals and are present in a great variety of waste effluents of different industries, such as paper mills, chemical industries of production of herbicides and fungicides, etc.. These compounds are quite toxic and slowly degrade in the environment, giving aromatic intermediates, most of them are also of environmental concern.[1,3] In this way, development of simple, accurate, sensitive and low-cost analytical method for the determination of phenol content in the environment are of essential issue in order to monitor and control the level of their existence in the environment.
Mudasir, et al.
the chromatographic determination of phenolic compounds in the samples becomes complicated and subject to serious interferences[5].
Redox reactions are frequently used in spectrophotometric determination, particularly those in which colored reaction products are formed. Redox reactions can be described by the generalized formula:
m Oxr + n Red1 º p Redt + q Oxw (1)
When the reaction involving complexes of a metal (in different oxidation states: M and M’) with a ligand, the equation (1) is rewritten as:
m MrLx + n Reds º p Mt’Ly + q Oxw (2)
where x and y may or may not be equal, depending on the nature of the metal ion and the ligand.[6] One or both of these complexes may be colored, that would make the system useful for spectrophotometric analysis. In addition, one of the metal complexes is possibly an extractable species. This will increase the selectivity and sensitivity of the analysis. The iron(III)-phenanthroline (Fe(III)/phen) system is a valuable reagent for analyte with reducing properties, because the final product is the intensely colored and extractable chelate [Fe(phen)3]
2+
[7]. Because phenolic compounds are more or less strong reducing agents, they give deeply colored compounds with Fe(III)/phen system.
Although the application of [Fe(phen)3] 2+
and [Ru(phen)3]2+ as counter-cation for the determination of various anions by means of HPLC has been reported in limited number of literatures, the utilization of [Fe(III)/(phen)3]
3+ as a reagent for the determination phenolic compounds based on their redox reactions with the reagent, so far, has never been explored. In the present study, we develop spectro-photometric methods for the determination of pyrocathecol and pyrogallol based on their redox reactions with (Fe(III)/phen) reagent. The parameters influencing the sensitivity of the determination, which include maximum absorption wavelength, pH of the solution, time and temperature of heating and reagent to analyte
minimum mole-ratio has been optimized. Using the optimum conditions obtained, the analytical performance of the method was examined and to test the usefulness of the method we have applied the method for the determination of pyrocathecol and pyrogallol contents in several river waters.
EXPERIMENTAL
The spectrophotometric measurements were performed with a Perkin Elmer Lambda 20 UV-Visible spectrophotometer. The pH adjustments were made with dilute sulfuric acid or ammonia solutions and controlled by the use of Fisher M-230A pH meter. The components were mixed in the following order: Fe(III), phen, buffer solution, pH adjuster and analyte (reductant). To increase the reaction rate, samples were heated at certain temperature for a certain period in accordance with the optimum conditions of corresponding analyte.
Reagents
Solution of 0.002 M iron(III) was prepared by dissolving Fe(NH4)(SO4)⋅12H2O (Merck) in 0.01 M sulfuric acid. 1,10-Phenanthroline (Kanto Chemical Co., Inc., Japan) was used for the preparation of 0.002 M solution in 0.005 M sulfuric acid. Pyrocathecol and pyrogallol (Merck) were obtained commercially and all dilutions were made by the use of double-distilled water prepared in our laboratory (Yamato AUTO STILL model WAU-12).
RESULT AND DISCUSSION
Absorbtion spectra
The absorption spectra of the solution for the determination of pyrocathecol and pyrogallol monitored in the visible region of wavelength are very similar to that of [Fe(phen)3]
2+
with the maximum absorption observed at 510 nm. This result clearly suggests that the product of the redox reaction between analyte and Fe(III)/phen system is a red colored solution of [Fe(phen)3]
2+
Mudasir, et al.
.
0.00 0.05 0.10 0.15 0.20
400 450 500 550 600
Wavelength (nm)
Absorbance
0.22 ppm pyrocathecol
0.25 ppm pyrogallol
Fig. 2 Absortion spectra of [Fe(phen)3] 2+
resulted from the reduction of Fe(III)/phen by analytes.
Fig. 3 Effect of pH on the absorbance of the solution for pyrocathecol (square) and pyrogallol (triangle) analyses.
The absorption spectra for the determination of pyrocathecol and pyrogallol are given in Fig. 2. This absorption is due to Metal-to-Ligand Charge Transfer (MLCT), d→ * transition of the [Fe(phen)3]
2+
complex[8,9].
Effect of pH
Iron(III)/phen system may form various species at different pH of the solution and the redox reaction between Iron(III)/phen and analytes is also a pH dependence. Therefore, the effect of pH on the absorbance of [Fe(phen)3]
2+
resulted from reduction of Fe(III)-phen reagent was examined over pH range of 2 – 9 and the results are presented in Fig. 3.
Fig. 3 shows that the absorbance of the solution increases with pH up to certain value and
starts to decrease as the pH reaches 5. This phenomena may be explained with respect to the redox reaction between analyte and reagent as well as the formation of [Fe(phen)3]2+. The reduction potential of Fe3+-phen/Fe2+-phen is a pH-dependence and will decrease as the pH of the solution increases. This means that the reduction of Fe(III)/phen system become harder at high pH. Moreover, as pH of the solution reaches 5, iron(II) in the solution starts to precipitate; this would be a competitive process that reduce the formation of [Fe(phen)3]2+. Therefore it is expected that the redox reaction will proceed smoothly at lower pH. However, at relatively low pH, both N-atoms of phen ligand can be protonated, resulting in the following protolytic equilbria[9].
0.00 0.05 0.10 0.15 0.20 0.25 0.30
0 2 4 6 8 10
pH of the solution
Mudasir, et al.
0.20
0.21
0.22
0.23
0.24
0.25
0
30
60
90
120
150
180
Heating time (min)
Absorbance
0.17 0.18 0.19 0.20 0.21 0.22 0.23 0.24 0.25
10 30 50 70 90 110
Heating temperature(
oC)
Absorbance
H2phen 2+
º Hphen+ + H+ (pKa1 = 1.9) (3) Hphen+ º phen + H+ (pKa2 = 4.96) (4)
The above equations clearly show that phen ligand will be free from protonation at pH around 5. Our results of study revealed that the optimum pH-s for the determination of pyrocathecol and pyrogallol are 4 and 5, respectively.
Effect of solution heating
In general, redox reaction is kinetically a slow process in which the rate of the process can usually be enhanced by heating. In this study, the effect of solution heating on the redox reaction between analytes and reagent was studied by monitoring the change in absorbance of the
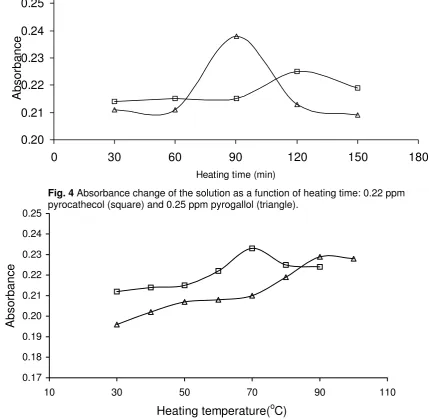
solution as a funtion of heating time and temperature. The solution has the highest absorbance after being heated at constant temperature of ca. 60 oC for 120 and 90 min for pyrocathecol and pyrogallol determination, respectively (Fig. 4). Further heating of the solutions tends to decrease the absorbance. This is probably due to the dissociation of the complex formed or the auto-degradation of the analytes, assisted by overheating. The similar trends are also observed when the solutions are heated at constant time of heating, i.e.: 120 min for pyrocathecol and 90 min for pyrogallol, but the heating temperature is varied. It was found that the optimum temperature of heating is 70 and 90 o
C for pyrocathecol and pyrogallol, respectively.
Fig. 4 Absorbance change of the solution as a function of heating time: 0.22 ppm pyrocathecol (square) and 0.25 ppm pyrogallol (triangle).
Mudasir, et al.
0.00
0.10
0.20
0.30
0
0.1
0.2
0.3
0.4
0.5
Analytes (ppm)
Absorbance
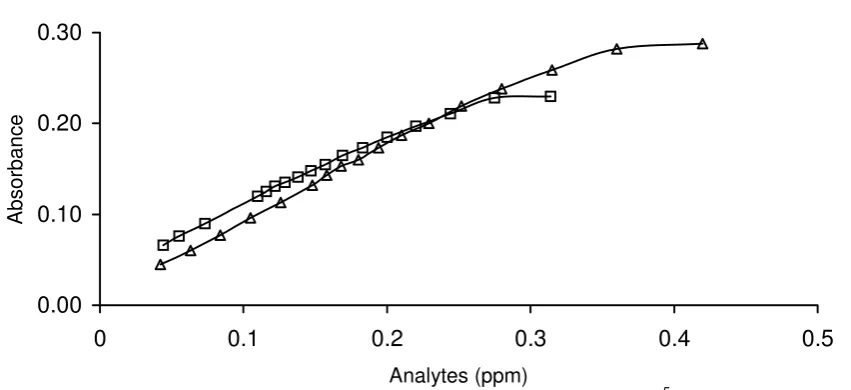
Fig. 6 Determination of minimum mole-ratios of Fe(III)/phen (2 x 10⁻⁵ M) to pyrocathecol (square) and to pyrogallol (circle).
Effect of solution heating
In general, redox reaction is kinetically a slow process in which the rate of the process can usually be enhanced by heating. In this study, the effect of solution heating on the redox reaction between analytes and reagent was studied by monitoring the change in absorbance of the solution as a funtion of heating time and temperature. The solution has the highest absorbance after being heated at constant temperature of ca. 60 oC for 120 and 90 min for pyrocathecol and pyrogallol determination, respectively (Fig. 4). Further heating of the solutions tends to decrease the absorbance. This is probably due to the dissociation of the complex formed or the auto-degradation of the analytes, assisted by overheating. The similar trends are also observed when the solutions are heated at constant time of heating, i.e.: 120 min for pyrocathecol and 90 min for pyrogallol, but the heating temperature is varied. It was found that the optimum temperature of heating is 70 and 90 oC for pyrocathecol and pyrogallol, respectively.
Minimum mole-ratio of reagent to analyte
Since the redox reaction is an equilibrium state, it is very important to ensure that the process favorably proceeds in forward direction (product formation) in order to gain highest sensitivity during analysis. This can be accomplished by making one
of the reactants (reagent) exist in excessive condition. Therefore, minimum mole-ratio of reagent to analyte is an important parameter that should be determined before analysis is conducted. Results of our study show that the minimum mole-ratio of [reagent]/[analyte] required for a complete oxidation of analyte is 8 for pyrocathecol and 7 for pyrogallol. This result indirectly indicates that the reducing ability of two compounds is almost the same. Therefore, during the course of analysis, the concentration of reagent is kept higher than the corresponding value of mole-ratio; otherwise Beer’s law will not be followed by the absorbance of the solution.
Analytical characteristics of the method
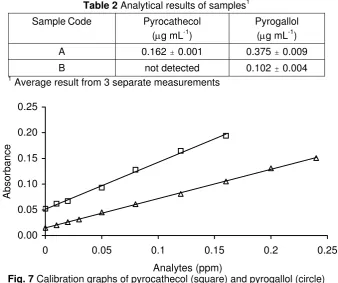
In order to know the analytical characteristics of the method, a calibration graph for each compound was constructed according to the analytical procedure described in experimental section. Under the optimum operating conditions selected, calibration graphs of absorbance and analyte concentration were strictly linear (Fig. 6) in the interval of 0.0 – 0.16 μg mL-1 for pyrocathecol and 0.0 – 0.24 μg mL-1 for pyrogallol. The correlation coefficients for both compounds are above 0.998, the sensitivity is relatively high (>0.55 AU/ppm) and the detection limit (3 σ) goes down at ppb level. Detailed analytical characteristics of the proposed method are listed in Table 1.
Table 1 The analytical characteristics of the method
Analytical Parameters Pyrocathecol Pyrogallol
Range of Linearity (ppm) 0.0 – 0.16 0.0 – 0.24
Correlation Coefficent (r) 0.9981 0.9996
Sensitivity (AU/ppm) 0.9132 0.5705
Mudasir, et al.
0.00 0.05 0.10 0.15 0.20 0.25
0 0.05 0.1 0.15 0.2 0.25
Analytes (ppm)
Absorbance
Table 2 Analytical results of samples1
Sample Code Pyrocathecol (μg mL-1)
Pyrogallol (μg mL-1)
A 0.162 " 0.001 0.375 " 0.009
B not detected 0.102 " 0.004 1
Average result from 3 separate measurements
Fig. 7 Calibration graphs of pyrocathecol (square) and pyrogallol (circle)
Determination of analytes in natural samples
The developed method was applied to the determination of pyrocathecol and pyrogallol in river water in Yogyakarta, Indonesia in order to assess the possible analytical applications of the method. The result of the determinations is given in Table 2 along with its standard deviation from three separate measurements of the samples (n = 3). The low value of standard deviations indicates that the repeatability of the method is quite good. In general, Table 2 suggests that the content of these compounds is still lower than the permitted concentration of total phenolic compounds in the environment. However, these two compounds cannot wholly represent phenolic compounds because this class of compound consists of many kinds of compounds.
CONCLUSION
A spectrophotometric method for the determination of pyrocathecol and pyrogallol based on their redox reaction with iron(III)/1,10-phenanthroline has been developed. The method is relatively easy to handle and strictly obeys Beer’s low with a low level of detection limit. Analytical result of the determination of those two compounds in river water by means of this method demonstrates that the method is applicable to be used for a routine analysis. However, possible
interferences from other compounds having reducing properties should be aware.
References
1. Peiro, A.M., Ayllon, J.A., Peral, J. and Domenech, X., 2001, Applied Catalysis B: Environmental, 30, 359 – 373.
2. Cooper, W.J., 1981, Chemistry in Water Reuse, Vol. 2, Ann Anbor Science Publisher Inc., Michigan, USA.
3. Ouelette, J.R., 1998, Organic Chemistry, 2nd Ed., Prentice Hall International, New York.
4. Jain, R.K., Aurelle, Y., 1997, Environmental Technologies and Trends, Springer Verlag, Berlin-Heidelberg, Germany..
5. Haryono, 1997, Analisis Senyawa Fenolik dalam Air Limbah Industri Migas dengan Metode Kromatografi Cair Kinerja Tinggi, Skripsi, FMIPA UGM, Yogyakarta.
6. Koch, S. and Ackermann, G., 1992, Talanta, 39, 687 – 691.
7. Koch, S. Ackermann, G. and Linder, P, 1992, Talanta, 39, 693 – 696.
8. Shriver, D.F., Atkins, P.W. and Langford, C.H., 1990, Inorganic Chemistry, Oxford University Press, Oxford.

![Fig. 2 Absortion spectra of [Fe(phen)3]2+ resulted from the reduction of Fe(III)/phen by analytes](https://thumb-ap.123doks.com/thumbv2/123dok/3372144.1758360/3.595.199.438.121.301/fig-absortion-spectra-phen-resulted-reduction-iii-analytes.webp)


