THE QUALITY IMPROVEMENT OF PRIMER PACKAGING
PROCESS USING SIX SIGMA METHODOLOGY
Prima Ditahardiyani 1, Ratnayani 2, M. Angwar 3
123)
Technical Implementation Unit for Development of Chemical Engineering Processes Indonesian Institute of Sciences
Gading, Playen, Gunungkidul, Yogyakarta Email : [email protected]
ABSTRACT
The implementation of Six Sigma has become a common theme in many organizations. This paper presents the Six Sigma methodology and its implementation in a primer packaging process of Cranberry drink. DMAIC (Define, Measure, Analyze, Improve and Control) approach is used to analyze and to improve the primer packaging process, which have high variability and defects output. After the improvement, the results showed that there was an increasing sigma level. However, it is not significantly and has not achieved the world standard quality, yet. Therefore, the implementation of Six Sigma in primer packaging process of Cranberry drink still has a room for doing a further research.
Keywords: Six Sigma, primer packaging process, DMAIC
1. INTRODUCTION
In recent years, the change in technology and innovation has been increasing significantly. The quest to provide better, cheaper and faster products and services in order to achieve customer satisfaction have been greatly intensified (Raharjo, 2007). Six Sigma gains momentum as one of the most effective improvement drives among a large number of multinational organizations, and its adoption shows an upward trend (Desai, 2006). Six Sigma provides a set of tool to be used when a focused technical breakthrough approach is required to resolve complicated technical issues such as design and manufacturing or business process issues (Ladani, et al., 2006).
Since the beginning of the 1990s, the Six Sigma initiative which makes use of a collection of quality management and statistical tools has been introduced and practiced as a quality management system (Antony and Banuelas, 2002; Goh and Xie, 2004). This article presents the application of Six Sigma to improve quality in primer packaging process of Cranberry drink.
Cranberry drink is a healthy drink from Hibiscus Radiatus cuv calyces. The production processes of Cranberry drink consist of these following procedures: grinding, sieving, sterilization, and packaging. In the packaging step there will be two types of processes, they are, primer and secondary ones. Moreover, the primer packaging process can be split into four steps, i.e., inspection of sachet, machine setting, filling, and final inspection, and the secondary packaging process can be split into two steps, i.e., filling and final inspection.
packaging process and to determine the improvement plan in increasing capability process of primer packaging process using Six Sigma method.
2. SIX SIGMA
Six Sigma is a systematic methodology for continuous process of quality improvement and continuous process of achieving operational excellence. Six Sigma has been on an incredible run for over 15 years, producing significant saving to the bottom line of many large and small organizations (Hoerl, 2004). According to Brue (2006), Six Sigma is a problem-solving technology that uses data, measurements, and statistics to identify the vital few factors that will dramatically decrease waste and defects while increasing predictable results, customer satisfaction, profit, and shareholder value.
A number of papers and books have been published showing the fundamentals of Six Sigma, such as, Six Sigma deployment, critical success factors of Six Sigma implementation, Six Sigma project selection and supporting organizational infrastructure required for successful implementation of Six Sigma.
Man (2002) highlights the responses of Six Sigma in Singapore. He points out that a leading semiconductor foundry states the ideology ‘Six Sigma in everything that we do’: that the basic work value is to achieve the Six Sigma standard. The statements are grand and well documented in the organization’s corporate vision and mission statements and corporate business plan. The decisive moment comes when measurements are required on the key performance indicators, defects per opportunities and sigma levels.
The objective of Six Sigma quality is to reduce process output variation so that on along term basis, which is the costumer’s aggregate experience with our process over time, will result in no more than 3.4 defects per million opportunities (DPMO) (Ladani, 2006). There are five high-level steps in the application of Six Sigma tactics called DMAIC, i.e. Definition-Measurement-Analysis-Improvement-Control (Eckes, 2002).
The five-stage process of Six Sigma begin with the define phase. Define phase involves identifying a project’s critical to quality (CTQ) characteristics. In the measure phase, the team identifies the key of internal processes that influence CTQs and measures defects currently generated relative to these processes. The analyzing phase consists of three steps: establishing process capability, defining performance objectives, and identifying sources of variation. The improving phase helps the team confirm the key variables and quantifies their effects on the CTQs. In the control phase, the improving process is monitored and documented to ensure that the financial improvements are sustained (Das and Roy, 2007).
3. CASE STUDY
In this discussion, we will describe DMAIC phases as a basic concept on doing quality improvement by using Six Sigma methodology.
A.. Define
Free-defect primer packaging process
Good seal
Apropriate product weight
Sharp cutter Good sachet
(Need )
(Requirements)
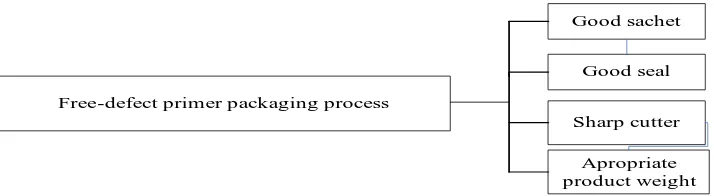
Figure 1. Critical to quality tree
The target of free defect Cranberry drink from primer packaging process is defined based on Figure 1. This target is judged by good sachet, good sealer, sharp cutter and appropriate product weight. Good sachet is defined by no peeled off sachet. Sealer is good whenever the sealer print is neat, form a straight line in vertical and horizontal part, and the inside of the sachet is unseen. The cutter in sachet is claimed sharp if it is a straight line in horizontal part and easy to tear, while product weight is appropriate if sachet is not empty and the weight agree with c weight written in secondary package. Hereafter, the deviation to the four quality characteristics is regarded as defect.
B. Measure
There are two major tollgates in a measurement phase, i.e., the creation of the data collection plan and the implementation of the data collection plan (Eckes, 2003). The steps in this phase are to identify the relevant parameters for measurement, to develop proper data collection plans and to estimate the baseline process performance through the sigma level.
To meet those objectives, we collected the past information in primer packaging process for period of three months by direct observation and interview with the firm owners. They are consumer specification of free defect Cranberry drink, the used of sachet and powder, defect output category, and free defect output.
In the primer packaging process to find the defect, the sachets were inspected visually and also weighted. These outputs were compared to the standard ones, which were determined by the company. Getting this information, we can calculate the sigma levels for regular and urgent items based on DPMO method since the data was discrete (Gasperz, 2002). Sigma performance level calculation is shown on Table 1.
Table 1. Sigma performance level
No Defect category DPMO Sigma
1 Defective sachet 764 3.81
2 Bad seal 719 4.69
3 Blunt cutter 584 4.75
4 Inappropriate weight 3011 4.24
C. Analysis
In this phase, identifying the root causes of the problem and finding out the possible remedies are the main jobs (Das and Roy, 2007). The objectives in this analyzing phase were to identify all possible causes contributing in defect output of primer packaging process, to study the contribution of each significant causes of variation, and to decide which actions are necessary to be done in order to prevent the defects in the primer packaging process, especially to the main defect, i.e., inappropriate weight.
There are three important steps for root cause analysis to be done properly. First is the
brainstorming step. During the phase of root cause analysis, the project team brainstorms all the
possible explanations for current sigma performance. Second is the finest step. During this phase, the project team narrows the list of possible explanations for current sigma performance, and third is the closing step. During this phase, the project team validates the finest list of explanations that explain sigma performance (Eckes, 2002).
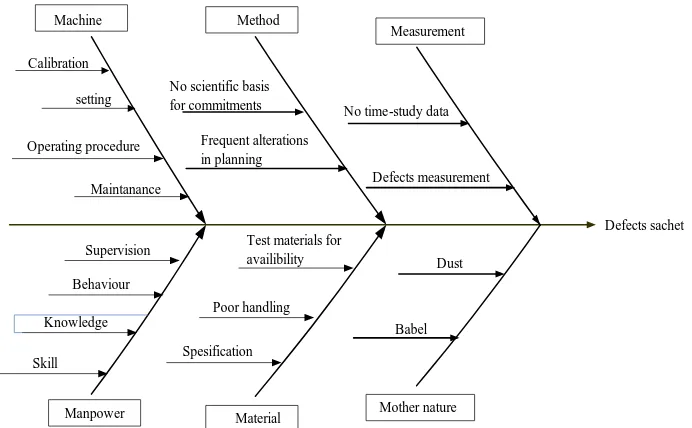
Root cause analysis: brainstorming
At the outset, through a brainstorming session involving all of the team members, a fish-bone diagram was prepared. After rigorous brainstorming, 17 ideas came out as the possible causes of the problem. These initial ideas were shown in Figure 2.
Defects sachet Maintanance
Machine Method
No scientific basis for commitments
Frequent alterations in planning
Manpower Skill
Knowledge Behaviour
Supervision
Material Spesification
Test materials for availibility
Poor handling
No time-study data
Defects measurement Measurement
Mother nature Dust
Babel Calibration
setting
Operating procedure
Figure 2. Cause-Effect diagram of defects sachet
Root cause analysis: finest
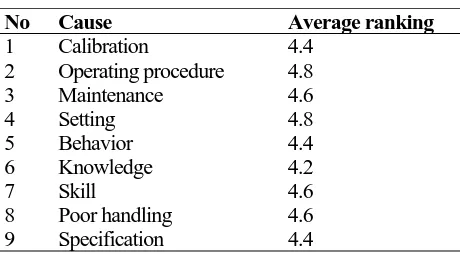
In this stage, multi-voting was done subjectively. Each team members voted, in scale 1-5, to which cause will be the most (scale = 5) and the least probable (scale = 1) root cause of the problem based on their experiences (Desai, 2006).
Table 2. Multi-voting result
No Cause Average ranking
1 Calibration 4.4
2 Operating procedure 4.8
3 Maintenance 4.6
4 Setting 4.8
5 Behavior 4.4
6 Knowledge 4.2
7 Skill 4.6
8 Poor handling 4.6
9 Specification 4.4
Root cause analysis: closing
As a closing step, all of the causes were identified individually through the “Five-Why” technique”. A list of questions was prepared for each cause asking why it occurred and then capturing as many answers as possible for each question. Questions for “Five-Why” technique are: 1. Why does machine calibration do rarely?
2. Why does operators often do wrong machine setting? 3. Why does machine maintenance do periodically?
4. Why do different procedures occur to operate sachet machine? 5. Why did operator behaviors not represent good work?
6. Why do operators have less knowledge for operating sachet machine? 7. Why do operators have low skills?
8. Why is poor handling being done?
9. Why is material specification for primer packaging process not the same?
Answers to the questions of “Five-Why” technique formed the basis for improvement efforts.
D. Improve
The objective of this phase was to work on the root cause identified in the analyzing phase and to eliminate them to achieve the last improvement. The steps involved in this direction are designing improvement plan, choosing priority improvement plan, and drawing improved process.
The actions plan to overcome the problems were determined from the root causes and the answers that emerged from the five-why techniques. For examples, the inadequate supervision and sloppy behavior can be overcome by hiring more supervisors and poor material handling can be solved by providing a material handling training.
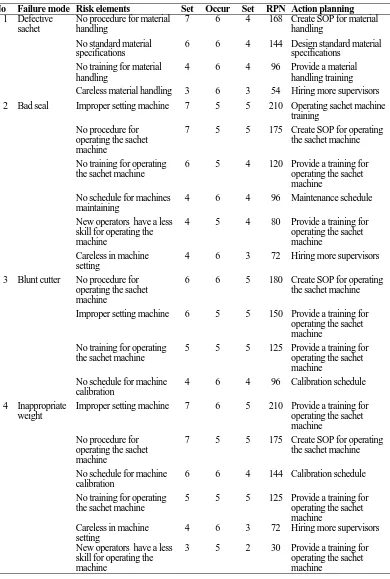
Team member then determined priority of improvement action plan by using Failure Mode and Effects Analysis (FMEA). The risk elements are the causes derived from cause and effect diagram. Each of the risk elements is subjected to a rating 1 to 10 scale on Likelihood of Occurrence, Severity, and Likelihood of Detection, with high numbers being more problematic. The Risk Priority Number (RPN) is calculated as the product of those three scales (Johnson et al., 2006). The result of Failure Mode and Effects Analysis (FMEA) is shown in Table 3.
Table 3. Failure Mode and Effects Analysis (FMEA)
No Failure mode Risk elements Set Occur Set RPN Action planning
1 Defective Careless material handling 3 6 3 54 Hiring more supervisors 2 Bad seal Improper setting machine 7 5 5 210 Operating sachet machine
New operators have a less skill for operating the
New operators have a less skill for operating the machine
After those actions were implemented in primer packaging process, DPMO and sigma level were calculated again to know performance level of primer packaging process. The current sigma performance level is shown in Table 4.
Table 4. Present Sigma Level
No Defect category DPMO Sigma
1 Defective sachet 120 5.2
2 Bad seal 114 5.2
3 Blunt cutter 62 5.3
4 Inappropriate weight 178 5.1
The result showed that there are significant differences between before and after improvement. The sigma level of inappropriate weight increases from 4.2 to 5.1. However, the implementation result was below standard because time available for implementation is relatively short.
E. Control
The control phase establishes the ongoing controls necessary to sustain the benefits from the Six Sigma project. In order to sustain the gain, based on the findings and technical consideration, the following actions are taken by management and the associated personnel of the primer packaging process:
1) Regular checking of output sachets from primer packaging process
2) Continuous checking of sachet machine for cleanlines and working of automatic system 3) Monitoring of calibration and maintenance of sachet machine
4) Awareness program for operators on a regular basis should be carried out for development of process knowledge, skill and motivation
3. CONCLUSION
Quality output variations in primer packaging process are mainly caused by no standard operating procedure for primer packaging process, careless setting of sachet machine and low skill of operator. To improve the capability process of primer packaging process, the creating a standard operating procedure for material handling; training to operate sachet machine, and creating a standard operating procedure for operating sachet machine respectively were setting.
Based on the DMPO and sigma level calculation, the implementation of Six Sigma in primer packaging process is still below standard, however. The firm needs to do continuous training and design standard operating procedure for every step of process production of Cranberry drink.
REFERENCES
Antony, J., and Banuelas, R., 2002. “Key Ingredients for the Effective Implementation of Six Sigma Program.” Measuring Business Excellence Journal, Vol. 6, No. 4, p. 20-27.
Brue, G., 2006. Six Sigma for Small Business, Entrepreneur Media, Madison.
Desai, D.A., 2006. “Improving Customer Delivery Commitments the Six Sigma Way: Case Study of an Indian Small Scale Industry.” International Journal of Six Sigma and Competitive
Advantage, Vol. 2, No. 1, p. 23–47.
Eckes, G., 2003. Six Sigma for Everyone, John Wiley and Sons, New Jersey.
Gasperz, V., 2002. Total Quality Management, PT Gramedia Pustaka Utama, Jakarta.
Gasperz,V., 2007. Lean Six sigma for Manufacturing and Services, PT Gramedia Pustaka Utama, Jakarta.
Goh, T.N., and Xie, M., 2004. “Improving on the Six Sigma Paradigm.” The TQM Magazine, Vol. 16, No. 4, p. 235-240.
Hoerl, R., 2004. “One perspective on the future of Six-Sigma.” International Journal of Six Sigma
and Competitive Advantage, Vol. 1, No. 1, p. 112–119.
Johnson, J. A., Widener, S., Gitlow, H. and Popovich, E., 2006. “A "Six Sigma"© Case Study: G.E.P. Box's Paper Helicopter Experiment-Part B.” Journal of Quality Engineering, Vol. 18, No. 4. p. 431 – 442.
Ladani, L.J., Das, D., Cartwright, J.L., Yenkner, R. and Razmi, J., 2006. “Implementation of Six Sigma Quality System in Celestica with Practical Examples.” International Journal of Six
Sigma and Competitive Advantage, Vol. 2, No. 1, p.69–88.
Man, J., 2002. “Six Sigma: Singapore’s Response to the DMAIC Challenge.” Productivity, Vol. 43,No. 2, p.184–187.