INVESTIGATION OF INFLUENTIAL FACTORS FOR BICYCLE CRASHES USING A
SPATIOTEMPORAL MODEL
G. Gill a , T. Sakrani a , W. Cheng a, *, J. Zhou a
a California State Polytechnic University-Pomona, California, USA (gurdiljotg, tsakrani, wcheng, jiaozhou)@cpp.edu
KEY WORDS: bicycle crashes, spatiotemporal, random parameters, time-varying coefficients, traffic analysis zone, Bayesian
ABSTRACT:
Despite the numerous potential advantages of indulging in bicycling, such as elevation of health and environment along with mitigation of congestion, the cyclists are a vulnerable group of commuters which is exposed to safety risks. This study aims to investigate the explanatory variables at transportation planning level which have a significant impact on the bicycle crashes. To account for the serial changes around the built environment, the linear time trend as well as time-varying coefficients are utilized for the covariates. These model modifications help account for the variations in the environment which may escape the incorporated variables due to lack of robustness in data. Also, to incorporate the interaction of roadway, demographic, and socioeconomic features within a Traffic Analysis Zone (TAZ), with the bicycle crashes of that area, a spatial correlation is integrated. This spatial correlation accounts for the spatially structured random effects which capture the unobserved heterogeneity and add towards building more comprehensive model with relatively precise estimates. Two different age groups, the student population in the TAZs, the presence of arterial roads and bike lanes, were observed to be statistically significant variables related with bicycle crashes. These observations will guide the transportation planning organizations which focus on the entity of TAZ while developing policies. The results of the current study establish a quantifies relationship between the significant factors and the crash count which will enable the planners to choose the most cost-efficient, yet most productive, factors which needs to be addressed for mitigation of crashes.
1. INTRODUCTION
Despite the numerous potential advantages of indulging in bicycling, such as elevation of health and environment along with mitigation of congestion, the cyclists are a vulnerable group of commuters which is exposed to safety risks. In the year 2015, 818 cyclists were killed on US roads while 45,000 were injured (National Highway Traffic Safety Administration, 2017). These statistics present more alarming trends when compared with the total fatalities on roadways as bicycle crashes contributes a 2.3% of total roadway fatalities, which is disproportionally high when considering that only 1% of total trips account for bicycle trips and the vehicle miles travelled are significantly lower than motor vehicles. To realize the goal of safer traffic environment, safety of commuters for all modes of transport is of paramount importance (Cheng et al., 2017). The significance of incorporating multiple user modes of road transport in traffic safety is further catalyzed by the ongoing efforts reflected by Caltrans’ Statewide Highway Safety Plan
and Active Transportation Program. However, insufficient
protective infrastructures or deficiency of efficient tools to evaluate the safety and economic impacts of transport facilities on bicyclists is the main deterrent to such active transportation (Poulos et al., 2015).
Many researchers in the past have explored the bicycle crashes from diverse perspectives in an effort to understand the causal factors. Andersson and Bunketorp (2002) investigated the role played by alcohol consumption on the risk of bicycle driving under different circumstances. This study was distinct from other literature in the fact that it also incorporated the medical and psychosocial complications and observed that intoxicated cyclists suffered greater risk of face and head injury due to relatively less regard for protective headgear and indulged in single vehicle crashes more frequently. The study by Chaurand and Delhomme (2013) explored the road interactions of cyclists and motor vehicles based on the perceived risk by the cyclists. The study hypothesized that the perceived risk for drivers would differ as per the mode of travel and such risk would depreciate with accumulation of driving experience for that mode which would enable them to control the interaction situation better. This hypothesis was validated by the results drawn from the analysis of survey results. Recently, a study by Sanders (2015) on the perceived risk for cyclists noted that cyclists concern of being in physical interaction with a car was a significant barrier to the widespread usage of biking as a mode of travel. Similar results were observed, resembling previous study, which the perceived risk was influential for occasional riders but it decreases with gain in experience. One important highlight of this study was the immense role of “near-miss” crashes that influence the perceived risk for the cyclists. The macro level study by Chowdhury et al. (2012) investigates the impact of spatial correlations in the analysis of pedestrian and bicycle crashes and observed that inclusion of spatial correlation term consistently exhibited better performance and recommended to include such correlation structures at macro level.
This study aims to investigate the explanatory variables at transportation planning level (macro-level) which have a significant impact on the bicycle crashes (Gill et al., 2017). To account for the serial changes around the built environment, the linear time trend as well as time-varying coefficients are utilized for the covariates. These model modifications help account for the variations in the
environment which may escape the incorporated variables due to lack of robustness in data. Also, to incorporate the interaction of roadway, demographic, and socioeconomic features within a Traffic Analysis Zone (TAZ), with the bicycle crashes of that area, a spatial correlation is integrated within the multilevel structure of a crash prediction model. This spatial correlation accounts for the spatially structured random effects which capture the unobserved heterogeneity and add towards building more comprehensive model with relatively precise estimates. It is expected that the inferences drawn from the model estimates of this study will benefit the transportation planners to better understand the underlying causes of bicycle crashes and quantify their impact. This will help in designing effective and efficient transportation policies and more precisely targeted awareness drives during public campaigns to mitigate the bicycle crashes in the urban areas, where around 70% of the total fatal bicycle crashes occur.
2. DATA AND METHODOLOGY
2.1 Data Description
This study analysed the bicycle crashes which occurred in 203 TAZs of city of Irvine, California, during a seven year time period. Various other studies have focused on the TAZs for planning-level analysis of crashes as they have benefits of better homogeneity and easy integration into the transportation planning process (Pulugurtha et al., 2013). The long time period was selected to account for the serial correlations among crash data and explanatory variables, which were selected from planning perspective. Crash data were collected from Statewide Integrated Traffic Records System (SWITRS), and other covariates containing socioeconomic factors, transportation-related information and road environment factors covering the same time period were provided by SCAG (Southern California Association of Governments). Daily Vehicle Miles Travel (DVMT) was incorporated as the traffic exposure factor as it is frequently used by planners as a measure of transport activity. The variables used for model development and the associated descriptive statistics are shown in Table 1. The explanatory variables were the predictors commonly used in previous regional safety analyses which include socioeconomic, transportation-related, and environment-related factors, and so on. As the pedestrian and bicycle crashes are influenced by the presence of sidewalks, crosswalks, bicycle lanes and other factors, some variables were considered which relate with bicycle and pedestrian crashes such as: Bike lane access, Bike lane density, Walk accessibility. These variables integrate different factors to get the indicators for bicycles and pedestrians variables. In addition, the distance matrix containing distances among various TAZ centroids were also collected from SCAG for the estimation of distance-based spatial random effect. Since there are 203 TAZs in the city, the matrix includes 203x202 distances. Their descriptive statistics can be found in Table 1 as well.
Household density % of population age
5-17
8.64% 8.78% 0 27%
% of population age 18-24
5.79% 7.42% 0 40%
% of population age 24-64
38.35% 36.12% 0 95%
% of population age 65 or older
Bike lane access (1=if a TAZ has bike lane)
0.92 0.28 0 1
Bike lane density 3.40 1.80 0 7.26 1=at least one rail
station in a TAZ Express Bus and BRT
0.002 0.007 0 0.06
Notes: Med refers to Median, Min refers to Minimum, Max refers to Maximum, and SD refers to Standard Deviation
Table 1. Descriptive statistics
2.2 Model Development
The traditional approach of developing crash prediction models relies on the assumption that crash counts at concerned belongs to a specific distribution and the estimated crash frequency may be achieved under the Full Bayesian (FB) framework. This study also employs the basic FB approach of generalized linear models where a random error term is also incorporated to account for the overdispersion in crash counts, which allows flexibility to accommodate the deviation from the assumption of Poisson distribution which dictates that mean of crash frequency should be equal to the variance. The spatially structured random effects and incorporated over the generalized overdispersed linear model to account for the spatial correlations among the crashes occurring on sites with close proximity. It is expected that neighboring TAZs will have underlying spatial correlations which influence the crashes but are not accommodated by the explanatory variables. This structural error term is expected to explain the variability of model. To further address the unobserved heterogeneity which escapes the spatially structured error term and the covariates, a linear time trend was added to the covariates which is expected to account for the changes in the environment which took place throughout
the years and also render continuity to the explanatory variables to make them robust, as continuous data at planning level is rarely collected. The univariate spatiotemporal Poisson lognormal model developed in this study was the following formulation: expected crash number, ��� is the traffic exposure for TAZ i
for time period t, X’ is the matrix of risk factors, �� is the vector of model parameters varying with time t,� is the vector of time coefficient varying linearly with t, εijtis the independent random effects, ��� is the spatial error term which is fit by the conditional auto-regressive model (CAR) (Besag, 1974), and τ2 is the variance of the normal distribution for εijt... The inverse of variance is known as precision and it has a gamma prior with prior mean equal to one and its prior variance large (equal to one hundred):
�2−1~�����(0.01, 0.01) (4)
The CAR model has the capability to accommodate the spatial correlations based on different approaches. It accounts for the identity of neighbors, number of neighbors which are considered to be influential on the crash frequency of concerned TAZ, and the amount of weight to be placed depending on the mutual distance between the concerned TAZZ and its neighbors. Various weight structures have been explored in previous studies (Guo et al, 2009; Xu and Huang, 2015) but for spatial analysis in present study, the mutual distance between the centroids of TAZs was considered to develop the weight matrix, which had the following form:
���=�1��
(5)
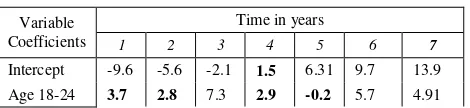
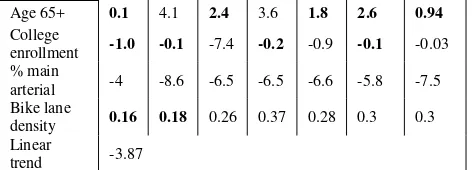
Age 65+ 0.1 4.1 2.4 3.6 1.8 2.6 0.94
Notes: Bold numbers were not significant at 95% confidence interval
Table 2. Modeling results
The spatiotemporal model was developed in the freeware statistical software WinBUGS to generate MCMC (Markov Chain Monte Carlo) samples for Bayesian posterior inferences. A total of 24,000 MCMC iterations were utilized for parameter estimation after discarding first 8,000 iterations as burn-in. The MCMC convergence was ensured by visual inspection of history plots, trace plots, and the sample MC errors were recorded to be less than 5% of the associated standard deviations. As shown in Table 2, the use of spatiotemporal model seems justified as the model was able to catch the changing trends. Except the case of Bike lane density, all the other covariates were observed to be significant for alternative random years. An aggregated model which did not account for the changing temporal trends may not have caught the impact of such changes for most of the explanatory variables. This finding is very important for the transportation planners as it gives them the insight to uncover the underlying cause of bicycle crashes and allocate funds and dedicate the efforts towards the mitigation of that cause which will eventually impact the crash counts. The age of drivers was found to be significantly correlated with a positive influence. It means that the driver population for ages 18-24 and above 65 years were more prone to bicycle crash. Surprisingly, the student population in the colleges of TAZs was negative linked with bicycle crashes. The probable justification may be that the known presence of students influenced the vehicle drivers to be more cautious and drive sensitively. Similar trend was observed for percentage of arterial roads which hints that maybe bicyclists tend to travel less in areas with more arterials and hence are exposed to less risk. Contrary to expectation, the presence of bike lanes positively influenced the bicycle crashes, although the correlation is relatively weak. Possible rationale may be that bicyclists are more encouraged to driver is such areas and greater chances of the exposure of bicyclists to vehicular traffic also increases the risk. Also, the coefficient for the linear trend was also significant with a negative correlation which indicates that time itself should be regarded as a covariate which may help explain the variability and allow greater precision of model estimates which will eventually lead to more meaningful inferences.
4. CONCLUSIONS
This study illustrated the different variables associated with the risk of bicycle crashes. The variables included in the study were from transportation planning and the investigation was done as an effort to understand the broad perspective and achieve a safer driving environment for bicyclists. Two different age groups, the student population in the TAZs, the presence of arterial roads and bike lanes, were observed to be statistically significant variables related
with bicycle crashes. These observations will guide the transportation planning organizations such as Metropolitan Planning Organizations (MPO) in US which focus on the entity of TAZ while developing policies. The results of the current study establish a quantifies relationship between the significant factors and the crash count which will enable the planners to choose the most cost-efficient, yet most productive, factors which needs to be addressed for mitigation of crashes. The future work may be focused on exploration of different modes of travel at a different spatial level. Also, other types of weight matrices for spatial correlations may also be explored such as adjacency-based or pure-distance based developed based on the gravity models which are traditionally applied at planning level in the four-step model.
REFERENCES
Andersson, Anna-Lena, and Olle Bunketorp. "Cycling and alcohol." Injury 33.6 (2002): 467-471.
Besag, Julian. "Spatial interaction and the statistical analysis of lattice systems." Journal of the Royal Statistical Society.
Series B (Methodological) (1974): 192-236.
Chaurand, Nadine, and Patricia Delhomme. "Cyclists and drivers in road interactions: A comparison of perceived crash risk." Accident Analysis & Prevention 50 (2013): 1176-1184.
Cheng, W., Gill, G., and Zhou J. (2017) “Before-and-After Study: Evaluating the Safety Effects of a Through-U-Turn Intersection”. 2017 WDSI Annual Conference Proceedings, Vancouver, Canada
Gill, G. X. Wang, W. Cheng and J. Zhou “Macro-Level Annual Safety Performance Function Evaluation for Cities, Counties and State of California”. (2017) WDSI Annual Conference Proceedings, Vancouver, Canada
Guo, Feng, Xuesong Wang, and Mohamed A. Abdel-Aty. "Corridor-Level Signalized Intersection Safety Analysis Using Bayesian Spatial Models." Transportation Research
Board 88th Annual Meeting. No. 09-1163. 2009.
National Highway Traffic Safety Administration, 2017. Traffic Safety Facts,
https://crashstats.nhtsa.dot.gov/Api/Public/ViewPublication/ 812382 (retrieved 3.31.2017).
Poulos, R. G., et al. "Characteristics, cycling patterns, and crash and injury experiences at baseline of a cohort of transport and recreational cyclists in New South Wales, Australia." Accident Analysis & Prevention 78 (2015): 155-164.
Pulugurtha, Srinivas S., Venkata Ramana Duddu, and Yashaswi Kotagiri. "Traffic analysis zone level crash estimation models based on land use characteristics." Accident Analysis & Prevention 50 (2013): 678-687.
Sanders, Rebecca L. "Perceived traffic risk for cyclists: The impact of near miss and collision experiences." Accident
Siddiqui, Chowdhury, Mohamed Abdel-Aty, and Keechoo Choi. "Macroscopic spatial analysis of pedestrian and bicycle crashes." Accident Analysis & Prevention 45 (2012): 382-391.