TREE SPECIES RECOGNITION IN SPECIES RICH AREA USING UAV-BORNE
HYPERSPECTRAL IMAGERY AND STEREO-PHOTOGRAMMETRIC POINT CLOUD
S. Tuominena,*, R. Näsib, E. Honkavaarab, A. Balazsa, T. Hakalab, N. Viljanenb, I. Pölönenc, H. Saarid, J. Reinikainene
a Natural Resources Institute Finland, PL 2, 00791 Helsinki, Finland – (sakari.tuominen, andras.balazs)@luke.fi b Finnish Geospatial Research Institute, National Land Survey of Finland, Geodeetinrinne 2, 02430 Masala – (roope.nasi,
eija.honkavaara teemu.hakala, niko.viljanen)@maanmittauslaitos.fi
c Department of Mathematical Information Tech., University of Jyväskylä, P.O. Box 35, FI-40014 Jyväskylä - [email protected] d VTT Microelectronics, P.O. Box 1000, FI-02044 VTT, Finland - [email protected]
e Mustila Arboretum, Mustilantie 57, FI-47200 Elimäki, Finland - [email protected]
Commission VI, WG III/4
KEY WORDS: Hyperspectral imaging, UAVs, Stereo-photogrammetry, Photogrammetric point cloud, Tree species recognition
ABSTRACT:
Recognition of tree species and geospatial information of tree species composition is essential for forest management. In this study we test tree species recognition using hyperspectral imagery from VNIR and SWIR camera sensors in combination with 3D photogrammetric canopy surface model based on RGB camera stereo-imagery. An arboretum forest with a high number of tree species was used as a test area. The imagery was acquired from the test area using UAV-borne cameras. Hyperspectral imagery was calibrated for providing a radiometrically corrected reflectance mosaic, which was tested along with the original uncalibrated imagery. Alternative estimators were tested for predicting tree species and genus, as well as for selecting an optimal set of remote sensing features for this task. All tested estimators gave similar trend in the results: the calibrated reflectance values performed better in predicting tree species and genus compared to uncorrected hyperspectral pixel values. Furthermore, the combination of VNIR, SWIR and 3D features performed better than any of the data sets individually, with calibrated reflectances and original pixel values alike. The highest proportion of correctly classified trees was achieved using calibrated reflectance features from VNIR and SWIR imagery together with 3D point cloud features: 0.823 for tree species and 0.869 for tree genus.
1. INTRODUCTION
Recognition of tree species and acquisition of geospatial information of tree species composition is essential in forest management, as well as in the management of other wooded habitats. In forest management, information of tree species dominance or species composition is needed for, e.g., the estimation of woody biomass and growing stock and the estimation of the monetary value of the forest (e.g. Laasasenaho, 1982; Repola, 2009, 2008). Furthermore, information of tree species is needed for designing appropriate silvicultural treatments for stands or individual trees and for forecasting future yield and cutting potential (e.g. Hynynen et al., 2005). For assessing non-timber forest resources such as biodiversity or mapping wildlife habitats knowledge of the tree species is equally essential (e.g. Fassnacht et al., 2016). Traditionally forest inventory methods based on the utilization of remote sensing data have used forest stands or sample plots as inventory units, when estimating forest variables such as the amount of biomass of volume of growing stock, as well as averaged variables such as stand age or height. However, stand level forest variables typically are an average or a sum from a set of trees, of which the stand or sample plot are composed, and certain amount of information is lost even when aiming at ecologically homogeneous inventory units. In the calculation forest inventory variables such as volume and biomass of the growing stock, tree level models are typically used nowadays (e.g. Laasasenaho, 1982; Repola, 2009, 2008). Very high
resolution remote sensing data allows moving from stand level to the level of individual trees (e.g. Ørka et al., 2009), which has certain benefits, for example in precision forestry, forest managements planning, biomass estimation and modelling forest growth (Koch et al., 2006).
Forest and tree species classification using multi- or hyperspectral imaging or laser scanning has been widely studied (Korpela et al., 2014; Leckie et al., 2005; Packalén et al., 2009). However, the data has mainly been captured from manned aircrafts or satellites, wherefore studies have been focusing more on forest or plot level. Laser scanning, both discrete and full-waveform, has been used to classify trees in boreal forests (Brandtberg et al., 2003; Holmgren and Persson, 2004; Maltamo et al., 2004; Yu et al., 2014; Ørka et al., 2007). Most demanding task using passive imaging systems has always been in discriminating different conifers due to their spectral similarity. However, structural data from laser scanning has shown to be able to capture the structural differences of these species, such as the vertical extent of the leafy canopy (Yu et al., 2014).
et al., 2010; St‐Onge et al., 2008. Photogrammetric point clouds produce accurate top-of-the-canopy information that enables the computation of Canopy Height Models (CHM) (e.g. Baltsavias et al., 2008) and thus detection of individual trees. However, the notable limitation of photogrammetric point clouds compared to laser scanning is that passive imaging does not have good penetration ability, especially with aerial data from manned aircrafts. Thus, laser scanning which can penetrate forest canopies deeper has been the main method to provide information on forest structure. Photogrammetric point clouds derived from data captured using manned aircrafts have been used but the spatial resolution is not usually accurate enough to produce good detection results.
The use of UAVs in aerial imaging has enabled aerial measurements with very high spatial resolution and improving the resolution of photogrammetric point clouds from forest. The development of light-weight hyperspectral frame cameras has enabled measurement of high spectral resolution data from UAVs (Colomina and Molina, 2014). One of the recent innovations are hyperspectral cameras operating in the 2D frame format principle (Aasen et al., 2015; Honkavaara et al., 2013; Mäkynen et al., 2011; Saari et al., 2011). These sensors give a possibility to very high spatial resolution hyperspectral images and 3D data analysis thus giving very detailed spectral information of tree canopies.
Some studies have used data of UAV-borne sensors in individual tree detection with excellent results (e.g. Zarco-Tejada et al., 2014). Tree species classification from UAV data has not been widely studied, especially with simultaneous individual tree detection. Näsi et al. (2015) used UAV-based hyperspectral data in individual tree scale to study damage caused by bark beetles. Previously, Nevalainen et al. (2017) have studied individual tree detection and species classification in boreal forest using UAV-borne photogrammetric point clouds and hyperspectral image mosaics.
Novel hyperspectral imaging technology based on a variable air gap Fabry-Pérot interferometer (FPI) was used in this study. The first prototypes of the FPI-based cameras were operating in the visible to near-infrared spectral range (500-900 nm; VNIR) (Honkavaara et al., 2013; Mäkynen et al., 2011; Saari et al., 2011). The FPI can be easily mounted on a small UAV together with RGB camera which enables the simultaneous hyperspectral imaging with high spatial resolution photogrammetric point cloud creation.
The objective of this study is to investigate the use of high resolution photogrammetric point clouds together with two novel hyperspectral cameras in VNIR and SWIR spectral ranges in individual tree detection and classification in arboretum with large numbers of tree species. The importance of different spectral and structural features in tree species classification in complex environment will be investigated.
2. MATERIALS AND METHODS
2.1 Study area and field data
Mustila Arboretum located in the municipality of Kouvola in South-Eastern Finland (60°44′N, 26°25′E) was used as the study area. The area was selected for this study because it has
exceptionally large variation of tree species, mainly originating from different parts of boreal and temperate zones of Northern hemisphere, nearly 100 conifer species and more than 200 broad-leaved tree species have been planted there. The arboretum is over 100 years old, so a large number of full-grown trees of various species occur in the area.
The total size of the arboretum is approx. 100 ha, and for this study an area of approx. 50 ha was covered by hyperspectral imagery. The covered areas were selected on the basis of their tree species composition, specially targeting areas where trees compose homogeneous stands or tree groups, as well as tree species of silvicultural importance. Bushes, young trees and trees belonging to species that do not achieve full size at maturity due to poor adaptation to Finnish conditions were excluded from the study. Furthermore trees with canopies that were shadowed by or intermingled with other tree species were not included in the test material either. 47 test stands representing 26 different tree species and 14 tree genera were selected, delineated and examined in the field from the area covered by imagery. Test trees were mapped in the field using GPS and very high resolution RGB imagery acquired by UAV-borne camera. GPS was used for positioning the trees in the orthorectified RGB mosaic. In total 673 tree crowns were delineated in the test stands. The delineated trees include a number of intermingled tree canopies (of same species) that cannot be discriminated from the images. The list of tree species represented among the test trees is presented in Table 1.
This contribution has been peer-reviewed.
Ulmus glabra 5
total 673
2.2 Remote sensing data
2.2.1 FPI hyperspectral cameras: Two novel FPI-based hyperspectral cameras were used in the study. One was operating in the visible and near-infrared spectral range (VNIR; 400 to 1000 nm) and another one operated in the shortwave infrared (SWIR) range (1100-1600 nm). The FPI technology is based on the fact that the wavelength of the light passing the FPI is a function of the interferometer air gap. By changing the air gap, it is possible to acquire a new set of wavelengths. The final spectral response is dependent on the light passing the FPI and the spectral characteristics of the detector. The spectral bands can be selected according to the requirements of the remote sensing task.
The VNIR FPI-camera is the first snapshot hyperspectral camera that is able to cover the entire VNIR range of 400-1000 nm. The camera was developed jointly by the VTT Technical 1010 × 1010 pixels with a pixel size of 5.5 μm. The frame rate is typically 30 frames/s with 15 ms exposure time for 1010 × 648 pixel image size. A maximum of 36 spectral bands can be selected with ±1 nm spectral resolution. The camera is equipped with custom optics having a focal length of 9.0 mm and an f-number of approximately 2.8. The maximum field of view (FOV) is ±18.5° in the flight direction and same ±18.5° in the cross-flight direction. The camera weighs about 720 g without battery.
The SWIR camera consists of the commercial InGaAs camera - the Xenics Bobcat-1.7-320, the imaging optics, the FPI and electronics are designed and built at VTT. The focal length of the optics is 12.2 mm and the f-number is 3.2; the FOV is ±13° in the flight direction, ±15.5° in the cross-flight direction, and ±20° at the format corner. The time between adjacent exposures is 10 ms plus exposure time; capturing single data cube with 32 bands and using 2 ms exposure time takes 0.384 s. The mass of the spectral imager unit is approximately 1200 g.
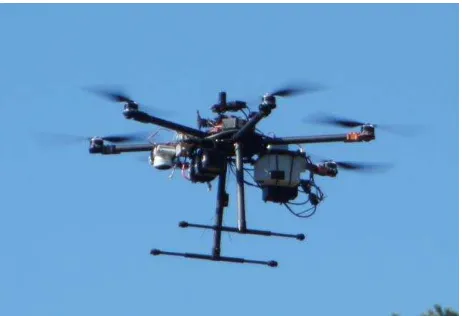
2.2.2. Remote sensing data acquisition: The UAV platform was a hexacopter with Tarot 960 foldable frame (Figure 1) belonging to the Finnish Geospatial Research Institute (FGI). The autopilot was Pixhawk equipped with Arducopter 3.15 firmware. Payload of the system is 3-4 kg and flight time 15-30 min depending on payload, battery and conditions.
The FPI cameras described above were the main payload in the UAV. The spectral settings of the VNIR and SWIR cameras were selected so that the spectral range was covered quite evenly (Table 2). A total of 32 spectral bands were collected by the SWIR camera in the spectral range 1100-1600 nm with the full width of half maximum (FWHM) ranging from 20 to 30
nm and with an exposure time of 2 ms. With the VNIR camera, 36 bands were collected on a spectral range of 409 nm to 973 nm with a FWHM of 10-15 nm and an exposure time of 30 ms. In addition, we used also RGB camera (Samsung NX 300) for capturing high spatial resolution stereoscopic images that were used for producing 3D object model using dense image matching techniques.
The ground station was composed of reference panels with a size of 1 m × 1 m and nominal reflectance of 0.03, 0.09 and 0.50 for determining the reflectance transformation, and equipment for irradiance measurements. We also deployed in each area 4-8 ground control points (GCPs) measured with GPS and targeted with circular targets with a diameter of 30 cm.
The flight campaign was carried out in September 2015 in four areas of interest. The flying speed was 4 m/s. The flying height was 120 m at the starting position, but due to the terrain height variations and the canopy heights, the distances from the object were 70 m at smallest. Depending on the UAV to object distance (70-120 m) the GSDs were 0.015 - 0.03 m, 0.04 - 0.08 m, and 0.11 - 0.20 m for the RGB, VNIR and SWIR cameras, respectively (Table 2). In all the blocks, the distance between flight lines was 30 m.
Figure 1. The UAV and the instrumentation (RGG+VNIR HS sensors) used in the UAV measurements
VNIR L0 (nm): 408.69, 419.50, 429.94, 440.71, 449.62,
VNIR FWHM (nm): 12.00, 14.58, 13.64, 14.12, 12.41, 13.05, 12.66, 12.42, 12.10, 13.52, 12.62, 12.87, 12.72, 12.50, 12.24, 12.34, 11.57, 11.98, 11.45, 10.26, 11.61, 14.31, 11.10, 13.97, 13.79, 13.49, 13.62, 13.20, 12.95, 12.97, 12.66, 13.18, 12.35, 12.74, 12.59, 10.11
SWIR L0 (nm): 1154.10, 1168.58, 1183.68, 1199.22, 1214.28, 1228.18, 1245.71, 1261.22, 1281.65, 1298.55, 1312.93, 1330.66, 1347.22, 1363.18, 1378.69, 1396.72, 1408.07, 1426.26, 1438.52, 1452.60, 1466.99, 1479.35, 1491.84, 1503.81, 1516.66, 1529.30, 1541.57, 1553.25, 1565.48, 1575.53, 1581.87, 1578.26
SWIR FWHM (nm): 27.04, 26.98, 26.48, 26.05, 26.73,
This contribution has been peer-reviewed.
26.98, 26.36, 26.30, 26.17, 26.54, 26.60, 25.80, 25.80, 25.62, 26.54, 27.35, 26.85, 28.15, 27.22, 27.10, 28.58, 27.65, 27.90, 27.22, 28.83, 28.52, 28.89, 29.75, 30.43, 27.47, 20.49, 20.06 Table 2. Spectral settings of the FPI VNIR and SWIR cameras.
2.3 Processing of image data
Objectives of the data processing were to generate dense point clouds using the RGB image blocks and to calculate image mosaics of the hyperspectral data sets. The processing chain used in this study is based on the methods developed by Honkavaara et al. (2013, 2016) and Nevalainen et al. (2017), In the following sections, the geometric and radiometric processing steps are described. The procedure for classification is presented in Section 2.4.
2.3.1 Geometric processing: Geometric processing determined the interior and exterior orientations of the images (IOP and EOP) and created sparse and dense point clouds. Because the calculating orientation of each band of the FPI data cube in the bundle block adjustment would be computationally heavy (68 bands in this study), we have developed an approach that determines the orientations of selected reference bands using the block adjustment and optimizes orientations of remaining bands to these reference bands (Honkavaara et al., 2016). Agisoft PhotoScan Professional (www.agisoft.com) software was used to determine the IOPs and EOPs of the reference bands and to create dense and sparse point clouds. Four VNIR reference bands and the RGB images were processed simultaneously; in the case of SWIR data, five SWIR bands were processed. The data set was georeferenced using 4-8 GCPs in each area. A dense point cloud was calculated using only RGB images to acquire highest density and resolution. Finally, orientations of the bands that were not processed by PhotoScan were optimized to fit to reference bands.
The block adjustments showed accurate results with re-projection errors of approximately 0.2–0.5 pixels. The point densities were approximately 320 points per m2 for every block.
2.3.2 Radiometric processing: The objective of the radiometric correction was to provide spectrally high quality reflectance mosaics. The radiometric modelling approach developed at the FGI included the sensor corrections, the atmospheric correction, correction for the illumination changes and other nonuniformities, and the normalization of illumination and viewing direction related nonuniformities (Honkavaara et al., 2013).
The sensor corrections for the FPI images included spectral correction, photon response nonuniformity correction (PRNU) and dark signal correction (Honkavaara et al., 2013; Mäkynen et al., 2011).
The reflectance transformation from uncalibrated digital numbers of pixels (DN) to reflectance was carried out using the empirical line method (Smith and Milton, 1999) with the aid of the reflectance panels in the area. For the SWIR images, all reference panels were used (nominal reflectance 0.03, 0.10 and 0.5). For the VNIR images, the brightest panel was not used because it was saturated in most of the bands. Other radiometric corrections were not performed because the imaging conditions were uniform during the data capture. The orthophoto mosaics were calculated with a GSD of 20 cm using the FGI’s radiometric block adjustment and mosaicking software (Honkavaara et al., 2013). Eight bands in the SWIR
data (range 1360-1470 nm) were useless because of low level of signal due to the strong water absorption in this spectral range. Reflectance mosaics were radiometrically uniform as expected because the illumination conditions were stable. 2.4 Extraction of remote sensing features
Remote sensing features were extracted from delineated polygons corresponding to the canopies of test trees in the study area. The CHM was applied in the extraction process to ensure that the spectral features of the hyperspectral VNIR and SWIR imagery were extracted from the crowns of the test trees and to exclude the influence of the ground vegetation and shrubs to the image features. Pixels whose altitude was less than 5 m from the terrain were excluded from the calculation of the spectral features.
The hyperspectral features were extracted from the following data sets:
36 VNIR and 24 SWIR spectral bands with both DN and reflectance values
The first 9 and 12 principal components calculated from VNIR and SWIR DN bands respectively
The first 17 and 15 principal components calculated from VNIR and SWIR reflectance bands respectively
The following spectral features were extracted from the data sets listed above:
Spectral averages (AVG)
Standard deviations (STD)
Spectral averages (AVG50) of the brightest 50 % of pixel values
Spectral averages (AVG25) of the brightest 25 % of pixel values
The following features were extracted from photogrammetric (XYZ format) 3D point data (Næsset, 2004; Packalen and Maltamo, 2006, 2008):
H where percentages of vegetation points (0%, 5%, 10%, 20%, …, 80%, 85%,90%, 95%, 100%) were accumulated [m] (e.g. H0, H05,...,H95, H100)
Canopy densities corresponding to the proportions points above fraction no. 0, 1, …, 9 to total number of points (D0, D1, …, D9)
Proportion of vegetation points having H greater or equal to corresponding percentile of H (i.e. P20 is the proportion of points having H>= H20) (%)
H = height above ground; vegetation point = point with H > = 2 m, the range of H was divided into 10 fractions (0, 1, 2,…, 9) of equal distance
2.5 Tree species estimation and validation
2.5.1 K nearest neighbors and genetic algorithm: In the k nearest neighbors method (k-nn) the Euclidean distances between the test trees were calculated in the n-dimensional feature space, where n stands for the number of remote sensing features used. The tree species and genus were estimated for each test tree as the statistical mode of the nearest neighbors. Different values of k were tested in the estimation procedure. The selection of the features (as well as the optimal value of k) was performed with a genetic algorithm (GA) -based approach, implemented in the R language by means of the Genalg
This contribution has been peer-reviewed.
package (Willighagen and Ballings 2015; R Development Core Team 2016). This approach searches for the subset of predictor variables based on criteria defined by the user. Here the evaluation function of the genetic algorithm was employed to maximize the percentage of correct classifications in cross-validating the tree species classifications; i.e. each test tree was classified independently of its’ observed value, and the predicted class was compared to the observed class.
The accuracy of the tree species estimation was tested by calculating error matrices (e.g. Campbell and Wynne, 1987) of the tested classifications. The error matrix presents the error of omission (observations belonging to a certain category and erroneously classified in another category), error of commission (observations erroneously classified in a certain category while belonging to another), proportion of observations classified correctly and kappa (κ) value.
2.5.2 Random Forest method: As an alternative to the approach based on k-nn+GA, Random Forest (RF) method was tested in tree species classification. RF is based on growing multiple decision trees. A decision tree is used to create a model that predicts the value of a target variable based on a set of input variables. Target variables are tree species and genera, input variables are the features extracted from the hyperspectral and 3D data sets. Each internal node in a tree corresponds to a test on one of the features. Each branch represents a series of tests and at the end of each branch the terminal node represents the outcome of the tests, a value for the target variable. The tree is voting for the mode of all the values at the terminal nodes. In case of equal amounts of values the final estimate is selected randomly (Stephens, 2014).
Single decision trees are however prone to overfitting but by growing an adequate number of trees this disadvantage can be eliminated or minimized. In order to be able to grow different decision trees some source of randomness is required. The first is to randomly subsample the training data. The second is to subset the amount of features used for each node in each decision tree (Stephens, 2014).
Data analysis was carried out using the RF package in R statistical software. After several test runs the default amount of 500 trees to be grown for each data set (see section 2.4) was found to be suitable. At each node a random set of features were used. The optimal sample size of features for each data set was selected by test runs with sample sizes varying from 10 to 70 with an increment of 5. Subsampling of the training data was done with replacement and the size of subsample equaled the size of the training data. 100 runs were carried out with each data set and the best preforming model was selected. The fitness of the model was assessed by the overall accuracy of the target variables (tree species, genera).
3. RESULTS
Of the tested feature selection methods, k-nn+GA gave consistently better results than the RF method in selecting feature sets for predicting tree species and genus. GA + k-nn performed better with all tested data combinations: SWIR, VNIR. Compared to RF, k-nn+GA resulted in 4-7% higher proportions of correct classifications for tree species and 2-5% for tree genus.
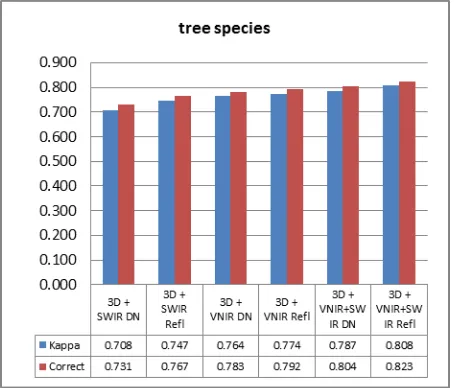
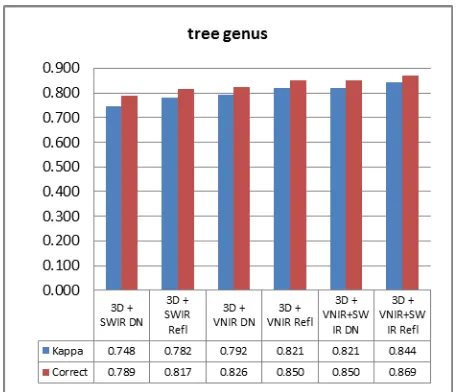
In general, using calibrated reflectance features resulted in higher proportion of correct classifications than using uncalibrated DN bands of hyperspectral imagery. When using VNIR bands the improvement with calibrated reflectances was 1% for tree species and 3% compared to uncalibrated DNs. With SWIR bands improvement was 5% and 4% for species and genus respectively. When using both VNIR and SWIR the improvement was 2% for both species and genus prediction. Of the tested data combinations with reflectance bands, SWIR bands + 3D features were the poorest performing data set, proportion of correct classifications was 0.767 for tree species and 0.817 for genus. Using VNIR bands instead of SWIR generally improved the accuracy of tree species estimation, the proportion of correct classifications was 0.792 for tree species and 0.850 for genus. However, the combination containing SWIR+VNIR reflectance bands with 3D features resulted in better tree species estimation than any other data set; the proportion of correct classifications was 0.823 for tree species and 0.869 for genus.
In the tested classifications the kappa (κ) value was between 0.71 - 0.81 for tree species, and 0.75 - 0.84 for genus, which indicates either substantial or almost perfect agreement (Campbell and Wynne, 1987).
The accuracy of classifications based on the tested data combinations (using k-nn+GA as estimator) is presented in Figure 2 (results per tree species) and Figure 3 (results per tree genus). Furthermore, the full confusion matrix of tree genus classification using k-nn+GA estimator and data combination VNIR+SWIR+3D is presented in Appendix, presenting the classification in each genus class, including the user’s and producer’s accuracy for the classes.
Figure 3. Results of tree genus classification (kappa + proportion of correct predictions)
4. DISCUSSION
In Finland, the operational forest inventory method for providing information for forest management in based on airborne laser scanning and digital photography. The list of forest variables specified for forest management data includes the volumes per tree species strata (pine, spruce and broadleaved trees), and the general weakness of the method is considered to be its’ ability to predict the proportions of these strata accurately (e.g. Packalén and Maltamo 2006, Tuominen et al. 2014).
The results of this study showed that combination of hyperspectral imagery and photogrammetric 3D point cloud data is very promising method for tree species recognition. In this study we used high resolution imaging from low flying altitude using UAV-based sensors, and tested species and genus classification at individual tree level. Currently, this method is not operationally feasible remote sensing method for forest management purposes. However, a sensor package covering similar band combinations could be applied also for large area forest inventories using area-based estimation method (i.e. estimating forest characteristics at forest stand or plot level).
Inclusion of 3D information from point cloud data improved the tree species recognition, despite the high radiometric resolution (and high number of bands) of the VNIR+SWIR imagery. In operational forest inventories the significance of 3D data is even higher, since there are typically other estimated variables of interest, such as volume of growing stock/biomass, stand mean diameter and mean/dominant height, where 3D data typically performs better than spectral image information (e.g Tuominen et al. 2017).
The combination of hyperspectral bands and 3D point cloud features, possibly even supplemented by textural features or multi-band transformations result in very high number of potential remote sensing features. Estimation or classification task in such a hyper-dimensional feature space differs greatly from traditional Landsat satellite image or conventional aerial
image–based classification in complexity, and dealing with hyper-dimensional feature space requires appropriate tools for finding an optimal set of features for the estimation or classification task, such as those tested in this study.
When using spectral information from aerial imagery acquired under changing solar illumination conditions, it is logical that calibrated imagery performs better than uncalibrated imagery, and although the effect of image calibration was as expected, the difference in results was relatively small. This may be due to the fact that the point cloud data requiring no calibration was among the tested feature sets. It is presumable, that 3D point data is significant in recognizing canopy shape and thus, in distinguishing trees of different species and especially genus. In further studies, the influence of point cloud data should examined by testing classifications with and without it.
REFERENCES
Aasen, H., Burkart, A., Bolten, A., Bareth, G., 2015. Generating 3D hyperspectral information with lightweight UAV snapshot cameras for vegetation monitoring: From camera calibration to quality assurance. ISPRS J. Photogramm. Remote Sens. 108, 245–259.
Baltsavias, E., Gruen, A., Eisenbeiss, H., Zhang, L., Waser, L.T., 2008. High‐quality image matching and automated generation of 3D tree models. Int. J. Remote Sens. 29, 1243– 1259.
Brandtberg, T., Warner, T.A., Landenberger, R.E., McGraw, J.B., 2003. Detection and analysis of individual leaf-off tree crowns in small footprint, high sampling density lidar data from the eastern deciduous forest in North America. Remote Sens. Environ. 85, 290–303.
Büttner, A., Röser, H.-P., 2014. Hyperspectral Remote Sensing with the UAS ‘Stuttgarter Adler’ – System Setup, Calibration and First Results. Photogramm. - Fernerkundung - Geoinf. 2014, 265–274.
Campbell, J.B., Wynne, R.H., 1987. Introduction to remote sensing. Guilford Press, New York, NY, USA.
Colomina, I., Molina, P., 2014. Unmanned aerial systems for photogrammetry and remote sensing: A review. ISPRS J. Photogramm. Remote Sens. Vol. 92, 79-97
de Oliveira, R.A., Tommaselli, A.M.G., Honkavaara, E., 2016. Geometric Calibration of a Hyperspectral Frame Camera. Photogramm. Rec. 31, 325–347.
Fassnacht, F.E., Latifi, H., Stereńczak, K., Modzelewska, A., Lefsky, M., Waser, L.T., Straub, C., Ghosh, A., 2016. Review of studies on tree species classification from remotely sensed data. Remote Sens. Environ. 186, 64–87.
Haala, N., Hastedt, H., Wolf, K., Ressl, C., Baltrusch, S., 2010. Digital Photogrammetric Camera Evaluation – Generation of Digital Elevation Models. Photogramm. - Fernerkundung - Geoinf. 2010, 99–115.
This contribution has been peer-reviewed.
Holmgren, J., Persson, Å., 2004. Identifying species of individual trees using airborne laser scanner. Remote Sens. Environ. 90, 415–423.
Honkavaara, E., Saari, H., Kaivosoja, J., Pölönen, I., Hakala, T., Litkey, P., Mäkynen, J., Pesonen, L., 2013. Processing and Assessment of Spectrometric, Stereoscopic Imagery Collected Using a Lightweight UAV Spectral Camera for Precision Agriculture. Remote Sens. 5, 5006–5039.
Honkavaara, E., Eskelinen, M.A., Polonen, I., Saari, H., Ojanen, H., Mannila, R., Holmlund, C., Hakala, T., Litkey, P., Rosnell, T., Viljanen, N., Pulkkanen, M., 2016. Remote sensing of 3-D geometry and surface moisture of a peat production area using hyperspectral frame cameras in visible to short-wave infrared spectral ranges onboard a small unmanned airborne vehicle (UAV). IEEE Trans. Geosci. Remote Sens. 54, 5440–5454.
Hruska, R., Mitchell, J., Anderson, M., Glenn, N.F., 2012. Radiometric and geometric analysis of hyperspectral imagery acquired from an unmanned aerial vehicle. Remote Sens. 4, 2736–2752.
Hynynen, J., Ahtikoski, A., Siitonen, J., Sievänen, R., Liski, J., 2005. Applying the MOTTI simulator to analyse the effects of alternative management schedules on timber and non-timber production. Forest Ecology and Management 207,. 5–18. Koch, B., Heyder, U., Weinacker, H., 2006. Detection of Individual Tree Crowns in Airborne Lidar Data. Photogramm. Eng. Remote Sens. 72, 357–363
Korpela, I., Mehtätalo, L., Markelin, L., Seppänen, A., Kangas, A., 2014. Tree species identification in aerial image data using directional reflectance signatures. Silva Fenn. 48. Laasasenaho, J., 1982. Taper curve and volume functions for pine, spruce and birch. Commun. Instituti For. Fenn. 108, 1– 74.
Leckie, D.G., Gougeon, F.A., Tinis, S., Nelson, T., Burnett, C.N., Paradine, D., 2005. Automated tree recognition in old growth conifer stands with high resolution digital imagery. Remote Sens. Environ. 94, 311–326.
Lucieer, A., Malenovský, Z., Veness, T., Wallace, L., 2014. HyperUAS - Imaging spectroscopy from a multirotor unmanned aircraft system. J. F. Robot. 31, 571–590.
Maltamo, M., Eerikäinen, K., Pitkänen, J., Hyyppä, J., Vehmas, M., 2004. Estimation of timber volume and stem density based on scanning laser altimetry and expected tree size distribution functions. Remote Sens. Environ. 90, 319– 330.
Mannila, R., Holmlund, C., Ojanen, H.J., Näsilä, A., Saari, H., 2014. Short-wave infrared (SWIR) spectral imager based on Fabry-Perot interferometer for remote sensing, in: Meynart, R., Neeck, S.P., Shimoda, H. (Eds.), Proc. SPIE. p. 92411M. Mäkynen, J., Holmlund, C., Saari, H., Ojala, K., Antila, T., 2011. Unmanned aerial vehicle (UAV) operated megapixel spectral camera. Proc. SPIE 8186, 81860Y.
Nevalainen, O.; Honkavaara, E.; Tuominen, S.; Viljanen, N.; Hakala, T.; Yu, X.; Hyyppä, J.; Saari, H.; Pölönen, I.; Imai, N.N.; Tommaselli, A.M.G. 2017. Individual Tree Detection and Classification with UAV-Based Photogrammetric Point Clouds and Hyperspectral Imaging. Remote Sens., 9, 185. Näsi, R., Honkavaara, E., Lyytikäinen-Saarenmaa, P., Blomqvist, M., Litkey, P., Hakala, T., Viljanen, N., Kantola, T., Tanhuanpää, T., Holopainen, M., 2015. Using UAV-based photogrammetry and hyperspectral imaging for mapping bark beetle damage at tree-level. Remote Sens. 7, 15467–15493. Næsset, E., 2004. Practical large-scale forest stand inventory using a small-footprint airborne scanning laser. Scand. J. For. Res. 19, 164–179.
Packalen, P., Maltamo, M., 2006. Predicting the Plot Volume by Tree Species Using Airborne Laser Scanning and Aerial Photographs. For. Sci. 52, 611–622.
Packalén, P., Maltamo, M., 2008. Estimation of species-specific diameter distributions using airborne laser scanning and aerial photographs. Can. J. For. Res. 38, 1750–1760. Packalén, P., Suvanto, A., Maltamo, M., 2009. A Two Stage Method to Estimate Species-specific Growing Stock. Photogramm. Eng. Remote Sens. 75, 1451–1460.
R Development Core Team, 2016. R: A Language and Environment for Statistical Computing.
Repola, J., 2008. Biomass equations for birch in Finland. Silva Fenn. 42, 605–624.
Repola, J., 2009. Biomass equations for Scots pine and Norway spruce in Finland. Silva Fenn. 43, 625–647.
Saari, H., Pellikka, I., Pesonen, L., Tuominen, S., Heikkilä, J., Holmlund, C., Mäkynen, J., Ojala, K., Antila, T., 2011. Unmanned Aerial Vehicle (UAV) operated spectral camera system for forest and agriculture applications, in: Neale, C.M.U., Maltese, A. (Eds.), Proceedings of SPIE. International Society for Optics and Photonics, Prague, p. 81740H.
St-Onge, B., Vega, C., Fournier, R.A., Hu, Y., 2008. Mapping canopy height using a combination of digital
Tuominen S., Pitkänen J., Balazs A., Korhonen K. T., Hyvönen P., Muinonen E. 2014. NFI plots as complementary reference data in forest inventory based on airborne laser scanning and aerial photography in Finland. Silva Fennica 48(2): 19. Tuominen S., Pitkänen T., Balazs A., Kangas A. (2017). Improving Finnish Multi-Source National Forest Inventory by 3D aerial imaging. Silva Fennica vol. 51, 4.
Yu, X., Litkey, P., Hyyppä, J., Holopainen, M., Vastaranta, M., 2014. Assessment of Low Density Full-Waveform Airborne Laser Scanning for Individual Tree Detection and Tree Species Classification. Forests 5, 1011–1031.
Zarco-Tejada, P.J., González-Dugo, V., Berni, J.A.J., 2012. Fluorescence, temperature and narrow-band indices acquired from a UAV platform for water stress detection using a micro-hyperspectral imager and a thermal camera. Remote Sens. Environ. 117, 322–337.
Zarco-Tejada, P.J., Diaz-Varela, R., Angileri, V., Loudjani, P., 2014. Tree height quantification using very high resolution imagery acquired from an unmanned aerial vehicle (UAV) and automatic 3D photo-reconstruction methods. Eur. J. Agron. 55, 89–99.
Ørka, H.O., Næsset, E., Bollandsås, O.M., 2007. Utilizing airborne laser intensity for tree species classification. Int. Arch. Photogramm. Remote Sens. Spat. Inf. Sci. 36, W52.
Ørka, H.O., Næsset, E., Bollandsås, O.M., 2009. Classifying species of individual trees by intensity and structure features derived from airborne laser scanner data. Remote Sens. Environ. 113, 1163–1174.
APPENDIX.
Confusion matrix of tree genus classification (k-nn + GA feature selection, reflectance features)
GENUS Abies Acer Betula Fraxinus Larix Picea Pinus Populus Pseudots. Quercus Thuja Tilia Tsuga Ulmus Total
Producer's accuracy
Abies 88 0 0 0 0 5 6 0 1 0 2 0 1 1 104 0.846
Acer 0 10 0 0 0 0 0 0 0 3 0 0 0 0 13 0.769
Betula 0 0 2 0 0 0 0 0 0 3 0 0 0 0 5 0.400
Fraxinus 0 0 0 34 0 1 0 0 0 5 0 0 0 0 40 0.850
Larix 0 0 0 0 13 0 1 0 1 1 0 0 0 0 16 0.813
Picea 4 0 0 2 0 115 8 0 2 1 0 0 0 0 132 0.871
Pinus 1 0 0 0 0 4 166 1 0 0 0 0 0 0 172 0.965
Populus 0 1 0 0 0 0 1 12 3 2 0 0 0 0 19 0.632
Pseudotsuga 5 0 0 0 1 2 0 1 18 0 0 0 0 0 27 0.667
Quercus 0 1 0 6 0 0 0 0 0 88 0 1 0 0 96 0.917
Thuja 1 0 0 0 0 0 0 0 0 0 19 0 0 0 20 0.950
Tilia 0 0 0 1 1 0 0 0 0 2 0 0 0 0 4 0.000
Tsuga 3 0 0 0 0 0 0 0 0 0 1 0 16 0 20 0.800
Ulmus 0 0 0 0 0 0 1 0 0 0 0 0 0 4 5 0.800
Total 102 12 2 43 15 127 183 14 25 105 22 1 17 5 673 0.734
User's accuracy 0.863 0.833 0.000 0.791 0.867 0.906 0.907 0.857 0.720 0.838 0.864 0.000 0.941 0.800
Proportion of correct 0.869 Kappa 0.844
This contribution has been peer-reviewed.