In VHR(very high resolution) aerial images, shadows indicating height information are valuable for validating or detecting changes on an existing 3D city model. In the paper, we propose a novel and full automatic approach for shadow detection from VHR images. Instead of automatic thresholding, the supervised machine learning approach is expected with better performance on shadow detection, but it requires to obtain training samples manually. The shadow image reconstructed from an existing 3D city model can provide free training samples with large variety. However, as the 3D model is often not accuracy, incomplete and outdated, a small portion of training samples are mislabeled. The erosion morphology is provided to remove boundary pixels which have high mislabeling possibility from the reconstructed image. Moreover, the quadratic discriminant analysis (QDA) which is resistant to the mislabeling is chosen. Further, two feature domains, RGB and ratio of the hue over the intensity, are analyzed to have complementary effects on better detecting different objects. Finally, a decision fusion approach is proposed to combine the results wisely from preliminary classifications from two feature domains. The fuzzy membership is a confidence measurement and determines the way of making decision, in the meanwhile the memberships are weighted by an entropy measurements to indicate their certainties. The experimental results on two cities in the Netherlands demonstrate that the proposed approach outperforms the two separate classifiers and two stacked-vector fusion approaches.
1. INTRODUCTION
Very high resolution aerial images reveal very rich and valuable details on the earth surface. The very detailed color information allows distinguishing many essential objects, such as individual buildings, trees, streets, etc. The point clouds can be also quired from image matching (Hirschmuller, 2008) with high ac-curacy by using aerial images (Stal et al., 2013). With these ad-vantages and high updating frequency, aerial images become very good resources for change detection, update or validate of the 3D models. Because the quality of point clouds from image matching still suffers from incompleteness and noises, the performance of detection changes on 3D models by using these point clouds can be largely affected. The shadows in the images which indicate valuable height information has been proposed to be very helpful to find height changes on 3D models(Rathje et al., 2005). On the other hand, radiometric distortion in the shadow area would de-teriorate performance of classification and give out false alarms on change detection (Adeline et al., 2013). Therefore, shadows in VHR images especially in urban environment have to be de-tected.
The existing literature presents three main categories of shadow detection (Adeline et al., 2013, Lorenzi et al., 2012): property-based, supervised learning based and model-based approaches. Property-based methods do not need any prior knowledge and often combine with automatic thresholding. They focus on ex-ploring property of spectral information to separate shadow from others. The shadow regions hold some properties: shadows have low luminance because of occlusion of direct light(Tsai, 2006); higher hue value due to the radiance received from shadows de-creases from short (blue)to long wavelength (red) due to Rayleigh scattering (Tsai, 2006, Adeline et al., 2013). These properties
∗Corresponding author
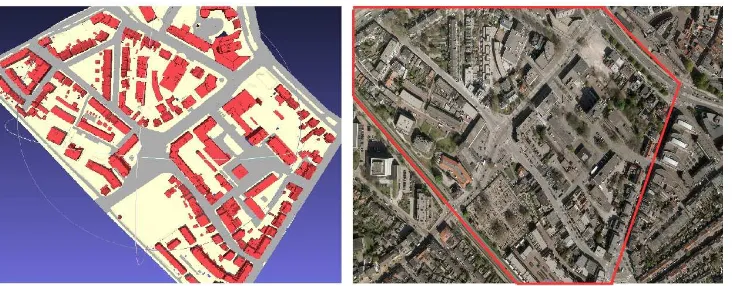
Figure 1. The 3D city models of Amersfoort with 200,000 triangles is created by using a hydrological map and AHN dataset around
2009. The corresponding area of the aerial image in2010is shown in the red polygon areas. The different colors in the 3D model show different classes of objects.
shadow or non-shadow area are still mislabeled and can provide a large amount of mislabeling samples.
The performance of shadow detection is obviously strongly re-lated to the features chosen to be separated from non-shadows. Shadow detection based on RGB features is very suitable to find shadows with low radiometric reflection, but dark roofs can be misclassified. On the other hand, shadow detection based on ratio of hue over intensity performs better on dark roofs which receive more radiations from long wavelength, but bluish solar panels with high hue values can be more likely classified as shadows and red objects under the shadows with low hues may be classified as non-shadows. Thus, reliability assessment of different features should be considered in the classification. Stacked-vector ap-proach is a straight-forward way to combine different features for classification. However, a multivariable statistic model, e.g. mul-tivariate Gaussian model, does not have the mechanism to include weight of features according to their reliability(Benediktsson et al., 1990). Many more nonparametric approaches, such as neu-ral networks, decision trees and SVM takes weights of different features into account(Waske and Benediktsson, 2007). Instead of one-step stacked approach, decision fusion proposes to fuse the information deduced from preliminary classification on sev-eral individual feature domains (Benediktsson et al., 1990, Fauvel et al., 2006). The approach allows to choose different classifiers which might be more suitable to different feature domains, e.g. an accurate multivariate statistical model may provide better classifi-cation than these non-parametric approaches. The reliability can be derived globally for each classifier(Benediktsson et al., 1990) or locally for pixels(Fauvel et al., 2006) from preliminary classi-fications.
In this paper, we propose a novel and fully automatic approach for shadows detection from the image by using 3D city models. The reconstructed image from 3D city model by ray tracing is treated as a pool of training samples with large variety for a su-pervised learning. However, the mislabeling effects introduce se-rious mixtures between shadows and non-shadows. Erosion is applied to remove the unreliable labels on the boundaries, while QDA is tested with better capability than SVM of solving the mixture problem. In order to further addressing the problem, the two widely used feature domains, RGB and ratio, are analyzed and the complementary effects are found. The decision fusion approach of using fuzzy membership function and pixel-wise
en-tropy measurement is proposed to solve the conflicting situations and make most of the complementary effects.This paper is orga-nized as follows. Section 2 describes study area and data. Section 3 illustrate the methodology proposed for shadow detection, fol-lowed by experimental results and comparisons in section 4 and conclusions in section 5.
2. STUDY AREA AND DATA
The two study areas are urban areas located in Amersfoort and AssenDelft, Netherlands. The reasons of choosing these two ar-eas are: 1) The residential buildings and trees contribute to seri-ous shadows in both areas. 2) Many dark roofs and reddish roads in Amersfoort increase difficulties of shadow detection from clas-sification on either individual feature domain described in Sec-tion 3.3, while more bluish solar panels existed in AssenDelft would also increase difficulties in classification in ratio domain. Each aerial images is acquired by UltraCam on23April,2010
or 14April,2015with RGB bands of3.5cmresolution cover-ing around0.2km2for Amersfoort and AssenDelft with a size of 11310∗17310pixels or 7500∗11500pixels respectively. The automatic 3D city modeling is intensively investigated in the last decades and summarized in (Haala and Kada, 2010). Oude Elberink (Elberink et al., 2013) creates a national-wide general 3D city model by using topographic maps and point clouds, e.g. Top10NL and AHN2 respectively. Both Top10NL and AHN2 are open sources in the Netherlands. Top10NL is an object ori-ented topographic dataset at scale 1:10,000, while AHN2, a point cloud, provides height information for these objects. The other topographic and height data can be also used as input. For Amers-foort, a hydrological map and AHN2 point clouds around2009
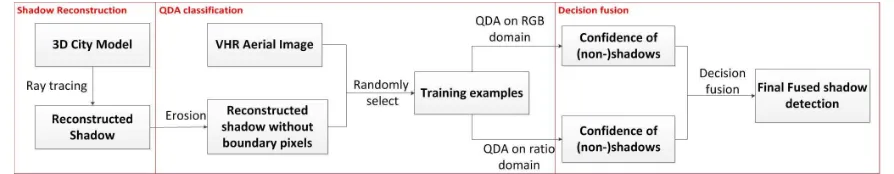
The proposed methodology as shown in Figure 2 for shadow de-tection consist of (1) shadow reconstruction (2) QDA shadow classification (3) decision fusion on two feature domains. In the following sections, the details will be discussed.
3.1. Shadow Reconstruction
Shadow reconstruction for aerial images needs the prior knowl-edge of sun position and camera parameters. The sun position can be calculated from the time the image was taken, while inter-nal and exterinter-nal orientation of camera can be precisely estimated by bundle adjustment including several ground control points. If these prior information are known, the shadow can be recon-structed from ray tracing. It is very straight forward and can give very accurate results. At first, a ray from each pixel in the image plane is generated from camera to 3D model. Then first intersec-tion between the ray and scene is found, which indicates the point can be by the camera through the pixel. Another shadow ray from the intersection point to light source is generated and if the ray is intersected with scene, the pixel is in shadow. A Kd tree which is a space-partitioning data structure for organizing triangles in a k-dimensional space is designed in order to fast the intersection between ray and 3D model to a reasonable time. Constructing a efficient Kd tree for triangular meshes is also time consuming, so aO(N log2
N)approach is adopted and more details can be found in (Wald and Havran, 2006).
However, there are several reasons that the reconstructed shadows may not exactly match with shadows in the image.
1) The time of 3D model may not match with the image.
2) The trees which can cause significant shadows are often missed or not well modeled in the 3D models.
3) The accuracy of the 3D modeling are often affected in the areas with low point density and missing data due to occlu-sions. The shadows around boundary region are often not reliable due to many spurious triangles.
Although shadow reconstruction is not enough for shadow de-tection in the images, these shadows are the prior knowledges of where the shadow can be in the image as the objects in the city would not change dramatically. Therefore, large portions of these shadows are labeled correctly and show very large variety. By us-ing them as trainus-ing examples, supervised classification methods are expected to reveal the characteristics of shadows and improve the shadow detection. However, the mixture problem aggravated by mislabeling should be properly addressed.
cal filter is applied in both shadow and non-shadow areas in order to remove the unreliable boundary pixels mentioned in section 3.1. As most of reconstructed shadows are caused by buildings, a disk-shaped structure, which is often used for filtering while preserving building structure, is used to remove the artifacts from spurious triangles in 3D models. However, the mislabeled areas still exist due to the trees and different time-line. The mixture be-tween shadows and nonshadows in the training examples become a serious problem. While SVM is used in many researches(Guo et al., 2011, Tolt et al., 2011, Lorenzi et al., 2012), SVM aims to find an optimal boundary hyperplane between classes and would put lots of effort on the mislabeled samples, resulting in the over fit-ting problem. However, if the multivariate models of two classes can be estimated properly from relatively large portions of cor-rectly labeled samples, a better classification can be obtained. By randomly choosing training examples from reconstructed shadow map and displaying them in RGB or ratio of hue over intensity domain, both classes show Gaussian-like distribution as shown in Figure 3 even serious mixture of two classes exists. With large portion of correct labeled examples, the estiamtion of distribu-tion of two classes can be resistant to the mislabeling and mixture problem. A commonly used QDA (Theodoridis and Koutroum-bas, 1999) which assumes a Gaussian distribution for each classes with different covariances is chosen for classification.
Figure 3. 10,000 training examples are randomly selected for each class and displayed in RGB and Ratio domains in left and
right image respectively.
Given ad-dimensional feature spaceRd, a feature vectorxis a training examples with a corresponding classωi, i = 1,2, ..M. In binary classification problem,M = 2. The posterior probabil-ities are form asP(ωi|x), i= 1,2, ..M and can be decomposed according to Bayes’ theorem:
P(ωi|x) =
p(x|ωi)p(ωi)
p(x) (1)
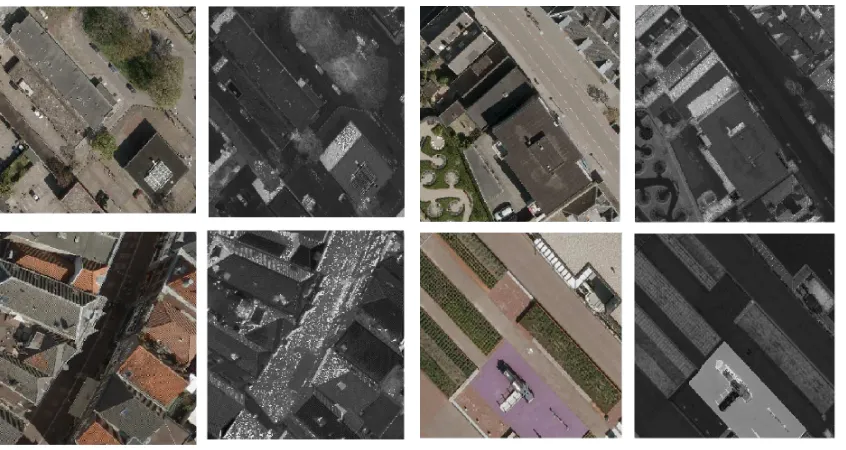
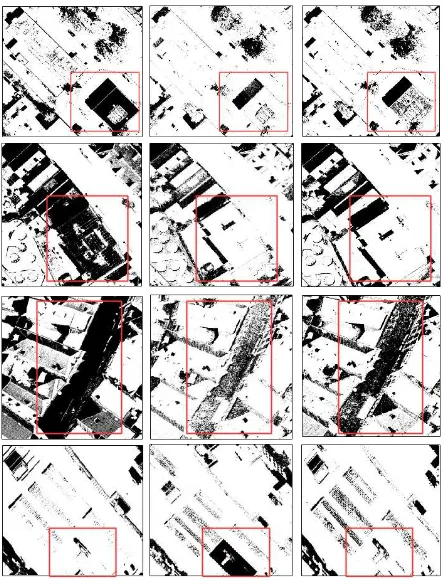
Figure 4. Four cases are displayed in RGB and ratio domain. In radio image, shadows are more white. The images in upper row shows that roofs are easily detected in ratio domain, while the images in lower row shows that shadow in city canyon and purplish objects
can be correctly detected in RGB domain.
p(ωi)is prior probability of a classωi
p(x)is the joint distributionp(x) =PiM=1p(x|ωi)p(ωi)
The denominator is not dependent onωiand can be treated as a constant. If pdfsp(x|ωi)are Gaussian multivariate distributions, N(µi,Σi), the logarithmic functiongi(x)of the posterior prob-ability becomes:
gi(x) = lnp(x|ωi) + lnp(ωi) (2)
or
gi(x) =−
1 2(x−µi)
T
Σ−1i (x−µi)+lnp(ωi)− l
2ln 2π− 1 2ln|Σi|
(3)
The classification rule:
ˆ
ωk=arg max k
gk(x) (4)
The decision boundaries are quadratic equations inx. QDA with much more flexible covariance assumption can fit the data better than linear discriminant analysis (LDA). The unknown parame-ters in multivariate Gaussian distributions are estimated by using maximum likelihood.
3.3. Decision Fusion on Two feature domains
Even the QDA can be resistant to mislabeling, accurate estima-tion of Gaussian distribuestima-tions is affected apparently. The pixels far away from the center of Gaussains or in the mixture region is less reliable. However, if the pixels are not reliable in one fea-ture domain but are better located in another domain, the mixfea-ture problem in either feature domains can be further mitigated.
The property of shadow is studied intensively (Tsai, 2006, Chung et al., 2009, Adeline et al., 2013) and can be summarized into two main properties:
1) Shadows have low radiometric reflection.
2) Radiation received from shadow area decrease from short (blue-violet) to long (red) wavelength because of Rayleigh scattering.
According to these properties, two feature domains, RGB and the ratio of hue over intensity from invariant color models, are widely used. According to property (1), shadows have the low RGB values or intensity. Moreover, according to the properties (2), shadows are expected with higher hue values than nonshadow for the same object. Therefore, the ratio of hue over intensity is more effective to separate the two classes than only using inten-sity. Shadows are expected to have large ratios. TheHSIcolor space is tested with best performance in Tsai’s work and the ratio is defined as H+1
I+1 and the scaled to[0,255], where range ofH andIare both in[0,1](Tsai, 2006).
better detected as a certain class in a classifier. As the QDA assumes the two classes are Gaussian distributed, the Gaussian curve membership function (Kaufmann and Swanson, 1975) is chosen.
µ(x) = exp(−1
2(x−µ)
T
Σ−1(x−µ)) (5)
where µ(x)is a fuzzy membership degree
When a conflict situation happens, a max operator on fuzzy mem-bership degrees are better applied to solve the problem when the reliability of classifications are different. The fused result for each class from classifiers is obtained and then final classifica-tion can be determined.
µfi =max(µ j
i(x), j= 1,2, ...N); (6)
where µf is the fused membership degree for each class from several classifiers
µji(x)is the membership degree of a pixelxto classi given classifierj. In2-class problem with2classifiers, i∈ {1,2},j∈ {1,2}
However, it is unreliable to fully rely on the membership de-gree, when the classes have serious mixing problem. For a2 -class problem with2classifications, the membership degree of a pixel can be very high to both classifiers in the mixing area be-tween two classes. The large uncertainty of classification are es-pecially in the mixing area. Aα-quadratic entropy is introduced to measure the pixel-wise reliability to each classifier(Fauvel et al., 2006). However, it does not include measurement of mixing extent of the pixel between two classes. A new entropy is pro-vided introduced to measure the mixture extent of pixel in each classifiers:
Hj=−X i
µji(x) logb(µ j
i(x)) (7)
where Hjis the entropy of a pixel to class j
µji(x)is normalized membership degree among different classes.
bis the base of the logarithmb= 2for2-class problem
For2-class case, the equation becomes:
Hj=−µj(
x) log2(µ j(
x))−(1−µj(x)) log2(1−µ j(
x)) (8)
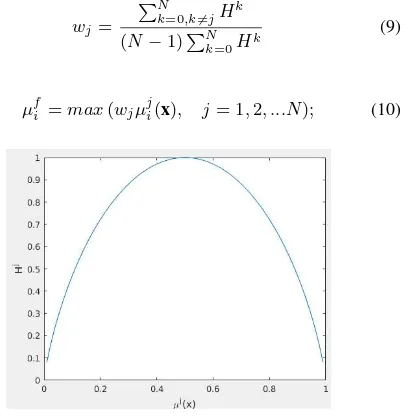
Figure 5. Entropy curve of2-class case.
4. EXPERIMENT RESULTS AND COMPARISON
The experiments in this paper were applied on two city areas in Amersfoort and AssenDelft, Netherlands. The datasets are de-scribed in Section 2. The experiments are fully automatic without any manual work of selecting training examples. The proposed approach was compared with many other approaches in order to show the effectiveness of our approach.
4.1. Experiment on Amersfoort
The 3D model consists of200,000triangles and the size of re-constructed shadow image is11310∗17310with pixel size of
6µm∗6µm. The altitude and azimuth of sun position is44.58◦ and140.410◦
. The camera position is(154698.489m,462637.
358m,623.512m). The external orientation of the camera is
[−0.2801◦
,0.0032◦
,−89.2683◦]
, while the internal parameters, focal length and position of principle points, are(100.5mm,0
mm,0mm). The KD tree and parallel computing was adopted to fast the ray tracing. With a HP computer with a8GBram and quadcore, the KD tree construction need15s, while the time for reconstruction was40 min. The reconstructed image is a black and white image with value in{0,1}. The black pixels are shad-ows while the white pixels are non-shadshad-ows.
are well detected in RGB domain, but very poorly detected in the ratio domain. The fusion makes a wise choice to detect more shadows, while still a small portion of shadows are misclassified. The reason can be these pixels has reddish color and are brighter due to reflection from windows in the buildings. The resulting low ratio values would have high confidence to be assigned to nonshadow in ratio domain. In the last case, the purple object is detected as non-shadow in RGB domain, but treated as shadow in ratio domain. The decision fusion chooses to believe the re-sult from RGB domain. Overall, it is obvious that our proposed approach is very effective to solve the conflicting situations.
The accuracy of proposed approach was compared with the two separate classifiers and two stacked-vector fusion approaches quan-titatively in Table 1 with four measurements: TPR(true positive rate), FPR(false positive rate), FNR(false negative rate), correct-ness and KC(Kappa coefficient). TPR describes completecorrect-ness of the detection, FPR describes commission errors, and FNR de-scribes omission errors. QDA with RGB domain has highest completeness of detection with97.31%, however, many dark roofs are also misclassified as shadows, so commission error is also highest with18.67%. Therefore, it has lowest the correctness of shadow detection. QDA with ratio domain has an opposite result that it has lowest misclassification on non-shadows with lowest commission error , however,many shadows are not detected with a completeness of79.15%. Even with a highest correctness of shadow detection,the KC is low. The reason may be that the city canyon effects are quite strong and many objects with strong red materials are under the shadows in this area. QDA with stacked vector improves the classification, however, SVM with stacked vector become worse and has lowest KC. An SVM with RBF ker-nel may have overfitting problem due to serious mixture between two classes. The proposed approach have both high completeness and correctness on shadow detection, low rate on misclassifica-tion. It means the decision fusion performs well in the conflicting situations. With the highest KC,0.8576, the proposed approach outperforms the other approaches.
4.2. Experiment on AssenDelft
The 3D model consists of1,000,000triangles and the size of re-constructed the shadow image is7500∗11500with pixel size of
9µm∗9µm. The altitude and azimuth of sun position is42.68◦ and216.310◦
. The camera position is(1111487.246m,500278.
593m,338.912m). The external orientation of the camera is
[−0.275◦ ,0.223◦
,178.472◦]
, while the internal parameters, fo-cal length and position of principle points, are(101.4mm,−0.18
mm,0.27mm). As field of view of the camera only covers par-tial of the 3D model, the triangles falling into the camera are se-lected for KD tree construction and ray tracing. With the same
16.32%because of dark roofs, but QDA wit Ratio domain works quite well in shadow detection with high completeness and cor-rectness while has low misclassification rate. The reason can be that red road under shadows are much less. Still, a small amount of bluish solar panels are misclassified. The SVM with the stacked vector perform worst comparing with all the other methods. QDA with the stacked vector has a high completeness on detecting shadows, but still the dark roofs are not properly ad-dressed with13.57%commission errors. The proposed approach also performs very good with the highest KC,0.9023.
In conclusion, the proposed approach performs better than the other listed methods on the datasets from different cities with complex environments. It means the proposed method is effec-tive for various environments, while the performance of other methods are more dependent on the environment. The QDA with ratio domain performs quite well on AssenDelft dataset, how-ever, has a low rate of shadow detection on Amersfoort dataset. The QDA with stacked vector works quite stable in both environ-ments, however, is still not as good as proposed approach.
5. CONCLUSION
TPR % FPR % FNR % Correctness % KC
QDA+RGB 98.89 16.32 1.11 83.67 0.8275
QDA+Ratio 92.88 6.02 7.12 93.97 0.8866
QDA+(RBG+Ratio) 98.69 13.57 1.32 86.43 0.8572
SVM+(RGB+Ratio) 86.12 19.23 13.88 80.76 0.7048
Proposed 96.85 7.82 3.15 92.18 0.9023
Table 2. The shadow detection result for different classifications on AssenDelft dataset.
pixelsfallingintothesemixtureregionsarenotreliable.An en-tropy measuringpixel-wisereliabilityin eachclassifieri s pro-vided. Thefuzzymembershipdegreeisweightedineach clas-sifiera ccordingt ot hee ntropies.T hent hem axo peratori s ap-pliedtoobtainthefusedfuzzymembershipdegreeforeachclass and afinald ecisionc anb em adet oc onflictingsi tuations.By comparingwithotherseparateclassifiersandtwostacked-vector approaches,theproposedapproachmakeswisechoiceon con-flictings ituationsa ndm akesb etteru seo fc omplementary char-acteristicsoftwofeaturedomains. Withtwocomplexcity envi-ronments,theproposedapproachisprovedtobemoreadaptive todifferentscenarios.
Avarietyoffurtherworkscanbeanticipated. First,asa3Dcity modelincludesthe priorknowledgeofthe differentclassesof objects,theclass-wisereliabilityofeachclassifiercanbederived fromtrainingsamplesfromeachclass. Thereliabilitywillhelp tominimizetheeffectsofpoorclassifiers.S econd,t hetexture featurescanbeconsidered asanotherdomainforclassification ortheMarkovrandomfielda nalysisc onsideringr elations adja-centpixelscanbeappliedbeforetheclassificationorafterfusion. Finally,thefurtherresearchonusingtheoutputofshadowsfor changedetectiononthe3Dmodelcanbepromising.
REFERENCES
Adeline, K., Chen,M., Briottet, X., Pang, S.and Paparoditis, N.,2013.Shadowdetectioninveryhighspatialresolutionaerial images:Acomparativestudy.ISPRSJournalofPhotogrammetry andRemoteSensing,80,pp.21–38.
Arbel,E.andHel-Or,H.,2011. Shadowremovalusingintensity surfacesandtextureanchorpoints.IEEEtransactionsonpattern analysisandmachineintelligence, 33(6),pp.1202–1216.
Benediktsson,J.A.,Swain,P.H.andErsoy,O.K.,1990.Neural networkapproachesversusstatisticalmethodsinclassificationof multisource remote sensing data. In: Geoscience and Remote
Sensing Symposium, pp. 489-492.
Chung, K.-L., Lin, Y.-R. and Huang, Y.-H., 2009. Efficient shadow detection of color aerial images based on successive thresholdingscheme.IEEETransactionsonGeoscienceand Re-motesensing, 47(2),pp.671–682.
Elberink,S.O.,Stoter,J.,Ledoux,H.andCommandeur,T.,2013. Generationand disseminationof anational virtual 3d cityand landscapemodelforthenetherlands. Photogrammetric engineer-ing&remotesensing, 79(2),pp.147–158.
Fauvel,M.,Chanussot,J.andBenediktsson,J.A.,2006. Deci-sionfusionfortheclassificationofurbanremotesensingimages. IEEE Transactions on Geoscience and Remote Sensing, 44(10),pp.2828–2838.
Gorte,B.andvanderSande,C.,2014.Reducingfalsealarmrates duringchange detectionby modelingrelief,shadeand shadow ofmulti-temporalimagery. TheInternationalArchivesof Pho-togrammetry, Remote Sensing and Spatial Information Sciences, 40(4),pp.65.
Guo,R.,Dai,Q.and Hoiem,D., 2011. Single-imageshadow detectionand removalusingpairedregions. In: Computer Vi-sionandPatternRecognition(CVPR),2011IEEEConferenceon, pp.2033–2040.
Haala,N.andKada,M.,2010.Anupdateonautomatic3d build-ingreconstruction. ISPRSJournalofPhotogrammetryand Re-moteSensing, 65(6),pp.570–580.
Hirschmuller,H.,2008.Stereoprocessingbysemiglobal match-ingandmutualinformation.IEEE Transactions on pattern anal-ysisandmachineintelligence, 30(2),pp.328–341.
Kaufmann, A. andSwanson, D.L., 1975. Introduction tothe theory of fuzzy subsets. Academic press, New York. Vol. 1 Number 8,
Levin, A., Lischinski, D.and Weiss,Y., 2008. Aclosed-form solutiontonaturalimagematting. IEEETransactionsonPattern AnalysisandMachineIntelligence, 30(2),pp.228–242.
Lorenzi,L.,Melgani,F.andMercier,G.,2012. Acomplete pro-cessingchainforshadowdetectionandreconstructioninvhr im-ages. IEEE transactions on geoscience and remote sensing, 50(9),pp.3440–3452.
Mather,P.andTso,B.,2009. Classification methods for remotely senseddata. CRCpress, BocaRaton.
Otsu,N., 1975. Athresholdselectionmethodfromgray-level histograms.Automatica, 11(285-296),pp.23–27.
Rathje,E.M.,Woo,K.,Crawford,M.,Neuenschwander,A.etal., 2005. Earthquake damage identification using multi-temporal high-resolutionopticalsatelliteimagery. In: International Geo-science and Remote Sensing Symposium,Vol.7,pp.5045.
Stal, C., Tack, F., DeMaeyer, P., DeWulf, A.and Goossens, R.,2013.Airbornephotogrammetryandlidarfordsmextraction and3dchangedetectionoveranurbanarea–acomparativestudy. InternationalJournalofRemoteSensing, 34(4),pp.1087–1110.
Theodoridis,S.andKoutroumbas,K.,1999.Patternrecognition, Academicpress. New York.
Tolt,G., Shimoni,M.andAhlberg,J., 2011. Ashadow detec-tionmethodforremotesensing imagesusingvhrhyperspectral andlidardata. In: GeoscienceandRemoteSensingSymposium (IGARSS),2011IEEEInternational,pp.4423–4426.
Tsai,V.J.,2006. Acomparativestudyonshadowcompensation ofcoloraerialimagesininvariantcolormodels. IEEE transac-tionsongeoscienceandremotesensing, 44(6),pp.1661–1671.
Wald,I.andHavran,V.,2006. Onbuildingfastkd-treesforray tracing,andondoingthatino(nlogn). In: 2006IEEE Sympo-siumonInteractiveRayTracing,pp.61–69.