1
Cascade of HIV testing, care and
Cascade of HIV testing, care and
treatment services, 2014 & 2015:
World Health Organization, Regional Office for South-East Asia.
Cascade of HIV testing, care and treatment services, 2014 & 2015: country profiles.
© World Health Organization 2016
All rights reserved.
Requests for publications, or for permission to reproduce or translate WHO publications – whether for sale or for noncommercial distribution – can
be obtained from Publishing and Sales, World Health Organization, Regional Office for South- East Asia, Indraprastha Estate, Mahatma Gandhi Marg,
New Delhi 110 002, India (fax: +91 11 23370197; e-mail: [email protected]).
The designations employed and the presentation of the material in this publication do not imply the expression of any opinion whatsoever on the part
of the World Health Organization concerning the legal status of any country, territory, city or area or of its authorities, or concerning the delimitation
of its frontiers or boundaries. Dotted lines on maps represent approximate border lines for which there may not yet be full agreement.
The mention of specific companies or of certain manufacturers’ products does not imply that they are endorsed or recommended by the World
Health Organization in preference to others of a similar nature that are not mentioned. Errors and omissions excepted, the names of proprietary
products are distinguished by initial capital letters.
All reasonable precautions have been taken by the World Health Organization to verify the information contained in this publication. However, the
published material is being distributed without warranty of any kind, either expressed or implied. The responsibility for the interpretation and use of
the material lies with the reader. In no event shall the World Health Organization be liable for damages arising from its use.
Acronyms
Bangladesh
Bhutan
India
Indonesia
Maldives
Myanmar
Nepal
Sri Lanka
Thailand
Timor Leste
7
8
10
12
14
16
18
20
22
24
28
ACRONYMS
AIDS
acquired immunodeficiency syndrome
ANC
antenatal care
ARV
antiretroviral (drug)
ART
antiretroviral therapy
GARPR
Global AIDS Response Progress Reporting
HIV
human immunodeficiency virus
PLHIV
people living with HIV
PMTCT
prevention of mother-to-child transmission of HIV
TB
tuberculosis
UNAIDS
Joint United Nations Programme on HIV/AIDS
UNICEF
United Nations Children’s Fund
VL
viral load
WHO
World Health Organization
Bangladesh
Cascade of HIV testing, care and treatment services, 2014–2015
H I V t e s t i n g, c a r e a n d t r e a t m e n t
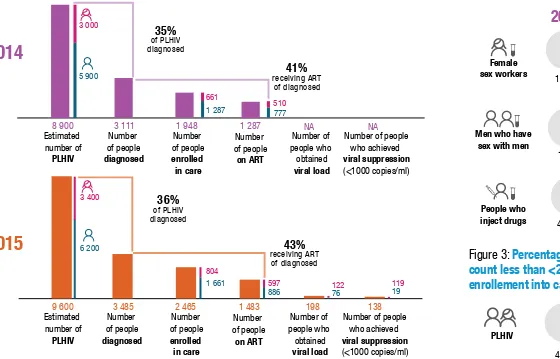
Figure 1:
Cascade of diagnosis and treatment for people living with HIV
Country Statistics 2015
Population (million)
(a)Income level
(b)Life expectancy at birth (male/female)
(a)Fertility rate, total (births per woman)
(a)Infant mortality rate per 1000 live births
(c)Maternal deaths per 100,000 births
(d)Proportion of births attended by skilled health personnel
(e)160
Lower-middle-income
69.9/72.3
2.2
31
176
42.1%
Estimated
number of
PLHIV
Number
of people
diagnosed
Number
of people
enrolled
in care
Number
of people
on ART
Number of
people who
obtained
viral load
Number of people
who achieved
viral suppression
(<1000 copies/ml)
8 900
3 111
1 948
1 287
5 900
3 000
1 287 777
661
510
9 600
3 485
2 465
1 483
198
138
804
886
1 661 597
Figure 2:
Percentage of key populations who received
an HIV test and knew their results in past 12 months
2014
2015
Female
sex workers
Men who have
sex with men
People who
inject drugs
17.8%
2014
2015
16%
4.7%
54.4%
Figure 3:
Percentage of PLHIV with first CD4
count less than <200 cells/uL during
enrollement into care
PLHIV
45.8%
47.4%
42%
45.1%
Estimated
number of
PLHIV
Number
of people
diagnosed
Number
of people
enrolled
in care
Number
of people
on ART
Number of
people who
obtained
viral load
Number of people
who achieved
viral suppression
(<1000 copies/ml)
35%
of PLHIV diagnosedNA
NA
76
122
41%
receiving ARTof diagnosed
36%
of PLHIV diagnosed43%
receiving ARTof diagnosed
19
119
6 200
9
P r e v e n t i o n o f m o t h e r- t o - c h i l d t r a n s m i s s i o n
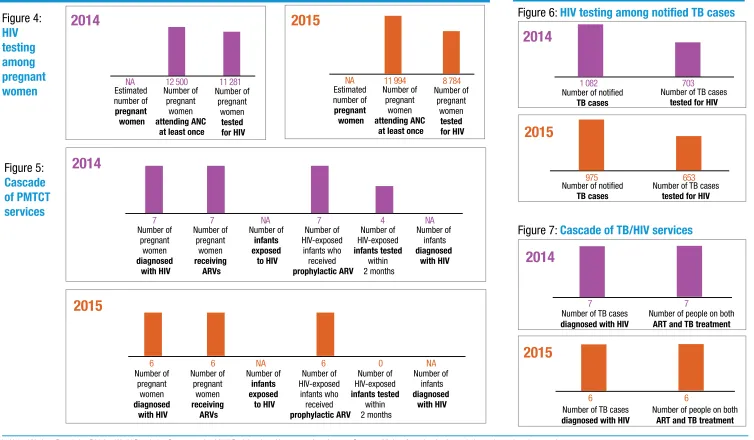
Figure 4:
HIV
testing
among
pregnant
women
Figure 5:
Cascade
of PMTCT
services
T B / H I V c o i n f e c t i o n
Figure 6:
HIV testing among
notified
TB cases
Figure 7:
Cascade of TB/HIV services
Number ofpregnant women
diagnosed with HIV
Number of pregnant
women
receiving ARVs
Number of
infants exposed
to HIV
Number of HIV-exposed
infants who received
prophylactic ARV
Number of HIV-exposed
infants tested
within 2 months
Number of infants
diagnosed with HIV
Estimated number of
pregnant women
Number of pregnant
women
attending ANC at least once
Number of pregnant
women
tested for HIV(f)
Number of notified
TB cases
Number of TB cases
tested for HIV
Number of notified
TB cases
Number of TB cases
tested for HIV
Number of TB cases
diagnosed with HIV
Number of people on both
ART and TB treatment
Number of TB cases
diagnosed with HIV
Number of people on both
ART and TB treatment
2014
2015
2014
pregnantwomen
diagnosed with HIV
Number of pregnant
women
receiving ARVs
Number of
infants exposed
to HIV
Number of HIV-exposed
infants who received
prophylactic ARV
Number of HIV-exposed
infants tested
within 2 months
Number of infants
diagnosed with HIV
Estimated number of
pregnant women
Number of pregnant
women
attending ANC at least once
Number of pregnant
women
tested for HIV(f)
(a) United Nations Population Division,World Population Prospects, the 2015 Revision, http://esa.un.org/wpp/ (b) World Bank,https://datahelpdesk.worldbank.org/knowledgebase/articles/906519,accessed 24 October 2016 (c) WHO, UNICEF, UNFPA, World Bank Group, and United Nations Population Division, Maternal Mortality Estimation
Inter-Agency Group estimates, 2015
(d) 2016, World population data sheet, http://www.prb.org/pdf16/prb-wpds2016-web-2016.pdf (e) Millennium Development Goals Indicators. United Nations Statistics Division;2014) http://mdgs.un.org/unsd/mdg/SeriesDetail.aspx?srid=570, accessed 26 October 2016 (f) The data of pregnant women tested for HIV is from 3 hospitals. (Not nationally representative)
Sources: All data from the databases below unless otherwise stated
- Global AIDS Response Progress Reporting (GARPR) online reporting tool [online database].Geneva:UNAIDS,WHO,UNICEF 2016 - AIDSInfo[website].Geneva: UNAIDS;2016(http://aidsinfo.unaids.org)
- Tuberculosis (TB)[online database].Geneva:WHO;2016 (http://www.who.int/tb/country/data/profiles/en/) - ANC attendance data from DHS Key indicators 2014, Bangladesh.
Bhutan
Cascade of HIV testing, care and treatment services, 2014–2015
H I V t e s t i n g, c a r e a n d t r e a t m e n t
Figure 1:
Cascade of diagnosis and treatment for people living with HIV
Country Statistics 2015
Population (million)
(a)Income level
(b)Life expectancy at birth (male/female)
(a)Fertility rate, total (births per woman)
(c)Infant mortality rate per 1000 live births
(d)Maternal deaths per 100,000 births
(c)Proportion of births attended by skilled health personnel
(e)0.77
Lower-middle-income
68.6/69.1
2.1
27.2
148
74.6%
Estimated
number of
PLHIV
Number
of people
diagnosed
Number
of people
enrolled
in care
Number
of people
on ART
Number of
people who
obtained
viral load
Number of people
who achieved
viral suppression
(<1000 copies/ml)
1 100
403
307
180
204 87
199
93
1 100
460
365
210
0
0
226
92
234 118
Figure 2:
Percentage of key populations who received
an HIV test and knew their results in past 12 months
2014
2015
Female
sex workers
Men who have
sex with men
People who
inject drugs
NA
2014
2015
NA
NA
NA
Figure 3:
Percentage of PLHIV with first CD4
count less than <200 cells/uL during
enrollement into care
PLHIV
23.5%
NA
NA
NA
Estimated
number of
PLHIV
Number
of people
diagnosed
Number
of people
enrolled
in care
Number
of people
on ART
Number of
people who
obtained
viral load
Number of people
who achieved
viral suppression
(<1000 copies/ml)
0
0
160
147
190
175
45%
receiving ARTof diagnosed
37%
of PLHIV diagnosed
46%
receiving ARTof diagnosed
42%
11
P r e v e n t i o n o f m o t h e r- t o - c h i l d t r a n s m i s s i o n
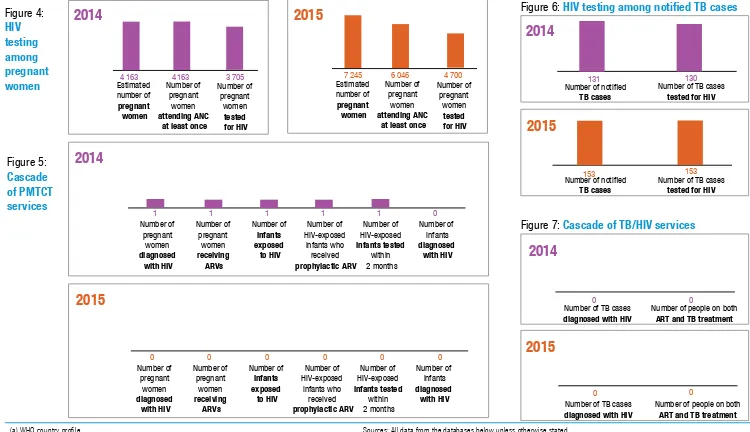
Figure 4:
HIV
testing
among
pregnant
women
Figure 5:
Cascade
of PMTCT
services
T B / H I V c o i n f e c t i o n
Figure 6:
HIV testing among
notified
TB cases
Figure 7:
Cascade of TB/HIV services
Number ofpregnant women
diagnosed with HIV
Number of pregnant
women
receiving ARVs
Number of
infants exposed
to HIV
Number of HIV-exposed
infants who received
prophylactic ARV
Number of HIV-exposed
infants tested
within 2 months
Number of infants
diagnosed with HIV
Estimated number of
pregnant women
Number of pregnant
women
attending ANC at least once
Number of pregnant
women
tested for HIV
Number of notified
TB cases
Number of TB cases
tested for HIV
Number of notified
TB cases
Number of TB cases
tested for HIV
Number of TB cases
diagnosed with HIV
Number of people on both
ART and TB treatment
Number of TB cases
diagnosed with HIV
Number of people on both
ART and TB treatment
2014
2015
2014
pregnantwomen
diagnosed with HIV
Number of pregnant
women
receiving ARVs
Number of
infants exposed
to HIV
Number of HIV-exposed
infants who received
prophylactic ARV
Number of HIV-exposed
infants tested
within 2 months
Number of infants
diagnosed with HIV
Estimated number of
pregnant women
Number of pregnant
women
attending ANC at least once
Number of pregnant
women
tested for HIV
NA
12 500
11 281
NA
11 994
8 784
7
7
NA
7
4
NA
6
6
NA
6
0
NA
975
653
1 082
703
7
7
6
6
(a) United Nations Population Division,World Population Prospects, the 2015 Revision, http://esa.un.org/wpp/ (b) World Bank,https://datahelpdesk.worldbank.org/knowledgebase/articles/906519,accessed 24 October 2016 (c) 2016, World population data sheet, http://www.prb.org/pdf16/prb-wpds2016-web-2016.pdf
(d) WHO, UNICEF, UNFPA, World Bank Group, and United Nations Population Division, Maternal Mortality Estimation Inter-Agency Group estimates, 2015
(e) Millennium Development Goals Indicators. United Nations Statistics Division;2014, http://mdgs.un.org/unsd/mdg/SeriesDetail.aspx?srid=570, accessed 26 October 2016
Sources: All data from the databases below unless otherwise stated
- Global AIDS Response Progress Reporting (GARPR) online reporting tool [online database].Geneva:UNAIDS,WHO,UNICEF 2016 - AIDSInfo[website].Geneva: UNAIDS;2016(http://aidsinfo.unaids.org)
- Tuberculosis (TB)[online database].Geneva:WHO;2016 (http://www.who.int/tb/country/data/profiles/en/) - National STI & HIV/AIDS Control Programme data
India
Cascade of HIV testing, care and treatment services, 2014–2015
H I V t e s t i n g, c a r e a n d t r e a t m e n t
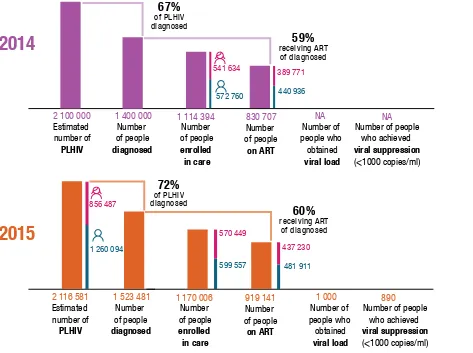
Figure 1:
Cascade of diagnosis and treatment for people living with HIV
Country Statistics 2015
Population (million)
(a)Income level
(b)Life expectancy at birth (male/female)
(c)Fertility rate, total (births per woman)
(c)Infant mortality rate per 1000 live births
(d)Maternal deaths per 100,000 births
(e)Proportion of births attended by skilled health personnel
(d)1 311
Lower-middle-income
66.1/68.9
2.48
37.9
174
81.1%
Estimated
number of
PLHIV
Number
of people
diagnosed
Number
of people
enrolled
in care
Number
of people
on ART
Number of
people who
obtained
viral load
Number of people
who achieved
viral suppression
(<1000 copies/ml)
2 100 000
1 400 000
1 114 394
830 707
NA
NA
572 760
389 771 541 634
440 936
2 116 581
1 523 481
1 170 006
919 141
1 000
890
1 260 094
856 487
599 557 481 911
570 449
437 230
Figure 2:
Percentage of key populations who received
an HIV test and knew their results in past 12 months
2014
2015
Female
sex workers
Men who have
sex with men
People who
inject drugs
70.5%
2014
2015
70.1%
68%
70.9%
Figure 3:
Percentage of PLHIV with first CD4
count less than <200 cells/uL during
enrollement into care
PLHIV
NA
52.77%
70.3%
72%
Estimated
number of
PLHIV
Number
of people
diagnosed
Number
of people
enrolled
in care
Number
of people
on ART
Number of
people who
obtained
viral load
Number of people
who achieved
viral suppression
(<1000 copies/ml)
59%
receiving ARTof diagnosed
72%
of PLHIV diagnosed67%
of PLHIV diagnosed60%
receiving ART13
P r e v e n t i o n o f m o t h e r- t o - c h i l d t r a n s m i s s i o n
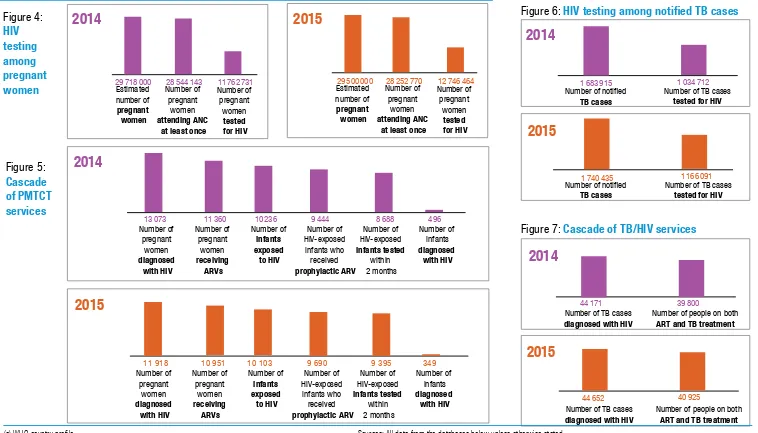
Figure 4:
HIV
testing
among
pregnant
women
Figure 5:
Cascade
of PMTCT
services
T B / H I V c o i n f e c t i o n
Figure 6:
HIV testing among
notified
TB cases
Figure 7:
Cascade of TB/HIV services
Number ofpregnant women
diagnosed with HIV
Number of pregnant
women
receiving ARVs
Number of
infants exposed
to HIV
Number of HIV-exposed
infants who received
prophylactic ARV
Number of HIV-exposed
infants tested
within 2 months
Number of infants
diagnosed with HIV
Estimated number of
pregnant women
Number of pregnant
women
attending ANC at least once
Number of pregnant
women
tested for HIV
Number of notified
TB cases
Number of TB cases
tested for HIV
Number of notified
TB cases
Number of TB cases
tested for HIV
Number of TB cases
diagnosed with HIV
Number of people on both
ART and TB treatment
Number of TB cases
diagnosed with HIV
Number of people on both
ART and TB treatment
2014
2015
2014
pregnantwomen
diagnosed with HIV
Number of pregnant
women
receiving ARVs
Number of
infants exposed
to HIV
Number of HIV-exposed
infants who received
prophylactic ARV
Number of HIV-exposed
infants tested
within 2 months
Number of infants
diagnosed with HIV
Estimated number of
pregnant women
Number of pregnant
women
attending ANC at least once
Number of pregnant
women
tested for HIV
1 740 435
1 166 091
1 683 915
1 034 712
44 171
39 800
44 652
40 925
(a) WHO country profile
(b) World Bank,https://datahelpdesk.worldbank.org/knowledgebase/articles/906519,accessed 24 October 2016 (c) United Nations Population Division,World Population Prospects, the 2015 Revision, http://esa.un.org/wpp/ (d) WHO, UNICEF, UNFPA, World Bank Group, and United Nations Population Division, Maternal Mortality Estimation
Inter-Agency Group estimates, 2015
(e) 2016, World population data sheet, http://www.prb.org/pdf16/prb-wpds2016-web-2016.pdf
(f) India Rapid Survey on Children 2013-14, Draft report July 2015, page 5 : http://wcd.nic.in/issnip/National_-Fact%20sheet_RSOC%20_02-07-2015.pdf
Sources: All data from the databases below unless otherwise stated
- Global AIDS Response Progress Reporting (GARPR) online reporting tool [online database].Geneva:UNAIDS,WHO,UNICEF 2016 - AIDSInfo[website].Geneva: UNAIDS;2016(http://aidsinfo.unaids.org)
- Tuberculosis (TB)[online database].Geneva:WHO;2016 (http://www.who.int/tb/country/data/profiles/en/) - National AIDS Control Organization, India
29 718 000
28 544 143
11 762 731
13 073
11 360
10 236
9 444
8 688
496
29 500 000
28 252 770
12 746 464
11 918
10 951
10 103
9 690
9 395
349
Indonesia
Cascade of HIV testing, care and treatment services, 2014–2015
H I V t e s t i n g, c a r e a n d t r e a t m e n t
Figure 1:
Cascade of diagnosis and treatment for people living with HIV
Country Statistics 2015
Population (million)
(a)Income level
(b)Life expectancy at birth (male/female)
(c)Fertility rate, total (births per woman)
(d)Infant mortality rate per 1000 live births
(e)Maternal deaths per 100,000 births
(d)Proportion of births attended by skilled health personnel
(f)257
Lower-middle-income
66.6/70.7
2.5
22.8
126
88.6%
Estimated
number of
PLHIV
Number
of people
diagnosed
Number
of people
enrolled
in care
Number
of people
on ART
Number of
people who
obtained
viral load
Number of people
who achieved
viral suppression
(<1000 copies/ml)
657 975
160 138
166 975
50 400
NA
NA
395 655
65 657 262 320
94 481
691 076
177 754
200 618
63 066
NA
NA
432 572
258 504
108 430 125 494
69 324 75 124
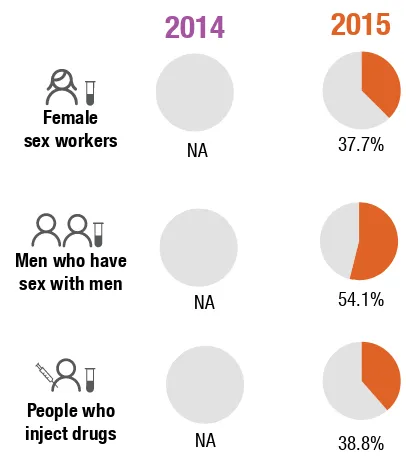
Figure 2:
Percentage of key populations who received
an HIV test and knew their results in past 12 months
2014
2015
Female
sex workers
Men who have
sex with men
People who
inject drugs
NA
2014
2015
NA
NA
38.8%
Figure 3:
Percentage of PLHIV with first CD4
count less than <200 cells/uL during
enrollement into care
PLHIV
NA
52.77%
54.1%
37.7%
Estimated
number of
PLHIV
Number
of people
diagnosed
Number
of people
enrolled
in care
Number
of people
on ART
Number of
people who
obtained
viral load
Number of people
who achieved
viral suppression
(<1000 copies/ml)
31%
receiving ARTof diagnosed
26%
of PLHIV diagnosed24%
of PLHIV diagnosed35%
receiving ARTof diagnosed
62 143
104 832 19 849
30 551
39 007
15
P r e v e n t i o n o f m o t h e r- t o - c h i l d t r a n s m i s s i o n
Figure 4:
HIV
testing
among
pregnant
women
Figure 5:
Cascade
of PMTCT
services
T B / H I V c o i n f e c t i o n
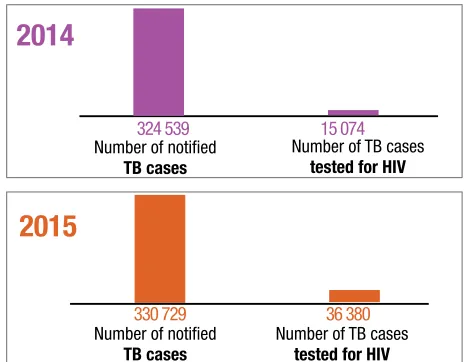
Figure 6:
HIV testing among
notified
TB cases
Figure 7:
Cascade of TB/HIV services
Number ofpregnant women
diagnosed with HIV
Number of pregnant
women
receiving ARVs
Number of
infants exposed
to HIV
Number of HIV-exposed
infants who received
prophylactic ARV
Number of HIV-exposed
infants tested
within 2 months
Number of infants
diagnosed with HIV
Estimated number of
pregnant women
Number of pregnant
women
attending ANC at least once
Number of pregnant
women
tested for HIV
Number of notified
TB cases
Number of TB cases
tested for HIV
Number of notified
TB cases
Number of TB cases
tested for HIV
Number of TB cases
diagnosed with HIV
Number of people on both
ART and TB treatment
Number of TB cases
diagnosed with HIV
Number of people on both
ART and TB treatment
2014
2015
2014
pregnantwomen
diagnosed with HIV
Number of pregnant
women
receiving ARVs
Number of
infants exposed
to HIV
Number of HIV-exposed
infants who received
prophylactic ARV
Number of HIV-exposed
infants tested
within 2 months
Number of infants
diagnosed with HIV
Estimated number of
pregnant women
Number of pregnant
women
attending ANC at least once
Number of pregnant
women
tested for HIV
330 729
36 380
324 539
15 074
2 355
624
3 523
757
(a) WHO country profile
(b) World Bank,https://datahelpdesk.worldbank.org/knowledgebase/articles/906519,accessed 24 October 2016 (c) United Nations Population Division,World Population Prospects, the 2015 Revision, http://esa.un.org/wpp/ (d) 2016, World population data sheet, http://www.prb.org/pdf16/prb-wpds2016-web-2016.pdf
(e) WHO, UNICEF, UNFPA, World Bank Group, and United Nations Population Division, Maternal Mortality Estimation Inter-Agency Group estimates, 2015
(f) Indonesia Health Profile - Family Health - Maternal Directorate, Ministry of Health
Sources: All data from the databases below unless otherwise stated
- Global AIDS Response Progress Reporting (GARPR) online reporting tool [online database].Geneva:UNAIDS,WHO,UNICEF 2016 - AIDSInfo[website].Geneva: UNAIDS;2016(http://aidsinfo.unaids.org)
- Tuberculosis (TB)[online database].Geneva:WHO;2016 (http://www.who.int/tb/country/data/profiles/en/) - Indonesian Health Profile 2015. Ministry of Health
5 136 041
5 083 301
298 050
5 382 779
5 180 091
478 489
1 660
1 174
NA
NA
539
109
3 540
1 558
NA
NA
731
76
Maldives
Cascade of HIV testing, care and treatment services, 2014–2015
H I V t e s t i n g, c a r e a n d t r e a t m e n t
Figure 1:
Cascade of diagnosis and treatment for people living with HIV
Country Statistics 2015
Population (million)
(a)Income level
(b)Life expectancy at birth (male/female)
(c)Fertility rate, total (births per woman)
(c)Infant mortality rate per 1000 live births
(d)Maternal deaths per 100,000 births
(e)Proportion of births attended by skilled health personnel
(f)0.4
Upper-middle-income
75.4/77.4
2.18
7.4
68
98.8%
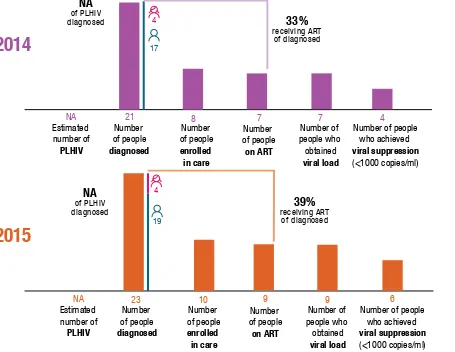
Estimated
number of
PLHIV
Number
of people
diagnosed
Number
of people
enrolled
in care
Number
of people
on ART
Number of
people who
obtained
viral load
Number of people
who achieved
viral suppression
(<1000 copies/ml)
NA
21
8
7
7
4
4
17
NA
23
10
9
9
6
19
4
Figure 2:
Percentage of key populations who received
an HIV test and knew their results in past 12 months
2014
2015
Female
sex workers
Men who have
sex with men
People who
inject drugs
NA
2014
2015
NA
NA
NA
Figure 3:
Percentage of PLHIV with first CD4
count less than <200 cells/uL during
enrollement into care
PLHIV
NA
NA
NA
NA
Estimated
number of
PLHIV
Number
of people
diagnosed
Number
of people
enrolled
in care
Number
of people
on ART
Number of
people who
obtained
viral load
Number of people
who achieved
viral suppression
(<1000 copies/ml)
33%
receiving ARTof diagnosed
NA
of PLHIV diagnosedNA
of PLHIV diagnosed39%
receiving ART17
P r e v e n t i o n o f m o t h e r- t o - c h i l d t r a n s m i s s i o n
Figure 4:
HIV
testing
among
pregnant
women
Figure 5:
Cascade
of PMTCT
services
T B / H I V c o i n f e c t i o n
Figure 6:
HIV testing among
notified
TB cases
Figure 7:
Cascade of TB/HIV services
Number ofpregnant women
diagnosed with HIV
Number of pregnant
women
receiving ARVs
Number of
infants exposed
to HIV
Number of HIV-exposed
infants who received
prophylactic ARV
Number of HIV-exposed
infants tested
within 2 months
Number of infants
diagnosed with HIV
Estimated number of
pregnant women
Number of pregnant
women
attending ANC at least once
Number of pregnant
women
tested for HIV
Number of notified
TB cases
Number of TB cases
tested for HIV
Number of notified
TB cases
Number of TB cases
tested for HIV
Number of TB cases
diagnosed with HIV
Number of people on both
ART and TB treatment
Number of TB cases
diagnosed with HIV
Number of people on both
ART and TB treatment
2014
2015
2014
pregnantwomen
diagnosed with HIV
Number of pregnant
women
receiving ARVs
Number of
infants exposed
to HIV
Number of HIV-exposed
infants who received
prophylactic ARV
Number of HIV-exposed
infants tested
within 2 months
Number of infants
diagnosed with HIV
Estimated number of
pregnant women
Number of pregnant
women
attending ANC at least once
Number of pregnant
women
tested for HIV
131
130
153
153
0
0
(a) WHO country profile
(b) World Bank,https://datahelpdesk.worldbank.org/knowledgebase/articles/906519,accessed 24 October 2016 (c) United Nations Population Division,World Population Prospects, the 2015 Revision, http://esa.un.org/wpp/ (d) WHO, UNICEF, UNFPA, World Bank Group, and United Nations Population Division, Maternal Mortality Estimation
Inter-Agency Group estimates, 2015
(e) 2016, World population data sheet, http://www.prb.org/pdf16/prb-wpds2016-web-2016.pdf (f) Millennium Development Goals Indicators. United Nations Statistics Division;2014,
http://mdgs.un.org/unsd/mdg/SeriesDetail.aspx?srid=570, accessed 26 October 2016
Sources: All data from the databases below unless otherwise stated
- Global AIDS Response Progress Reporting (GARPR) online reporting tool [online database].Geneva:UNAIDS,WHO,UNICEF 2016 - AIDSInfo[website].Geneva: UNAIDS;2016(http://aidsinfo.unaids.org)
- Tuberculosis (TB)[online database].Geneva:WHO;2016 (http://www.who.int/tb/country/data/profiles/en/)
Myanmar
Cascade of HIV testing, care and treatment services, 2014–2015
H I V t e s t i n g, c a r e a n d t r e a t m e n t
Figure 1:
Cascade of diagnosis and treatment for people living with HIV
Country Statistics 2015
Population (million)
(a)Income level
(b)Life expectancy at birth (male/female)
(a)Fertility rate, total (births per woman)
(c)Infant mortality rate per 1000 live births
(c)Maternal deaths per 100,000 births
(d)Proportion of births attended by skilled health personnel
(e)53.9
Lower-middle-income
64.6/68.5
2.3
25.9
178
78%
Estimated
number of
PLHIV
Number
of people
diagnosed
Number
of people
enrolled
in care
Number
of people
on ART
Number of
people who
obtained
viral load
Number of people
who achieved
viral suppression
(<1000 copies/ml)
211 787
117 092
113 302
85 626
9 586
8 295
224 794
138 370
120 929
106 490
9 700
8 421
142 848
81 946
77 889
Figure 2:
Percentage of key populations who received
an HIV test and knew their results in past 12 months
2014
2015
Female
sex workers
Men who have
sex with men
People who
inject drugs
NA
2014
2015
NA
22.2%
NA
Figure 3:
Percentage of PLHIV with first CD4
count less than <200 cells/uL during
enrollement into care
PLHIV
47.5%
58.5%
49.6%
45.8%
Estimated
number of
PLHIV
Number
of people
diagnosed
Number
of people
enrolled
in care
Number
of people
on ART
Number of
people who
obtained
viral load
Number of people
who achieved
viral suppression
(<1000 copies/ml)
73%
receiving ARTof diagnosed
62%
of PLHIV diagnosed55%
of PLHIV diagnosed77%
receiving ARTof diagnosed
66 375 57 468
5 532 4 805
138 993
72 794
62 164 62 164
46 321
5 500 4 701
54 928 51 138
39 305
4 086 3 594
60 481
54 554
49 022
19
P r e v e n t i o n o f m o t h e r- t o - c h i l d t r a n s m i s s i o n
Figure 4:
HIV
testing
among
pregnant
women
Figure 5:
Cascade
of PMTCT
services
T B / H I V c o i n f e c t i o n
Figure 6:
HIV testing among
notified
TB cases
Figure 7:
Cascade of TB/HIV services
Number ofpregnant women
diagnosed with HIV
Number of pregnant
women
receiving ARVs
Number of
infants exposed
to HIV
Number of HIV-exposed
infants who received
prophylactic ARV
Number of HIV-exposed
infants tested
within 2 months
Number of infants
diagnosed with HIV
Estimated number of
pregnant women
Number of pregnant
women
attending ANC at least once
Number of pregnant
women
tested for HIV
Number of notified
TB cases
Number of TB cases
tested for HIV
Number of notified
TB cases
Number of TB cases
tested for HIV
Number of TB cases
diagnosed with HIV
Number of people on both
ART and TB treatment
Number of TB cases
diagnosed with HIV
Number of people on both
ART and TB treatment
2014
2015
2014
pregnantwomen
diagnosed with HIV
Number of pregnant
women
receiving ARVs
Number of
infants exposed
to HIV
Number of HIV-exposed
infants who received
prophylactic ARV
Number of HIV-exposed
infants tested
within 2 months
Number of infants
diagnosed with HIV
Estimated number of
pregnant women
Number of pregnant
women
attending ANC at least once
Number of pregnant
women
tested for HIV
1100 000
845 623
522 108
4 138
3 790
NA
1 789
712
59
(a) United Nations Population Division,World Population Prospects, the 2015 Revision, http://esa.un.org/wpp/ (b) World Bank,https://datahelpdesk.worldbank.org/knowledgebase/articles/906519,accessed 24 October 2016 (c) Health in Myanmar, 2014.Ministry of Health
(d) WHO, UNICEF, UNFPA, World Bank Group, and United Nations Population Division, Maternal Mortality Estimation Inter-Agency Group estimates, 2015
(e) WHO, World health statistics, 2016
Sources: All data from the databases below unless otherwise stated
- Global AIDS Response Progress Reporting (GARPR) online reporting tool [online database].Geneva:UNAIDS,WHO,UNICEF 2016 - AIDSInfo[website].Geneva: UNAIDS;2016(http://aidsinfo.unaids.org)
- Tuberculosis (TB)[online database].Geneva:WHO;2016 (http://www.who.int/tb/country/data/profiles/en/)
1 107 312
934 903
793 446
22267
Nepal
Cascade of HIV testing, care and treatment services, 2014–2015
H I V t e s t i n g, c a r e a n d t r e a t m e n t
Figure 1:
Cascade of diagnosis and treatment for people living with HIV
Country Statistics 2015
Population (million)
(a)Income level
(b)Life expectancy at birth (male/female)
Fertility rate, total (births per woman)
(d)Infant mortality rate per 1000 live births
Maternal deaths per 100,000 births
Proportion of births attended by skilled health personnel
(d)28
Estimated
number of
PLHIV
Number
of people
diagnosed
Number
of people
enrolled
in care
Number
of people
on ART
Number of
people who
obtained
viral load
Number of people
who achieved
viral suppression
(<1000 copies/ml)
39 249
25 885
25 421
10 407
1 198
1 004
39 397
20 307
11 922
5 860
5 249
Figure 2:
Percentage of key populations who received
an HIV test and knew their results in past 12 months
2014
2015
Female
sex workers
Men who have
sex with men
People who
inject drugs
NA
2014
2015
NA
27.9%
Figure 3:
Percentage of PLHIV with first CD4
count less than <200 cells/uL during
enrollement into care
PLHIV
37.2%
46%
43.8%
56%
Estimated
number of
PLHIV
Number
of people
diagnosed
Number
of people
enrolled
in care
Number
of people
on ART
Number of
people who
obtained
viral load
Number of people
who achieved
viral suppression
(<1000 copies/ml)
54%
receiving ARTof diagnosed
11 778
547 466
8 743
8 529
5 640
2 795 2 567
Nepal
Cascade of HIV testing, care and treatment services, 2014–2015
H I V t e s t i n g, c a r e a n d t r e a t m e n t
Figure 1:
Cascade of diagnosis and treatment for people living with HIV
Country Statistics 2015
Population (million)
(a)Income level
(b)Life expectancy at birth (male/female)
(c)Fertility rate, total (births per woman)
Infant mortality rate per 1000 live births
(d)Maternal deaths per 100,000 births
(d)Proportion of births attended by skilled health personnel
(e)Estimated
number of
PLHIV
Number
of people
diagnosed
Number
of people
enrolled
in care
Number
of people
on ART
Number of
people who
obtained
viral load
Number of people
who achieved
viral suppression
(<1000 copies/ml)
24 450
14 947
13 524
Figure 2:
Percentage of key populations who received
an HIV test and knew their results in past 12 months
2014
2015
Female
sex workers
Men who have
sex with men
People who
inject drugs
NA
2014
2015
NA
NA
27.9%
Figure 3:
Percentage of PLHIV with first CD4
count less than <200 cells/uL during
enrollement into care
PLHIV
37.2%
46%
43.8%
56%
Estimated
number of
PLHIV
Number
of people
diagnosed
Number
of people
enrolled
in care
Number
of people
on ART
Number of
people who
obtained
viral load
Number of people
who achieved
viral suppression
(<1000 copies/ml)
40%
receiving ARTof diagnosed
57%
of PLHIV diagnosed66%
of PLHIV diagnosed25 449
13 800
651 538
10 533
21
P r e v e n t i o n o f m o t h e r- t o - c h i l d t r a n s m i s s i o n
Figure 4:
HIV
testing
among
pregnant
women
Figure 5:
Cascade
of PMTCT
services
T B / H I V c o i n f e c t i o n
Figure 6:
HIV testing among
notified
TB cases
Figure 7:
Cascade of TB/HIV services
Number ofpregnant women
diagnosed with HIV
Number of pregnant
women
receiving ARVs
Number of
infants exposed
to HIV
Number of HIV-exposed
infants who received
prophylactic ARV
Number of HIV-exposed
infants tested
within 2 months
Number of infants
diagnosed with HIV
Estimated number of
pregnant women
Number of pregnant
women
attending ANC at least once
Number of pregnant
women
tested for HIV
Number of notified
TB cases
Number of TB cases
tested for HIV
Number of notified
TB cases
Number of TB cases
tested for HIV
Number of TB cases
diagnosed with HIV
Number of people on both
ART and TB treatment
Number of TB cases
diagnosed with HIV
Number of people on both
ART and TB treatment
2014
2015
2014
pregnantwomen
diagnosed with HIV
Number of pregnant
women
receiving ARVs
Number of
infants exposed
to HIV
Number of HIV-exposed
infants who received
prophylactic ARV
Number of HIV-exposed
infants tested
within 2 months
Number of infants
diagnosed with HIV
Estimated number of
pregnant women
Number of pregnant
women
attending ANC at least once
Number of pregnant
women
tested for HIV 761 667 653 815 158 146 761 667 653 815 187 552
162 162 131 127 32 1
145 145 115 114 76 2
34 122 2 389
37 025 3 254
179 133
369 273
(a) WHO country profile
(b) World Bank,https://datahelpdesk.worldbank.org/knowledgebase/articles/906519,accessed 24 October 2016 (c) WHO, World health statistics, 2016
(d) 2016, World population data sheet, http://www.prb.org/pdf16/prb-wpds2016-web-2016.pdf (e) Millennium Development Goals Indicators. United Nations Statistics Division;2014,
http://mdgs.un.org/unsd/mdg/SeriesDetail.aspx?srid=570, accessed 26 October 2016
Sources: All data from the databases below unless otherwise stated
- Global AIDS Response Progress Reporting (GARPR) online reporting tool [online database].Geneva:UNAIDS,WHO,UNICEF 2016 - AIDSInfo[website].Geneva: UNAIDS;2016(http://aidsinfo.unaids.org)
- Tuberculosis (TB)[online database].Geneva:WHO;2016 (http://www.who.int/tb/country/data/profiles/en/) - National Centre for AIDS and STD Control, Nepal
22
Sri Lanka
Cascade of HIV testing, care and treatment services, 2014–2015
H I V t e s t i n g, c a r e a n d t r e a t m e n t
Figure 1:
Cascade of diagnosis and treatment for people living with HIV
Population (million)
(a)Income level
(b)Life expectancy at birth (male/female)
(a)Fertility rate, total (births per woman)
(c)Infant mortality rate per 1000 live births
(c)Maternal deaths per 100,000 births
(c)Proportion of births attended by skilled health personnel
(d)20.7
Lower-middle-income
71.2/78
2.1
8
30
98.6%
Estimated
number of
PLHIV
Number
of people
diagnosed
Number
of people
enrolled
in care
Number
of people
on ART
Number of
people who
obtained
viral load
Number of people
who achieved
viral suppression
(<1000 copies/ml)
3 800
1 737
896
644
325
286
4 200
1 941
947
803
333
293
2 850
1 350
1 272
Figure 2:
Percentage of key populations who received
an HIV test and knew their results in past 12 months
2014
2015
Female
sex workers
Men who have
sex with men
People who
inject drugs
33.9%
2014
2015
14.1%
8.3%
NA
Figure 3:
Percentage of PLHIV with first CD4
count less than <200 cells/uL during
enrollement into care
PLHIV
14.1%
NA
Estimated
number of
PLHIV
Number
of people
diagnosed
Number
of people
enrolled
Number
of people
on ART
Number of
people who
obtained
Number of people
who achieved
viral suppression
37%
receiving ARTof diagnosed
46%
of PLHIV diagnosed46%
of PLHIV diagnosed41%
receiving ARTof diagnosed
601 509 213 191
2 590
1 210
1 114 330
241
117 99
623
566
403
208 187
669
346
23
P r e v e n t i o n o f m o t h e r- t o - c h i l d t r a n s m i s s i o n
Figure 4:
HIV
testing
among
pregnant
women
Figure 5:
Cascade
of PMTCT
services
T B / H I V c o i n f e c t i o n
Figure 6:
HIV testing among
notified
TB cases
Figure 7:
Cascade of TB/HIV services
Number ofpregnant women
diagnosed with HIV
Number of pregnant
women
receiving ARVs
Number of
infants exposed
to HIV
Number of HIV-exposed
infants who received
prophylactic ARV
Number of HIV-exposed
infants tested
within 2 months
Number of infants
diagnosed with HIV
Estimated number of
pregnant women
Number of pregnant
women
attending ANC at least once
Number of pregnant
women
tested for HIV
Number of notified
TB cases
Number of TB cases
tested for HIV
Number of notified
TB cases
Number of TB cases
tested for HIV
Number of TB cases
diagnosed with HIV
Number of people on both
ART and TB treatment
Number of TB cases
diagnosed with HIV
Number of people on both
ART and TB treatment
2014
2015
2014
pregnantwomen
diagnosed with HIV
Number of pregnant
women
receiving ARVs
Number of
infants exposed
to HIV
Number of HIV-exposed
infants who received
prophylactic ARV
Number of HIV-exposed
infants tested
within 2 months
Number of infants
diagnosed with HIV
Estimated number of
pregnant women
Number of pregnant
women
attending ANC at least once
Number of pregnant
women
tested for HIV 377 993 359 093 168 221 377 993 368 345 262 051
9 9 7 7 7 0
(a) United Nations Population Division, World Population Prospects, the 2015 Revision, http://esa.un.org/wpp/ (b) World Bank,https://datahelpdesk.worldbank.org/knowledgebase/articles/906519,accessed 24 October 2016 (c) 2016, World population data sheet, http://www.prb.org/pdf16/prb-wpds2016-web-2016.pdf
(d) Millennium Development Goals Indicators. United Nations Statistics Division;2014, http://mdgs.un.org/unsd/mdg/SeriesDetail.aspx?srid=570, accessed 26 October 2016
Sources: All data from the databases below unless otherwise stated
- Global AIDS Response Progress Reporting (GARPR) online reporting tool [online database].Geneva:UNAIDS,WHO,UNICEF 2016 - AIDSInfo[website].Geneva: UNAIDS;2016(http://aidsinfo.unaids.org)
- Tuberculosis (TB)[online database].Geneva:WHO;2016 (http://www.who.int/tb/country/data/profiles/en/)
Thailand
Cascade of HIV testing, care and treatment services, 2014–2015
H I V t e s t i n g, c a r e a n d t r e a t m e n t
Figure 1:
Cascade of diagnosis and treatment for people living with HIV
Country Statistics 2015
Population (million)
(a)Income level
(b)Life expectancy at birth (male/female)
(a)Fertility rate, total (births per woman)
(c)Infant mortality rate per 1000 live births
(d)Maternal deaths per 100,000 births
(c)Proportion of births attended by skilled health personnel
(e)67.9
Upper-middle-income
74.1/77.6
1.6
10.5
20
99.6%
Estimated
number of
PLHIV
Number
of people
diagnosed
Number
of people
enrolled
in care
Number
of people
on ART
Number of
people who
obtained
viral load
Number of people
who achieved
viral suppression
(<1000 copies/ml)
445 503
358 047
301 959
256 630
211 546
203 264
252 460
193 043
193 549
163 229
132 391
107 990 103 831
164 498
138 730
124 239
103 556 99 433
437 700
389 027
340 220
272 750
231 794
223 372
256 100
181 600
207 104 182 369
142 529
119 330 114 971
181 923
157 851
130 221
112 464 108 401
Figure 2:
Percentage of key populations who received
an HIV test and knew their results in past 12 months
2014
2015
Female
sex workers
Men who have
sex with men
People who
inject drugs
54.19%
2014
2015
28.7%
61.3%
NA
Figure 3:
Percentage of PLHIV with first CD4
count less than <200 cells/uL during
enrollement into care
PLHIV
57.03%
57.5%
NA
NA
Estimated
number of
PLHIV
Number
of people
diagnosed
Number
of people
enrolled
in care
Number
of people
on ART
Number of
people who
obtained
viral load
Number of people
who achieved
viral suppression
(<1000 copies/ml)
72%
receiving ARTof diagnosed
70%
receiving ARTof diagnosed
80.4%
of PLHIV diagnosed
25
749 578 737 150 736 205 736 352 733 407 733 390
4 589 4 527 4 589 4 566 3 494 70
4 497 4 280 4 497 4 404 4 173 68
(a) United Nations Population Division,World Population Prospects, the 2015 Revision, http://esa.un.org/wpp/ (b) World Bank,https://datahelpdesk.worldbank.org/knowledgebase/articles/906519,accessed 24 October 2016 (c) 2016, World population data sheet, http://www.prb.org/pdf16/prb-wpds2016-web-2016.pdf
(d) WHO, UNICEF, UNFPA, World Bank Group, and United Nations Population Division, Maternal Mortality Estimation Inter-Agency Group estimates, 2015
(e) Millennium Development Goals Indicators. United Nations Statistics Division;2014, http://mdgs.un.org/unsd/mdg/SeriesDetail.aspx?srid=570, accessed 26 October 2016
Sources: All data from the databases below unless otherwise stated
- Global AIDS Response Progress Reporting (GARPR) online reporting tool [online database].Geneva:UNAIDS,WHO,UNICEF 2016 - AIDSInfo[website].Geneva: UNAIDS;2016(http://aidsinfo.unaids.org)
- Tuberculosis (TB)[online database].Geneva:WHO;2016 (http://www.who.int/tb/country/data/profiles/en/)
71 618 50 670
testing
among
pregnant
women
Figure 5:
Cascade
of PMTCT
services
T B / H I V c o i n f e c t i o n
Figure 6:
HIV testing among
notified
TB cases
Figure 7:
Cascade of TB/HIV services
Number of pregnant
women
diagnosed with HIV
Number of pregnant
women
receiving ARVs
Number of
infants exposed
to HIV
Number of HIV-exposed
infants who received
prophylactic ARV
Number of HIV-exposed
infants tested
within 2 months
Number of infants
diagnosed with HIV
Estimated number of
pregnant women
Number of pregnant
women
attending ANC at least once
Number of pregnant
women
tested for HIV
Number of notified
TB cases
Number of TB cases
tested for HIV
Number of notified
TB cases
Number of TB cases
tested for HIV
Number of TB cases
diagnosed with HIV
Number of people on both
ART and TB treatment
Number of TB cases
diagnosed with HIV
Number of people on both
ART and TB treatment
2014
2015
2014
pregnantwomen
diagnosed with HIV
Number of pregnant
women
receiving ARVs
Number of
infants exposed
to HIV
Number of HIV-exposed
infants who received
prophylactic ARV
Number of HIV-exposed
infants tested
within 2 months
Number of infants
diagnosed with HIV
Estimated number of
pregnant women
Number of pregnant
women
attending ANC at least once
Number of pregnant
women
tested for HIV
Timor Leste
Cascade of HIV testing, care and treatment services, 2014–2015
H I V t e s t i n g, c a r e a n d t r e a t m e n t
Figure 1:
Cascade of diagnosis and treatment for people living with HIV
Population (million)
(a)Income level
(b)Life expectancy at birth (male/female)
(a)Fertility rate, total (births per woman)
(c)Infant mortality rate per 1000 live births
(d)Maternal deaths per 100,000 births
(c)Proportion of births attended by skilled health personnel
(e)1.157
Lower-middle-income
66/69.5
5.7
44.7
215
63%
Estimated
number of
PLHIV
Number
of people
diagnosed
Number
of people
enrolled
in care
Number
of people
on ART
Number of
people who
obtained
viral load
Number of people
who achieved
viral suppression
(<1000 copies/ml)
464
247
203
173
0
0
542
254
201
201
0
0
277
265
137
Figure 2:
Percentage of key populations who received
an HIV test and knew their results in past 12 months
2014
2015
Female
sex workers
Men who have
sex with men
People who
inject drugs
NA
2014
2015
NA
NA
NA
Figure 3:
Percentage of PLHIV with first CD4
count less than <200 cells/uL during
enrollement into care
PLHIV
61%
43%
23%
59%
Estimated
number of
PLHIV
Number
of people
diagnosed
Number
of people
enrolled
in care
Number
of people
on ART
Number of
people who
obtained
viral load
Number of people
who achieved
viral suppression
(<1000 copies/ml)
70%
receiving ARTof diagnosed
47%
of PLHIV diagnosed53%
of PLHIV diagnosed79%
receiving ARTof diagnosed
109 109
237
227
126
100
87
121 103
86
117
27
P r e v e n t i o n o f m o t h e r- t o - c h i l d t r a n s m i s s i o n
Figure 4:
HIV
testing
among
pregnant
women
Figure 5:
Cascade
of PMTCT
services
T B / H I V c o i n f e c t i o n
Figure 6:
HIV testing among
notified
TB cases
Figure 7:
Cascade of TB/HIV services
Number of pregnant
women diagnosed
with HIV
Number of pregnant
women receiving
ARVs
Number of infants exposed
to HIV
Number of HIV-exposed
infants who received prophylactic ARV
Number of HIV-exposed infants tested
within 2 months
Number of infants diagnosed
with HIV Estimated
number of pregnant women
Number of pregnant
women attending ANC
at least once
Number of pregnant
women tested for HIV
Number of notified TB cases
Number of TB cases tested for HIV
Number of notified TB cases
Number of TB cases tested for HIV
Number of TB cases diagnosed with HIV
Number of people on both ART and TB treatment
Number of TB cases diagnosed with HIV
Number of people on both ART and TB treatment
2014
2015
2014
pregnantwomen diagnosed
with HIV
Number of pregnant
women receiving
ARVs
Number of infants exposed
to HIV
Number of HIV-exposed
infants who received prophylactic ARV
Number of HIV-exposed infants tested
within 2 months
Number of infants diagnosed
with HIV Estimated
number of pregnant women
Number of pregnant
women attending ANC
at least once
Number of pregnant
women tested for HIV
48 316 38 653 9 354 48 316 32 623 13 627
(a) United Nations Population Division,World Population Prospects, the 2015 Revision, http://esa.un.org/wpp/ (b) World Bank,https://datahelpdesk.worldbank.org/knowledgebase/articles/906519,accessed 24 October 2016 (c) 2016, World population data sheet, http://www.prb.org/pdf16/prb-wpds2016-web-2016.pdf
(d) WHO, UNICEF, UNFPA, World Bank Group, and United Nations Population Division, Maternal Mortality Estimation Inter-Agency Group estimates, 2015
(e) Millennium Development Goals Indicators. United Nations Statistics Division;2014, http://mdgs.un.org/unsd/mdg/SeriesDetail.aspx?srid=570, accessed 26 October 2016
Sources: All data from the databases below unless otherwise stated
- Global AIDS Response Progress Reporting (GARPR) online reporting tool [online database].Geneva:UNAIDS,WHO,UNICEF 2016 - AIDSInfo[website].Geneva: UNAIDS;2016(http://aidsinfo.unaids.org)
- Tuberculosis (TB)[online database].Geneva:WHO;2016 (http://www.who.int/tb/country/data/profiles/en/)