*
Corresponding author: [email protected]
Academic Decision Support System for Top Management
Leo Willyanto Santoso1* and Yulia2
1Informatics Department, Petra Christian University, Surabaya, Indonesia 2Informatics Department, Petra Christian University, Surabaya, Indonesia
Abstract. The ability to analyze and act on data is increasingly important to businesses, including in the education industry. Academic records of student of XYZ University which have been stored so far have not been used to generate some insights. XYZ University’s top-level management needs a tools to produce information from the records. The generated information is expected to support the decision-making process of top-level management. Effective business intelligence (BI) tools assist managers with decision making. BI tools provide decision-makers with the information that they need to make insightful decisions. Before starting the application development, analysis and design of the student academic records and the needs of Top-level management are done. The design stage produces a number of modeling that will be used to create the application. The final process of the development is an Academic Decision Support System application for XYZ University.
1 Introduction
Every companies process, collect and report on large volumes of data. Raw data describes the facts and figures that a company processes every day. Data are intended to represent facts and without proper preservation of the context of collection and interpretation, may become meaningles. In a education environment, each learning processes will be recorded. However, a university will learn little looking at each student data in isolation. Data becomes information after it has been processed to add context, relevance and purpose. Analysis of student data will reveal trends and patterns. Knowledge is a set of beliefs based on the relationship between pieces of information.
The ability to analyze and act on data is increasingly important to businesses, including in education industry. The pace of change requires university to be able to react quickly to changing demands from customers and environmental conditions. Although prompt action may be required, decisions are increasingly complex as university compete in a global marketplace. Rector may need to understand high volumes of data before they can make the necessary decisions. Effective business intelligence (BI) tools assist top-level management with decision making.
BI tools provide decision-makers with the information that they need to make insightful decisions. University academic data is often stored in multiple, unrelated software applications and databases. BI tools gather and process data from multiple sources. They produce reports on the information to increase the knowledge of decision-makers. Effective BI helps university identifies growth opportunities, understand student/stakeholder preferences and increase
competitiveness. BI is most effective when it is presented in user-friendly formats, such as scorecards and dashboards.
The academic data of XYZ University’ students who have been stored so far have not been used to produce information. Top-level management of XYZ University feel the need for a way to generate information from the data. The resulting information is expected to support the decision-making process by top-level management. With the data of students, XYZ University can obtain information that can support the decision-making process by top-level management. Therefore, XYZ University requires a BI tools that can produce the information needed by top-level management.
To solve this problems, this paper aims to design and implement a data warehouse for academic information system to support decision making process. The designed system is able to produce a graph that displays the student data information statistically. As a result, top management will have a dashboard to monitor the existing condition of the academic atmosphere of XYZ University. The main contributions of this paper are as follows: (1) The designed system enables the communication among different platform, including smart phones, web, and desktop application. 2) The system provides solution to the top level management in order to know the academic condition in their university. 3) the proposed system could be implemented to other university who need an academic decision support system.
2
Data
Warehouse
and
Decision
Support System
This section describes all the theories used in the developing academic decision support system at XYZ University.
Data Warehouse is a concept and combination of technologies that facilitate organizations to manage and maintain historical data obtained from operational systems or applications [1]. It helps knowledge workers (executives, managers, analysts) to make quicker and more informed decisions. Data Warehouse is a new paradigm in strategic decision making environment. Data Warehouse is not a product but an environment in which users can find strategic information [2]. Data Warehouse is a place to store information that is devoted to help make decisions [3]. The Data Warehouse contains a collection of logical data separate from the operational database and is a summary. Data Warehouse allows the integration of various types of data from a variety of applications or systems. This ensures a one-door access mechanism for management to obtain information and analyze it for decision making. Data Warehouse has several characteristics [3.4]: Subject-oriented, Integrated data, Nonvolatile, Time-Variant, and Not normalized.
Data Warehouse used data modeling technique called dimensional modeling technique. Dimensional modeling is a call-based model that supports high-level query access. Star Schema is one form of dimensional modeling scheme and contains a fact table at its center. Fact table contains descriptive attribute which is used for query and foreign key process to connect to dimension table. Decision analysis attributes consist of performance measures, operational metrics, aggregate sizes, and all other metrics needed to analyze organizational performance. Fact table shows what is supported by data warehouse for decision analysis. Dimension table surrounds center fact table. The dimension table contains attributes that describe the data entered in the fact table.
Extract, Transform, and Load (ETL) is a data integration process that extracts data from outside sources, transforms the data according to business needs, and stores it into data warehouse [2]. The data used in the ETL process can come from a variety of sources including Enterprise Resource Planning (ERP) applications, flat files, and Excel spreadsheets. ETL process is divided into three subprocesses, among others: 1. Extract, is the process of reading data from a predefined database source and extraction of some of the desired data
2. Transform, is the process of converting / converting the desired data from its initial form to the required form so that the data can be placed on another database. In this process occurs the process of merging and cleaning the data so that it can be used as needed
3. Load, is the process of writing or moving data into the desired database.
Data warehouse support decision support system. Decision Support Systems (DSS) is a computer-based system that helps decision makers use the data and models available to solve problems [5]. DSS functions combine the resources of each individual with the ability of the computer to improve the quality of the decision. DSS requires data coming from various sources to solve the problem. Every problem needs to be solved and every opportunity and strategy analysed requires data. Data is the first component of the DSS architecture. The data relate to a state that can be simulated using a model that is the second component of the DSS architecture. Some systems also have knowledge which is the third component of the DSS architecture. The fourth user interacts with the system through a user interface which is the fifth component in the DSS architecture. In building the DSS, it is necessary to plan a mature system accompanied by the preparation and incorporation of components well.
Data warehouse is widely implemented, including in the education industry. It is possible to implement data warehouse for typical university information system [6]. Academic data warehouse supports the decisional and analytical activities regarding the three major components in the university context: didactics, research, and management [7]. Data warehouse has important role in educational data analysis [8]. Data warehouse can be combined with data mining to extract useful information [9]. Data warehouse sought to establish the gaps between top management and its IT personnel in accessing, analyzing and reporting data [10]. The university needs a BI tools like data warehouse that can unlock its data in various ERPs and other operational systems [11, 12]. Research has shown universities can improving decision making in various areas using data warehousing and data mining. This includes student academic performance [13], decision support systems [14, 15] and ETL process [16].
3 System Design
XYZ University has an Academic Information System (AIS) that serves to store academic data of XYZ
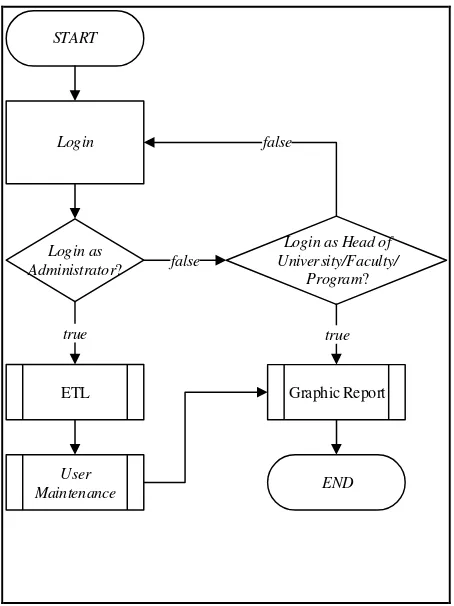
University’ students. All student academic data is stored in the database. AIS of XYZ University uses PostgreSQL to store all databases. The flowchart of proposed system can be seen in Figure 1.
START
Fig. 1. The Flowchart of System
The graph report process is a process that can be accessed by any type of login. The resulting graph reports are tailored to the login type, ie administrators, university leaders, and study promotion teams can access all student data, dean can only access student data in one faculty, and the head of school program can only access student data in school program. This process begins by asking the user to provide input in the form of graph types, aggregate functions, comparable values, comparison groups, and filters. Once the input is complete the application will output the graph according to the user request and give the user the choice to display the graph on Home or not. Then, the user can choose to save the chart settings to the database.
The process of maintaining user reports is a process accessible to administrators. This process begins by asking the administrator to input user NIP, user name, and select user type. If the selected user type is deactivated, then the administrator is requested to select the faculty unit that the user holds. If the user type selected is the head of the course, then the user is asked to select the course unit held by the user. Then, the administrator is asked to input username, password, and confirm password. If the password and confirm password are not the same, then the administrator will be notified and asked to re-input. After the input is complete, the application will store the user data in the database.
Fig. 2. The Architecture of System
As is shown in Figure 2, the architecture of proposed system was presented. OLAP tools is for users to visualize information at different levels of information when used according to requirements. The dashboard is also for users who need high levels of knowledge of the overall situation around the University of detail used for reporting.
Data Warehouse on this application using schema design in the form of star Schema. The schema design used consists of a fact table and four dimension tables. The design of star schema can be seen in Figure 3.
factMahasiswa
Fig. 3. The star schema of data warehouse
4 Implementation and Testing
In this section will be discussed about the implementation of the system in accordance with the analysis and system design. System implementation includes setting up PostgreSQL databases and application implementations.
Figure 4 shows transformation that exists in the process of extracting and transforming data for decision support system at XYZ University, that is taking data from academic database then transformed to put into student data warehouse database.
Fig. 4. Transformation Process
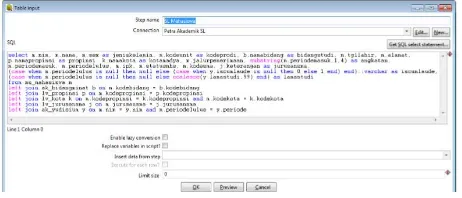
Fig. 5. The interface for data retrieval
After retrieving the data, extracting and transforming data were performed. Figure 6 shows the process of extracting and transforming data that is taking data from some tables in academic database then put into DSS database. It can be seen in Figure 6. Figure 7 shows the interface to create new schema.
Fig. 6. The extraction and transformation process
Fig. 7. The extraction and transformation process
The main page of DSS at XYZ University could be seen in Figure 8.
Fig. 8. The main page of DSS Academic
Figure 9 shows how to create new analysis. User could
press “new analysis” in the right panel. Then, choose
desired schema and cube. After analysis table showed, user can use OLAP Navigator or MDX Query Editor to create useful report. The interface of this process can be seen in Figure 9.
Fig. 9. Analysis page of DSS Academic
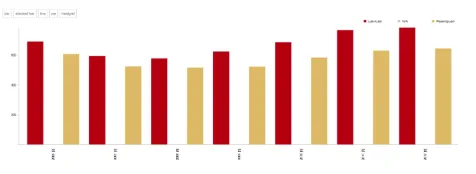
The Show Chart is used to display charts that match the data in the table. It can be seen in Figure 10.
Fig. 10. Chart page of DSS Academic
The more advanced analytic can be seen in Figure 11. User can choose the cube and create the report. User could drag and drop item dimensions in the left of column, rows or filter to produce the useful report. In this feature, it has drill through and chart activation. The sample of chart can be seen in Figure 12.
Fig. 12. The Chart of DSS Academic
To know the user's appraisal about this application, a questionnaire was distributed among seven XYZ University structural officials. The assessed indicators include application display, graphic customization features, ease of use of the application, ability to meet the user needs, and overall application. Detailed assessment of application usage can be seen in Table 1.
Table 1. Assessment of Application Usage
Indicators 1 2 3 4 5
Display app 4 3
Graphics customization feature 1 6
Ease of using 4 3
Applications meet the needs 2 3 2
Overall application 3 4
Description of the rating scale:
Value 1: Very bad
Value 2: Bad
Value 3: Enough
Value 4: Good
Value 5: Very good
Overall assessment of program feasibility: 1. The interface of application is 100% good. 2. The graphics customization feature is 100% good 3. Ease of use is 100% good
4. Applications meet the requirement needs is 60% good and 40% enough.
5. The overall application is 100% good
4 Conclusions
The developed application provides three main features, including ETL, graphic customization, and user maintenance. The features provided by the application tend to be more useful for administrators, rectors, and study promotion teams because the information provided by the application is summary.
References
1. M. Golfarelli, and S. Rizzi, A Survey on Temporal Data Warehousing. Int. Journal of Data Warehousing & Mining, 5(1), 1-17 (2009).
2. P. Ponniah, Data Warehouse Fundamentals: a Comprehensive Guide for IT Professional, 2nd ed., New York: The McGraw-Hill Companies (2010).
3. G.S. Reddy, R. Srinivasu, M.P. Rao, and S.R. Rikkula, Data Warehousing, Data Mining, OLAP
and OLTP Technologies Are Essential Elements To Support Decision-Making Process In Industries. Int. Journal on Comp. Sci. and Eng., 2(9), 2865-2873 (2010).
4. V. Gour, S.S. Sarangdevot, G.S. Tanwar, and A. Sharma, Improve Performance of Extract, Transform and Load (ETL) in Data Warehouse. Int. Journal on Comp. Sci. and Eng., 2(3), 786-789 (2010).
5. E. Turban, J.E. Aronson, T. Liang, and R. Sharda,
Decision Support and Business Intelligence Systems, 10th ed., New Jersey: Pearson Education, Inc. (2004).
6. B. Youssef, A Data Warehouse Design for A Typical University Information System, Journal of Comp. Sci. & Research, 1(6), 12-17, Dec. 2012 (2012).
7. C. Dell’Aquila, F. Di Tria, E. Lefons, and F. Tangorra, An Academic Data Warehouse, Proceedings of the 7th WSEAS Int. Conf. on Applied Informatics and Communications, Athens, Greece, August 24-26 (2007).
8. S. Mirabedini, The Role of Data warehousing in Educational Data Analysis, Journal of Novel Applied Sciences, 3(5): 1439-1445 (2014).
9. S.M. Nejres, Analysis of Data Warehousing and Data Mining in Education Domain, Int. Journal of Advances in Comp. Sci. and Tech., 4(4), April 2015, 35-38 (2015).
10. C.A. Moturi and A. Emurugat, Prototyping an Academic Data Warehouse: Case for a Public University in Kenya, British Journal of Applied Science & Technology 8(6): 550-557 (2015). 11. D.L. Heise, Data warehousing and decision making
in higher education in the United States, PhD Dissertation, Andrews University (2005).
12. D. Wierschem, J. McMillen, R. McBroom, What academia can gain from building a data warehouse, Educause Quarterly,1:41–46 (2003).
13. F. Di Tria, E. Lefons, F. Tangorra, Research Data Mart in an Academic System. In Engineering and Technology (S-CET), IEEE Spring Congress. 2012;1-5 (2012).
14. C. Dell’Aquila, F. Di Tria, E. Lefons, F. Tangorra,
Business intelligence applications for university decision makers. WSEAS Transactions on Computers. 7(7):1010-1019 (2008).
15. L. Gao, Y. Chen. Application Research of University Decision Support System based on data warehouse. In Comp. Sci. and its Applications. Springer Berlin Heidelberg, 631-637 (2015).
16. I. Mekterović, L. Brkić, and M. Baranović.
Improving the ETL process and maintenance of higher education information system data warehouse. WSEAS transactions on computers.