Demand Side Management of Household’s
Lighting Considering Energy Use and
Customer Preference: a Preliminary Study
Yusak Tanoto 1, Murtiyanto Santoso 2, Emmy Hosea 3
1, 2, 3
Electrical Engineering Department, Petra Christian University Jalan Siwalankerto 121-131 Surabaya 60236, Indonesia 1
[email protected], 2 [email protected], 3 [email protected]
Abstract— This paper presents electricity utilization and saving potential assessment for residential lighting demand side management program. The assessment involves combined Baseline Energy Use method and Analytic Hierarchy Process which represent technical and customer preference approaches, respectively. Residential lighting load curve and lamps’ share of ownership are estimated based on the first method whereas selected lamp energy saving strategy is obtained using Analytic Hierarchy Process. The selected research area is on the residential sector of Surabaya, which is the second largest city in Indonesia and involving 762,248 households represented by 384 households as survey participant. From the analysis, the city’s annual electricity consumption from lamps utilization in residential sector is estimated around 1,747 GWh. As two mostly selected saving strategies, simultaneously applying Peak Clipping in terms of switching off selected existing lamp during peak hours and Energy Efficiency in terms of existing lamps replacement with energy efficient ones would achieve annual electricity saving around 476 GWh. Moreover, around 40.8 MW peak load reduction would be potentially reached or around 7.7% reduction on Surabaya distribution system’s peak load.
Keyword-Baseline Energy Use, Analytic Hierarchy Process, Lighting, Demand Side Management
I. INTRODUCTION
Electricity utilization in domestic sector has been grown up significantly over the past decades, particularly in the developing Asian countries. Growth in electricity demand has led to the emergence of reliable and cost-efficient power supply. Historically, the opportunity to increase power system efficiency and the high cost incurred in the power system has been the key drivers to introduce Demand Side Management (DSM) [1]. For developing countries, DSM implementation has been one of major discussions as these countries are struggling to increase efficiency in power system operation and end-use appliance. Therefore, designing and implementing the most appropriate DSM activities is another big issue.
The multi-dimensional assessment framework for Residential Lighting Demand Side Management (RLDSM) was previously proposed [2]. It emphasis the need for an effective RLDSM for many developing countries to improve end-use energy efficiency and reducing cost-related electricity supply through integration four interrelated aspects consists of technical, economic, society preference, and environmental. To the authors’ best knowledge, there is no other study has been reported come up with such comprehensive framework in terms of DSM potential assessment, particularly in the end-user sector’s lighting program. A study based on Baseline Energy Use was conducted to establish actual on-hours for all lights [3]. However, there was no further explanation related to the selected lamps replacement with the energy efficient ones. In this sense, the replacement of existing lamps with the energy efficient is solely based on the similarity characteristic of luminous flux of lamp without considering other technical such as lighting load pattern and expected loading scheme.
This paper is focused on the application of Baseline Energy Use method and Analytic Hierarchy Process to construct an estimation of residential sector’s lighting load curve and to develop a decision making model for selecting the most appropriate saving strategy, respectively. The first method is used to collect essential information regarding to the lamps utilization pattern and its share of ownership whereas the second method is applied to get customer preference in terms of appropriate DSM loading scheme with respect to the lamps utilization. Results obtained from the two methods are then combined to estimate the amount of residential lighting annual energy use and its potential saving. This paper is organized as follows; the method used in the study is presented in the next section, results and discussion is followed subsequently, and finally conclusion is presented.
II. METHODOLOGY
power and energy saving potential, three broad stages are conducted in this research as follows: Firstly, this study is referred to the proposed framework of RLDSM previously mentioned in earlier section; Secondly, a survey of lamp utilization in selected study area is carried out; Thirdly, multi-criteria decision making method and baseline energy use method are used, respectively in order to reveal research objectives. The two methods and survey of lamp utilization are briefly described as follows.
A. Analytic Hierarchy Process
Analytic Hierarchy Process (AHP) is a decision-making analysis method based on the principle of mathematics developed by Thomas L. Saaty [4]. In this study, the model is consists of three-class hierarchy, i.e. purpose, criteria, and strategy. Four strategies in which this study considered are: Peak Clipping, Valley Filling, Load Shifting, and Energy Efficiency. To help respondents understand the proposed strategy, explanation related to the proposed strategies is given as follows:
• Peak clipping can be achieved by turning off a few lamps on peak load (peak hours). • Valley filling can be achieved by maximizing the use of lamp off peak hours.
• Load shifting can be achieved by turning off some lamps during peak hours and still turn on lamps off peak hours.
• Energy efficiency can be achieved by turning off some lamps all day or replace it with more energy efficient types.
Meanwhile, six criteria are given as the second hierarchy of the model, which consist of actions to be done by respondent, as follows:
• Willing to switch off lamp during peak hours • Willing to maximize lamp utilization • Willing to reduce the amount of lamp • Willing to add the amount of lamp
• Willing to replace existing lamp with more energy efficient ones • Willing to manage lamp’s time of use
Altogether, six criteria and four strategies are later used to develop the proposed multi criteria decision model of which the purpose or goal is to obtain appropriate lighting loading pattern in the framework of RLDSM. Respondents were asked to provide assessment on a scale of numbers 1 through 9 for each pair wise comparison of the given criteria. In this case, there were 15 comparisons that must be weighted between the two criteria with scale numbers 1 through 9. Meanwhile, for each criterion, each strategy pairwise comparison was made with one another. Suppose, for the criteria "Willing to switch off lamp during peak hours, Peak Clipping should be compared to Valley filling and so on in the same way for the rest strategies. In overall there are 6 comparisons pairs for each criterion. On the other hand, pairwise comparison matrix will be of the order-4 because it consists of four strategies. Thus, a Random Index value to be used is 0.90 [5].
B. Baseline Energy Use
On this analysis, BEU is used as a reference to calculate the current energy use through lamp utilization. In particular, BEU in this study relates to: number of household, operating hour of each lamp, and various type of lamp. Those required data are taken from survey to individual household that has the same participants with Section A. Characterization of basic energy use include:
1) The number of lamps for each type of lamp: Used to determine the amount of lamp for the entire household population. In addition, the total amount of available lamp can be estimated, and diversity factor can be determined. It is obtained by conducting survey.
2) The average number of lamps per household: Used to determine the type of lamps that are widely used in the study area. The number of lamps for each type of lamp is calculated based on the ratio between number of specific lamp type having certain wattage which is obtained from the survey and number of survey participants (sample size).
3) The total number of lights in the household sector: It is estimated based on the number of specific lamp type, sample size, and number of electrified households. This information is useful for determining the composition of lamp ownership (the share of ownership).
4) The average time use of lamp per day: It is determined based on total number of operating hour of the lamp type in the surveyed households and total number of lamp type in the surveyed households.
C. Survey for Lamp Utilization
was followed to the minimum sample requirement with margin of error of 5%, confidence level of 95%. Therefore, a total number of required samples were 384 respondents which is equivalent to the same number of surveyed households, considering 762,248 household in Surabaya. All respondents are assumed to take part in the RLDSM program. The questionnaire was distributed randomly through the whole area of the city. The survey participants are asked to fill up the questionnaire consisting questions about the type of lamps used in their household, the location of each lamps, the lamp’s wattage, and daily operating hour for each lamp. In this survey, three types of lamps, i.e. Incandescent Lamp (IL), Fluorescent Lamp (FL) or Tubular Lamp (TL), and Compact Fluorescent Lamp (CFL) are considered to be asked for their availability. The questionnaire is adopted from [6] and thus further developed. Besides, question related to the customer preference towards appropriate lamp loading strategy in accordance to RLDSM is also included in the questionnaire. All questions in this section, included assessment for pair wise comparison between one criterion to another and comparison between each proposed strategy within certain criterion should be answered, respectively.
III.RESULTS AND DISCUSSION
A. Preferred Strategy on Lamp Loading
Priorities or criteria order and their respective weight with respect to the modelling purpose are presented in Table 1 along with the modelling summary in terms of selected lamp loading strategy and its number of household represented for all respondents in Surabaya.
TABLE I
Priorities Order, Selected Lamp Loading Strategy, and Its Composition Representation in Surabaya
Priority (criteria) Weight Strategy Weight
Number of Household Represented
Share (%)
Willing to replace existing lamp with more
energy efficient ones 0.303
Energy
Efficiency 0.411 313,284 41.1 Willing to switch off lamp during peak hours 0.202 Peak Clipping 0.216 164,646 21.6 Willing to manage lamp’s time of use 0.188 Load Shifting 0.207 157,785 20.7 Willing to maximize lamp utilization 0.121 Valley Filling 0.166 88,421 11.6 Willing to reduce the amount of lamp 0.114
Willing to add the amount of lamp 0.071 Total 1.000 762,248 100
Of the total sample for the entire area of Surabaya, it appears that Energy Efficiency ranks first preference of all alternative strategies proposed, followed by Peak Clipping and Load Shifting. This finding is consistent with the order of preference criteria, namely “Willing to replace existing lamp with more energy efficient ones", "Willing to switch off lamp during peak hours ", and "Willing to manage lamp’s time of use”.
B. Estimation of Daily Loading Curve on Lamp Utilization
TABLE II
Selected Lamps Utilization Characteristics in Surabaya*
Lamp’s Type
*Based on Survey 2012; IL: Incandescent Lamp, TL: Tubular Lamp (fluorescent lamp), CFL: Compact Fluorescent Lamp
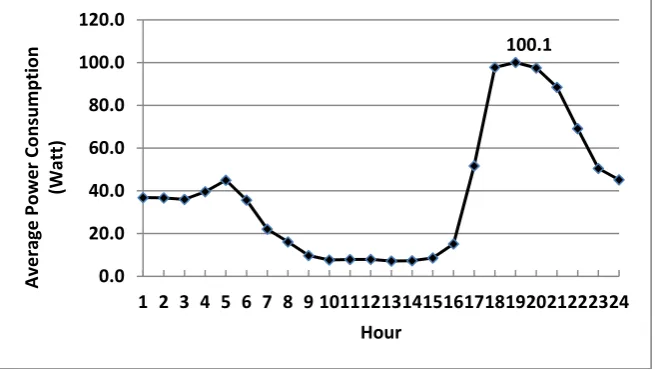
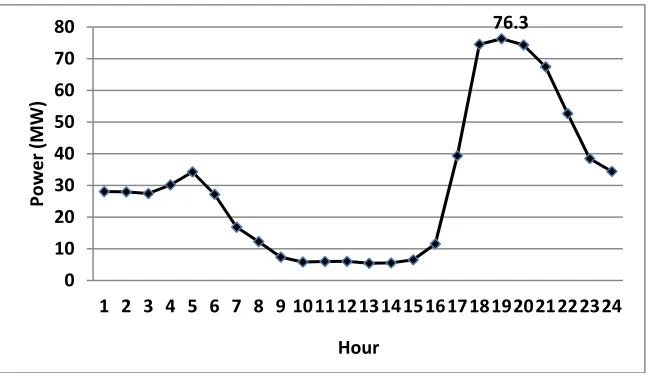
From Table 2, lamps’ share of ownership is obtained for the three types of lamps in the city of Surabaya are of 4.7%, 14.1%, and 77.4% for IL, TL, and CFL, respectively. It also showed that CFL 18 W is the most widely used (16.6%) in all households, while IL 25 W light bulbs are of the least used, i.e. 0.3%. As shown in the table above, the TL 40 W has the average longest usage time, i.e. 11 hours/day whereas CFL 14 W has an average shortest usage time for 3.2 hours/day. Fig. 1 and Fig. 2 [7] depict estimation of typical lighting load curve per household and for residential sector in Surabaya, respectively. The curve is constructed based on each lamp’s wattage and their hourly usage. The peak load of lamp power consumption per household is estimated to be occurred at 7 PM with 100.1 W. Data consisting all lamps power rating together with their total hourly usage as gathered in Fig. 1 are tabulated to obtain hourly total lamp power (W). Divided the hourly total power into total number of participant, the average hourly lamp power consumption per household can be determined. Similarly, multiplying average hourly lamp power consumption per household with total number of electrified households, the estimates lighting load curve for residential sector in Surabaya can be obtained, as seen in Fig. 2. The peak load for residential lighting load in Surabaya estimated to be occurred at 7 PM with 76.3 MW.
Fig. 1. Estimation of typical lighting load curve per household in Surabaya (Survey 2012) 100.1
1 2 3 4 5 6 7 8 9 101112131415161718192021222324
Average Power Consumption
(Watt)
Fig. 2. Estimation of typical lighting load pattern for residential sector in Surabaya (Survey 2012)
C. Power and Energy saving Potential
Power and energy saving potential that could be achieved through implementation of RLDSM can be appropriately estimated using BEU and AHP analysis. From BEU, the share of ownership in terms of lamp types and wattages can be revealed. By knowing the lamp share of ownership, we can further determine power and energy saving potential based on total amount of existing lamp and its time of use. Here, we categorize them as “standard lamp”, consist of IL and TL-T12 and TL-T8, which can probably replaced by energy efficient ones. This is possible if the composition of standard lamp is in domination. On other possibility where the CFL have already in common use, then saving potential could be achieved by two ways at once, i.e. by replacing any remaining standard lamp with energy efficient ones and implementing energy conservation or demand management. Meanwhile, residential customer preference with respect to the strategy of lamp utilization in their household can be pointed out. In this sense, customers are involved in such a way to choose individually what loading strategy that might be appropriated thus to be implemented to support the RLDSM activity. Result obtained from AHP analysis may also be useful as complementary and performed as control function that shows whether selected loading and saving strategy are matched with that expected by stakeholders.
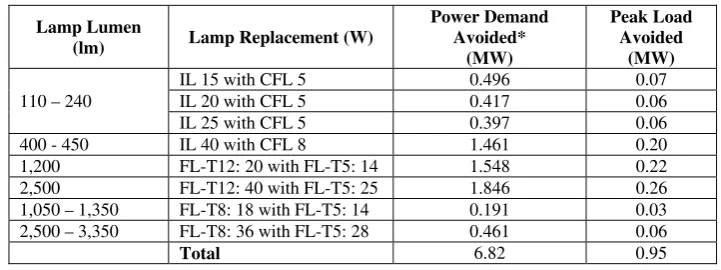
Results given by AHP analysis showed that Energy Efficiency strategy is the most widely chosen followed by Peak Clipping strategy. If we refer to the results obtained in BEU analysis, which is CFL have the highest share in comparison with other types of lights and on the other hand there are the potential savings that can be obtained from the replacement of IL and TL, then Energy Efficiency and Peak Clipping strategy is the right choice to run, with the activity mechanism of turning off the lights during peak periods and replacement bulbs to energy efficient lamp types. The authors believed that application of the BEU method for light loading conditions today will be different when compared with, for example, 10-15 years ago, where the use of CFL still limited. During its development, activity that can be done related to lighting DSM will not only limited to the replacement of the lamp but also in the form of energy conservation (turning off lamps) and load management (Load Shifting). In this study, taking into account the BEU and AHP analysis, power and energy saving potential for the case study proposed for the city of Surabaya is achieved through two mechanisms, as following: The first mechanism: Replacement of IL and FL or TL with the type of CFL and TL lamps having smaller diameter (more energy efficient); The second mechanism: Turn off lights during peak hours (energy conservation through the implementation of strategies Peak Clipping). The first mechanism is proposed by considering the availability of the size of the replacement bulbs on the market. Based on the available number of lamp in the study area, lamp replacement options along with their saving potential are given in Table 3.
76.3
0 10 20 30 40 50 60 70 80
1 2 3 4 5 6 7 8 9 101112131415161718192021222324
Power (MW)
TABLE III
Power Saving Estimation by Replacing Standard Lamps with Energy Efficient Lamps
Lamp Lumen
(lm) Lamp Replacement (W)
Power Demand Avoided*
(MW)
Peak Load Avoided
(MW)
110 – 240
IL 15 with CFL 5 0.496 0.07
IL 20 with CFL 5 0.417 0.06
IL 25 with CFL 5 0.397 0.06
400 - 450 IL 40 with CFL 8 1.461 0.20
1,200 FL-T12: 20 with FL-T5: 14 1.548 0.22 2,500 FL-T12: 40 with FL-T5: 25 1.846 0.26 1,050 – 1,350 FL-T8: 18 with FL-T5: 14 0.191 0.03 2,500 – 3,350 FL-T8: 36 with FL-T5: 28 0.461 0.06
Total 6.82 0.95
*Not considering power drawn by lamp ballast
In this study, we consider lamp replacement such as for IL not only based on the suitability of lamp lumen, but also based on the available lamp in the market, and more important if the CFL lamp replacement is giving smaller power consumption than IL. On the other hand, the replacement of CFL 5 W may give benefits in the form of increase lumens per lighting for areas where IL is replaced by CFLs. Meanwhile, possible treatment for TL is to change the T12 type (tube diameter 38 mm) with the latest FL-T5 (tube diameter 16 mm). Similarly, FL-T8 (diameter 16 mm) is maintained largely because the power consumption of the lumen possessed relatively the same or smaller than CFL. For example, TL 10 W has approximately 650 lm, compared with CFL 11 W with 660 lm, or TL 15 W has the same powerful illumination compared to CFL 17 W, which is 950 lm, except for TL 18 W (1.050 to 1.350 lm) allows to be replaced with TL 14 W (T5: 1,200 W), and TL 36 W (2.500 to 3.350 lm) is proposed to be replaced with TL 28 W (T5: 2,600 lm).
With regard to the lamp utilization characteristics as presented in earlier section, power reduction for each lamp type and wattage can be determined by simply subtracting total power consumption for certain lamp type within the study area with its total power consumption of replaced lamp. For example, the power avoided for replacing IL 25 W with CFL 5 W taken into account around 19,850 pieces IL 25 W available as existing lamp could result approximately 397,000 W of power avoided. Meanwhile, the value of peak load reduction is obtained by taking into account the reduction of power consumption, the estimated total number of lamps, Peak Coincidence Factors (PEC) and distribution losses in the power transmission and distribution networks. In the study of lamp loading cases, PEC is taken as the ratio between the total power-demand of lamps during peak hours with the system peak load. In this regards, the data of distribution system peak load of Surabaya (system peak load) is utilized as reference. Thus, combination of the first and second mechanism will result the estimation of average daily lighting load curve in the residential sector in Surabaya, i.e. average lighting power consumption per household as presented graphically in Fig. 3 whereas the residential sector lighting load pattern in Surabaya is followed subsequently in Fig. 4.
Fig. 3. Estimation of daily lighting load curve in residential sector in Surabaya with Peak Clipping and Energy Efficiency (Lamp replacement)
0 100
1 2 3 4 5 6 7 8 9 101112131415161718192021222324
Power (Watt)
Hour
Estimation of daily lighting load curve in
residential sector in Surabaya with Peak Clipping
Energy Efficiency
(Lamp replacement)
Fig. 4. Estimation of lighting load pattern in overall residential sector in Surabaya with Peak Clipping and Energy Efficiency (lamp replacement)
From Fig. 3 and Fig. 4, we can see that the implementation of Peak Clipping strategy simultaneously with Energy Efficient-lamp replacement may result in two positive impacts:
• Additional potential load reduction per household lamps and for all households during peak hours respectively for 2.69 W (from 62.43 W to 59.74 W) and 2.1 MW (47.6 MW of the 45.5 MW), making a total potential lamp load reduction per household and for the household sector during peak hours (at 7 PM)) for 40.39 W and 30.8 MW, respectively.
• Potential of peak load reduction for distribution system of Surabaya (at 7 PM) amounted to 40.8 MW, or from 525.7 MW to 484.9 MW, which is obtained from the difference before and after the imposition of Peak Clipping strategy. Thus, there is a potential decrease in overall system’s peak load of approximately 7.7%.
Energy use and energy saving of the above mechanisms can be determined by observing the number of available lamps, the average time of use, power consumption, and the diversity factor (DF). DF or can be called utility factor is the size of the index, where in the entire population of the equipment, in this case lamps; some of the lamps are not used. DF of each type of lamps can be determined for each hour as the ratio of the lamp that was turned on in a given period to the total amount of lamps available. Meanwhile, the potential for energy saving in this study not only achieved from the replacement of lamps with energy efficient ones, but also could be achieved by the implementation of Peak Clipping strategy.
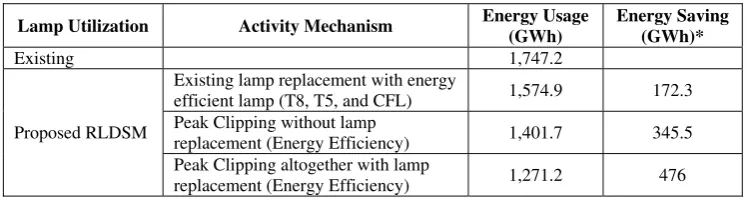
In general, the total energy saving potential from RLDSM is an aggregate of the saving program obtained from all participants. In this sense, Energy saving potential which can be harvested represents the amount of power generation that can be avoided. Calculation for energy saving is made on the same principle with calculation of peak load reduction. Recapitulation of all possible mechanisms is shown in Table 4 below.
TABLE IV
Energy Usage and Saving Potential for RLDSM in Surabaya
Lamp Utilization Activity Mechanism Energy Usage (GWh)
Energy Saving (GWh)*
Existing 1,747.2
Proposed RLDSM
Existing lamp replacement with energy
efficient lamp (T8, T5, and CFL) 1,574.9 172.3 Peak Clipping without lamp
replacement (Energy Efficiency) 1,401.7 345.5 Peak Clipping altogether with lamp
replacement (Energy Efficiency) 1,271.2 476
From Table 3, we can see that electricity utilization along with its saving potential which are obtained from RLDSM activities derived from two broad mechanisms, i.e. lamp replacement and Peak Clipping implementation. Among all proposed strategies of which technically analysed, the maximum saving potential of around 476 GWh or 27.2% compared to the existing lamp loading could be obtained from the implementation of Peak Clipping strategy simultaneously with Energy Efficiency.
From the BEU analysis, it is revealed that saving potential obtained from existing lamp replacement with energy efficient ones, i.e. CFL and FL-T8, is not appeared to be significant in terms of the amount of energy saving. This is due to the fact obtained from the survey that the lamp ownership proportion for IL and FL-T8, of
0.0 20.0 40.0 60.0
1 2 3 4 5 6 7 8 9 101112131415161718192021222324
Power (MW)
Hour
Estimation of lighting load pattern in overall
residential sector in Surabaya with Peak Clipping
and Energy Efficiency (Lamp Replacement)
which suggested to be replaced, are relatively few compared to the widely used CFL. However, there would be improvement if the lamp replacement mechanism is combined with Peak Clipping strategy. By then, the potential saving is estimated to increase more than 100%. Such “hybrid” way of approach could possibly be implemented since Energy Efficiency and peak Clipping are both the most preferred lamp loading strategy by the residential customer in Surabaya, represented by the survey respondent.
IV.CONCLUSION
In this study, power and energy saving potential of RLDSM is assessed using the proposed multi-dimensional assessment framework. The paper presents preliminary study of which using BEU and AHP method to reveal several study objectives such as developing typical household daily load curve, residential sector’s lighting load pattern, obtaining the most appropriate lighting loading strategy to support effective RLDSM, and power and energy saving potential. From the analysis of RLDSM program for Surabaya, it is found the share of ownership of CFL is the highest followed by TL and IL, amounted to 77.6%, 14%, and 4.7%, respectively coupled with a mix all three types of lamp for the total sample for around 3.5%. The proposed loading strategy lights in accordance with the loading conditions under for the city of Surabaya is the replacement of existing “standard” lamps with more energy efficient lamps which represents the implementation of the Energy Efficiency strategy and implementation of Peak Clipping strategy, simultaneously, where the potential for electrical energy savings can be achieved up to 27.2% of the existing loading conditions. Potential reduction in peak load power distribution system Surabaya (at 7 PM) amounted to be around 40.8 MW, or decrease from 525.7 MW to 484.9 MW. Thus, there is a potential decrease in overall system peak load by around 7.7%. The following research activity will include the role of economic analysis and emission mitigation impact, as well as study the opportunity of applying Light Emitting Diode lighting in the RLDSM program.
ACKNOWLEDGMENT
This paper is written as part of research activity report of which conducted under Directorate General of Higher Education Agreement Letter No.0004/E5.2/PL/2012 based on the scheme:”Decentralization-Competitive Research Grant 2013”. Therefore, the authors would like to convey their gratitude to the Ministry of Education and Culture, Directorate General of Higher Education for providing the grant through such scheme. In addition, the authors would like to thank anonymous reviewers of the journal for providing helpful comments of the submitted paper. However, the authors only are responsible for any remaining error in the paper.
REFERENCES
[1] G. Strbac, “Demand side management: Benefits and challenges,” Energy Policy, vol. 36, pp. 4419-4426, Dec. 2008.
[2] Y. Tanoto, M. Santoso, E. Hosea, “Multi-dimensional assessment for residential lighting demand side management: A proposed framework,” Applied Mechanics and Materials, vols. 284-287, pp3612-3616, Jan. 2013.
[3] L.S. Tribwell, D.I. Lerman. (1996) Baseline residential lighting energy use study. [Online]. Available: [4] http://eec.ucdavis.edu/ACEEE/1994- 96/1996/VOL03/153.PDF, 1996.
[5] T. L. Saaty, “Decision making with the analytic hierarchy process,” Int. J. Services Sciences, vol.1, pp. 83 – 98, 2008.
[6] S. Vashishtha, M. Ramachandran,“Multicriteria evaluation of Demand Side Management (DSM) implementation strategies in the Indian power sector,”Energy, vol. 31, pp. 2210–2225, Jul 2003.