w
University of Oulu, Finland & Petra Christian University, Indonesia
Liang Ye [email protected]
University of Oulu, Finland & Harbin Institute of Technology, China
Tian Han [email protected]
Zhu Zhang [email protected]
Guobing Sun [email protected]
University of Oulu, Finland & Harbin University of Science and Technology, China
Tuija Huuki [email protected]
Tapio Sepp¨anen [email protected]
Esko Alasaarela [email protected]
University of Oulu, Finland
Abstract
This research studied violence detection from less than 6-second ECG signals. Features were calculated based on the Bivariate Empirical Mode Decomposition (BEMD) and the Recurrence Quantification Analysis (RQA) applied to ECG signals from violence simu-lation in a primary school, involving 12 pupils from two grades. The feature sets were fed to a kNN classifier and tested using 10-fold cross validation and leave-one-subject-out (LOSO) validation in subject-dependent and subject-independent training models respec-tively. Features from BEMD outperformed the ones from RQA in both 10-fold cross validation, i.e. 88% vs. 73% (2nd grade pupils) and 87% vs. 81% (5th grade pupils), and LOSO validation, i.e. 77% vs. 75% (2nd grade pupils) and 80% vs. 76% (5th grade pupils), but have larger variation than the ones from RQA in both validations. Average performances for subject-specific system in 10-fold cross validation were 100% vs. 93% (2nd grade pupils) and 100% vs. 97% (5th grade pupils) for features from the BEMD and the RQA respectively. The results indicate that ECG signals as short as 6 seconds can be used successfully to detect violent events using subject-specific classifiers.
Keywords: violence detection, bivariate empirical mode decomposition, recurrence quan-tification analysis
1. Introduction
Harmful action, which have been identified as violence, bullying and harassment occur in a variety of contexts during childhood, adolescence and adulthood - taking place even where children should be safe such as schools. It is a worldwide problem that has serious mental and physical consequences not only for those involved, but also as associated costs for families, schools organizations and society [1]. Research indicates that victims have concentration problems at school [2], experience learning difficulties, driving them to school disaffection [3] and school refusal [4]. Violence and harassment have also been reported generating high stress levels and low self-esteem, self-harm and even suicide [5, 6].
Works on tackling violent, bullying and harassment have come from many different quar-ters from governments creating laws for dealing with it and drawing up legal guidelines
c
for organizations to follow with the aim of preventing violence, to practitioners developing models of intervention. However, the developed strategies do not appear to make a lasting difference [7]. Young people continue feeling left alone with the problem of peer violence. Most victims do not report what they are suffering to peers, parents and school personnel because they feel ashamed, fear revenge from their perpetrators and blame themselves for what is happening [8]. Moreover, few victims believe that real action will be taken by schools to improve the situation [9]. Few children who could talk about it with parents or teachers and are ill-equipped to know how to deal with harassing comments are continuously feeling left alone with the problem of peer violence [10].
One of the recommendations from the United Nation study on violence against children is to prioritize prevention [11]. Protecting children from violence was the main agenda in the European Forum on the right of the child in 2012, 2013, and 2015 [12]. In addition, the child protection from violence was written in Article 19 of UN Convention on the Rights of the Child (UNCRC) [13]. Those show that protecting children against violence is a big issue nowadays. Unnecessary to further highlight, violence targeted to young people relations remains one of the biggest challenges in the world.
Several attempts have been made to recognize violent event based on various modalities and most of them used video and audio signals. Ribeiro et al. [14] and Zhang et al. [15] utilized video from CCTV to evaluate if violent events occurred. Gao et al. [16] analyzed video from public violent database to identify such event in hockey and crowd. Penet et al. [17] proposed a model using audio signal to detect violent events in movies. Different from the above attempts, Fleureau et al. [18] detected violent events in movies based on electrodermal activity (EDA) of the subjects while watching selected movies.
Although these attempts provided interesting results, the systems were built based on the witnesses' point of view, not the victims'. The application of the systems based on the former issue is limited. Such systems failed to detect violent events when there is no supporting equipment. To our knowledge, no previous studies have investigated the later issue. Promising applications for this research in near future is child protection against violence.
We aim to approach the problem from a new perspective by investigating possibility to use ultra-short ECG signals to identify or detect violent events from the victims’ point of view. The wide availability of commercial devices for ECG signal recording makes this attempt feasible today. Moreover, rapid advances in smartphone technology enable running complex algorithms such as pattern recognition in real-time.
One of the most popular methods to analyze ECG is through Heart Rate Variability (HRV) signal, derived as variation of time difference between consecutive R-peaks in ECG signals. Unfortunately, HRV analysis requires at least 5 minutes, even hours, length to guarantee its reliability [19]. Considering that a violent event can occur in just a few seconds, methods that work with ultra-short ECG signals are needed.
A promising method to analyze the ultra-short ECG signal is the Bivariate Empirical Mode Decomposition (BEMD). Agrafioti et al. [20] applied this method to 5-second ECG signals to get a set of features for emotion detection with good results. Ferdinando et al. [21] also applied it to ECG signals from the Mahnob-HCI database to get features for emotion recognition. The accuracies for valence and arousal were improved by around 12% from the baseline in [22], which used standard HRV analysis.
uti-lized it in analyzing P-P intervals measurement in post infraction patient from ambulatory ECG, Yang [25] applied it to 38 to 104 second ECG signals from PhysioNet Physikalisch-Technische Bundesanstalt database for Myocardial infarction (MI) detection, Guo et al. [26] used it for 60 seconds ECG signals to study functional and structural changes in the pulse noninvasively. The RQA provides good information even for short non-stationary and non-linear signals [27].
This paper seeks to address the following questions: 1) is it possible to detect violent events based on ultra-short ECG signal; 2) which method, BEMD or RQA, is more suit-able to extract features for violence detection, justified based on the performance of the k-nearest neighbor (kNN) classifier on both subject-independent and subject-dependent classifier models using 10-fold cross validation and leave-one-subject-out (LOSO) valida-tion. To our knowledge, this is the first study to investigate methods to detect violence events based on ultra-short ECG signals analysis from the victims' point of view. The finding should make an important contribution in pattern recognition research, especially related to violence detection, which can be used in violence intervention programs in schools.
2. Materials and Method 2.1 Data
Twelve pupils, from 2nd and 5th grade, from a primary school in Harbin, China, were involved in the violence simulation; six from each grade, three girls (ID #1 to #3) and three boys (ID #4 to #6), with no cardiovascular diseases and in healthy condition. The permission from the board of the school was acquired before the study.
ECG signals were recorded from each pupil using commercial wearable sensor able to measure ECG (250 Hz), respiration (25 Hz), and movements (using 3D accelerometer at 100 Hz) synchronously, which was secured on the chest using a strap. The strap was designed originally for adults and therefore needed some manual adjustment to make it fit for children. While placing the strap the positions of the electrodes were carefully selected, especially when the pupils were skinny. A tradeoff between comfortable use, not too tight, and good quality data acquisition, good skin-electrodes contact, was made.
The pupils from each grade separately acted or simulated violent situations in a room with mattresses on the floor to avoid injuries. A video camera was used to record the whole simulation for annotation purposes. The data acquisitions were monitored via a computer to check if electrodes lost contact to the skin.
A feeling meter was distributed to pupils at the beginning to record how they felt before the simulation started. The feeling meter contained three questions related to the level of Valence, Arousal and Dominance. To help them understand these terminologies, some related words were added with pictures from Self-Assessment Manikin (SAM).
The simulation started with five pupils angrily/loudly shouting to the other. It was followed by some physical games to simulate several possible physical violent events. Each event was repeated three times.
Further, we recorded emotional utterances of the pupils with three daily life sentences in normal and five basic discrete emotions, i.e. anger, fear, happiness, sadness, and surprise. Each emotional sentence was repeated five times. At the end of the recording, the second feeling meter was distributed to measure how they felt in the middle of the simulations.
physical violent when the victim walks in a corridor and gets hit by anothers shoulder from front). Non-violent events involved running, walking, playing which involved movements and jumping. The violent simulation idea was inspired by the work of Ye et al. [28].
The final session was relaxation time to release the emotional feeling during the activities. The pupils were asked to lay down on the mattress and listen to peaceful musics. At the end of the relaxation, they filled the last feeling meter to see if the relaxation restored their emotions. The whole simulation took around 1.5 hours for each grade.
2.2 ECG Preprocessing
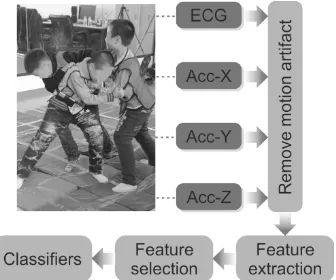
Fig. 1 presents the block diagram used in this study. Based on the visual inspection, data from three pupils were discarded because the signals were corrupted due skin-electrodes contact problem, such that it was impossible to recognize PQRST, especially R, waves in ECG. Next, ECG and 3D acceleration signals were segmented according to violent and non-violent events based on the video recording, such that ECG signal length was six seconds in each case.
Fig. 1: Block diagram of the system shows that four signals were acquired from simulations. Signals from
accelerometer (Acc) were used to estimate motion artifact and remove this artifact from ECG.
Motion artifacts were present because the pupils were free to move as in normal daily activities. To remove motion artifacts, an algorithm called Stationary Wavelet Motion Artifact Reduction (SWMAR) [29] was used. It uses the signal from 3D accelerometer to detect the motion and estimate motion artifact signals. The estimated motion artifacts are then subtracted from ECG signals.
2.3 Features from the Bivariate Empirical Mode Decomposition
2.4 Features from the Recurrence Quantification Analysis
Parameters for RQA analysis are dimension (M) and time-delay (Delta). The calculation was based on the implementation by Ouyang et al. [23]. Features are Recurrence Rate (RR), Determinism (DET), Entropy (ENTR), and Averaged diagonal line (L). During experiments using RQA it was found that the dimension parameter could not be larger than ten in order not to degrade the performance. The time-delay parameter, however, had a small effect and the search was limited from 5 to 25 samples with 5 steps. Although the number of features using RQA is only four, we also applied sequential forward floating search procedure to get sets of features which offer good performance for each parameter combination.
2.5 Classifier and Validation Methods
The k-nearest neighbor (kNN) classifier was chosen for the 2-class problem as it is compu-tationally light to be run in a smartphone as the ultimate goal of our project. We validated the classifiers with a dependent and independent approaches. The subject-dependent classifier was built for each grade and validated using 10-fold cross validation. For 10-fold cross validation, 20% of the data was held out for validation while the remain-ing data was used to design and test the classifier. The experiments were repeated for 100 times with new resampling each time and average of the performance is reported. For the subject-independent classifier, we excluded all samples from certain subject for testing while building the model using the remaining samples. This process was repeated for all subjects and the reported accuracy is the average over all subjects accuracy. We called this validation as leave-one-subject-out (LOSO).
Last, we optimized the classifier for each subject as a subject-specific classifier and val-idated the result with 10-fold cross validation. Here, we developed a model with specific parameter combination for each subject and evaluated the performance. Reported accu-racy is the average over all subjects accuaccu-racy. All methods were implemented and tested in MatlabTM.
3. Experiments
3.1 Motion Artifact Removal
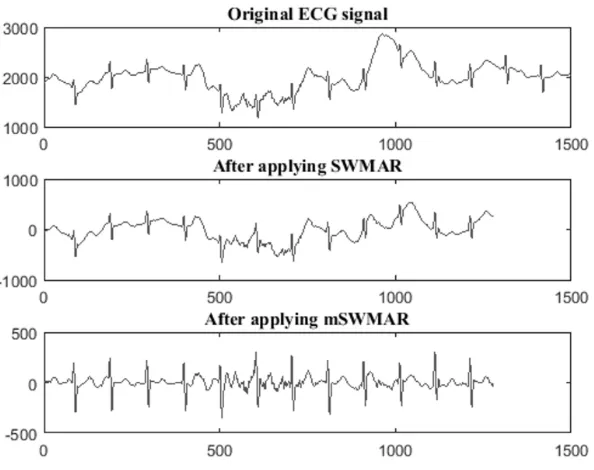
Figure 2 (top) shows an example where ECG signal suffers from motion artifacts. Applying original SWMAR did not completely remove this artifact, see Fig. 2 (middle). The original SWMAR algorithm was developed to remove motion artifact from equine ECG measured from horses in the stall [29]. This condition was completely different from the measurement in this study where the subjects were free to move. Per Fig. 2 (middle), the visibility of R-wave was good but baseline wandering signal was clearly still visible. We slightly modified the algorithm by adding a simple moving average filter (N=30) to detect and remove the baseline wandering, see Fig. 2 (bottom), and call it as mSWMAR or modified SWMAR. The original signal was six seconds or 1500 samples but after applying mSWMAR, it was cut to the first 1280 sample or 5.12 seconds due to certain parameters in the original SWMAR algorithm.
3.2 Features from the Bivariate Empirical Mode Decomposition
Tables 1 and 2 show the accuracies of subject-dependent classifier for 2nd and 5th graders respectively based on 10-fold cross validation on various window size (50, 100, 150, and 200 samples) and overlap (10-90%) parameters in spectrogram analysis.
Fig. 2: Motion artifact was visible in ECG signals due to random and free movement of the pupils during the simulation (top). Applying SWMAR didn’t completely remove the motion artifact (middle) so an MA filter was used the remove baseline wandering signal (bottom)
Table 1: Accuracies (%) for 2nd grade in subject-dependent classifier based on 10-fold cross validation on
various window size and overlap parameters of spectrogram analysis using BEMD-based features.
Overlap (%) Window Size (samples)
50 100 150 200
10 85.4±7.9 77.6±8.6 79.6±8.3 76.4±8.5
20 83.2±7.0 87.4±7.6 81.3±7.6 80.9±8.6
30 84.9±7.4 84.8±7.4 82.7±6.6 79.5±8.2
40 80.9±8.3 80.3±7.0 81.0±7.3 75.9±9.4
50 88.1±6.6 84.6±6.8 84.1±6.6 78.4±7.9
60 84.7±7.6 84.6±7.4 82.2±7.5 83.3±7.7
70 83.4±7.4 86.8±7.7 82.8±7.5 85.9±5.9
80 87.3±6.5 83.3±7.6 89.4±6.9 78.7±8.9
90 87.0±7.6 84.8±7.1 86.3±6.5 82.3±8.6
Numbers (LLN) to get the approximated true accuracies of the system, see Table 3. Here, the number of repetitions was increased from 100 to 1000 with new resampling each time and average of the performance was reported.
Table 2: Accuracies (%) for 5th grade in subject-dependent classifier based on 10-fold cross validation on various window size and overlap parameters of spectrogram analysis using BEMD-based features.
Overlap (%) Window Size (samples)
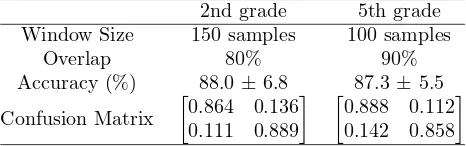
Table 3: Accuracies (%) of the subject-dependent classifier based on 10-fold cross validation using
BEMD-based features.after applying the LLN
2nd grade 5th grade
Window Size 150 samples 100 samples
Overlap 80% 90%
game simulated as violence for 2nd and 5th grades respectively. False alarm rate was represented by false positives, contributed by walking and relaxing for 2nd and 5th grades respectively. It was surprising that the classifier misclassified relaxing as violence event. It looked like the pupils were not relaxed enough after the simulation. A delay time is required to get ECG recorded in relaxing state. These facts revealed important note that some activities might not really affect as planned. It is also possible that the proposed feature extraction method was not sufficient to discriminate all violence and non-violence events.
Table 4 summarizes experiment using subject-independent classifier based on LOSO val-idation after finding the optimum combination of window size and overlap parameters. Larger standard deviations were expected since the model was not trained with as complete data as in 10-fold cross validation. False negative rates for LOSO validation were higher too, which contributed mostly from signal measured during some physical games simulated as violence for both grades. For false positives, the biggest contributors were walking and relaxing, like with the other validation method. Again, this validation also revealed that the activities during simulation must be re-designed to get more appropriate signals or use other feature extraction methods.
Table 4: Accuracies (%) of the subject-independent classifier based on LOSO validation using BEMD-based features
2nd grade 5th grade
Window Size 150 samples 200 samples
Overlap 10% 50%
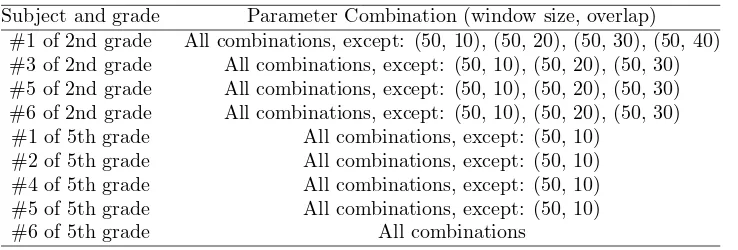
Table 5: Parameter combination (window size in samples, overlap in percent) of the subject-specific classifier
based on the features from BEMD achieving 100% accuracy
Subject and grade Parameter Combination (window size, overlap)
#1 of 2nd grade All combinations, except: (50, 10), (50, 20), (50, 30), (50, 40)
#3 of 2nd grade All combinations, except: (50, 10), (50, 20), (50, 30)
#5 of 2nd grade All combinations, except: (50, 10), (50, 20), (50, 30)
#6 of 2nd grade All combinations, except: (50, 10), (50, 20), (50, 30)
#1 of 5th grade All combinations, except: (50, 10)
#2 of 5th grade All combinations, except: (50, 10)
#4 of 5th grade All combinations, except: (50, 10)
#5 of 5th grade All combinations, except: (50, 10)
#6 of 5th grade All combinations
while subject-independent cases will suffer from reduced performance level due to a common feature set.
Getting 100% accuracy from specific classifier but lower accuracy for subject-independent one indicated that the variability among the samples for the whole experiments was higher than among the samples within each subject. From the video recording, it was found that the perpetrator was always the same for the victim such that the data had small variation because the same person will give the same power in physical activities related to violence
3.3 Features from Recurrence Quantification Analysis
The experiments with features from RQA were similar to the ones from BEMD by searching which combination of dimensionality (M) and delay (Delta) yielded the best results. Ta-bles 6 and 7 display the accuracies of subject-dependent classifier for 2nd and 5th graders respectively based on 10-fold cross validation for each dimensionality (2 to 10) and delay (5 to 25 samples).
Summaries of the experiments in Table 8 and 9 showed that false negative rates were high for both grades. Mostly, they were contributed byphysical games simulated as violence for both 2nd and 5th grades respectively. On the other hand, misclassifying ordinary games to violence event contributed the most to false positives. These facts strengthened the argument above that some activities must be redesigned to achieve the goal of the study or applying different methods for feature extraction.
Table 6: Accuracies (%) for 2nd grade in subject-dependent classifier based on 10-fold cross validation on various delay and dimensionality values using RQA-based features.
Dimensionality Delay (samples)
5 10 15 20 25
2 67.9±8.6 69.4±8.6 72.4±7.7 74.6±7.5 70.8±8.2
3 64.0±9.3 71.1±9.3 72.6±7.6 69.0±8.2 70.7±9.3
4 66.0±8.7 69.0±8.2 67.0±8.2 71.1±7.6 68.3±9.0
5 66.0±8.7 64.9±8.3 73.4±7.9 60.8±9.3 69.2±8.7
6 67.7±8.7 66.3±8.2 67.3±9.3 59.3±7.3 66.5±7.9
7 60.3±9.2 70.7±7.7 58.5±8.7 60.8±10.0 61.3±9.5
8 67.3±9.5 66.8±8.3 58.8±10.4 62.8±10.3 63.0±9.4
9 61.2±8.2 72.1±9.3 62.2±8.0 64.4±8.6 57.3±7.8
10 60.1±9.5 61.0±9.7 59.4±8.2 59.3±6.9 59.2±9.1
Table 7: Accuracies (%) for 5th grade in subject-dependent classifier based on 10-fold cross validation on
various delay and dimensionality values using RQA-based features.
Dimensionality Delay (samples)
5 10 15 20 25
2 68.2±6.5 70.4±6.5 75.7±5.8 71.8±7.8 76.5±6.3
3 74.1±6.4 68.9±6.6 71.9±6.7 69.6±7.0 73.9±6.3
4 69.5±6.4 66.5±7.8 72.6±6.5 72.5±6.7 77.2±6.2
5 71.3±6.8 64.9±6.1 70.3±6.6 75.5±6.8 70.8±6.6
6 69.4±6.5 69.5±6.6 76.9±6.7 75.4±6.7 66.1±7.1
7 67.4±7.1 68.0±7.8 81.2±5.1 65.9±6.1 64.9±6.5
8 65.6±7.3 71.2±7.0 78.5±6.4 68.0±7.3 61.5±6.5
9 65.0±7.4 72.0±6.7 69.7±7.1 67.8±6.4 68.6±7.1
10 68.3±7.2 75.0±7.0 71.0±6.4 58.6±7.2 64.9±7.0
4. Conclusions
A method to detect violence was developed for ultra-short ECG signals with BEMD and RQA based feature sets. Tests showed that the subject-specific classifier achieved excellent results in our data but it raised practicality issue as the system needed to find the optimum combination of window size and overlap in spectrogram analysis and selected appropri-ate features for each subject. Both subject-dependent and subject-independent classifiers produced only satisfactory results as the false negative rate was relatively high, meaning that the classifiers misclassified many violent events as non-violent ones. Above all, these facts indicate that the violence events can be detected using ultra-short ECG signal with appropriate signal analysis.
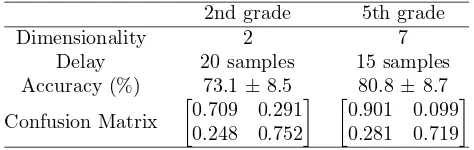
Table 8: Accuracies (%) of the subject-dependent classifier based on 10-fold cross validation using
RQA-based features after applying LLN.
2nd grade 5th grade
Dimensionality 2 7
Delay 20 samples 15 samples
Accuracy (%) 73.1±8.5 80.8±8.7
Confusion Matrix
0.709 0.291
0.248 0.752
0.901 0.099
0.281 0.719
Table 9: Accuracies (%) of the subject-independent classifier based on LOSO validation using RQA-based
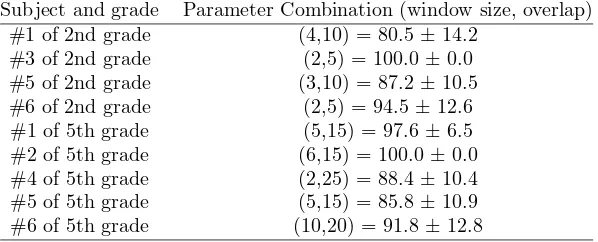
Table 10: Accuracies (%) of the subject-specific classifier based on the features from RQA with its parameter
combination (dimensionality, delay)
Subject and grade Parameter Combination (window size, overlap)
#1 of 2nd grade (4,10) = 80.5±14.2
Using kNN classifier, the BEMD-based method provided superior performance to RQA, i.e. 88% vs. 73% (2nd grade pupils) and 87% vs. 81% (5th grade pupils) using 10-fold cross validation and 77% vs. 75% (2nd grade pupils) and 80% vs. 76% (5th grade pupils) using LOSO validation. However, BEMD-based method requires longer calculation time than RQA which could be an issue when running the application on a smartphone with limited resource compare to PC.
Removing motion artifacts due to free movement of the children as in normal daily lives is very important during preprocessing of the signals. The modified Stationary Wavelet Motion Artifact Removal (mSWMAR), based on 3D acceleration signals, offered high per-formance in our data.
This preliminary study also shows that ultra-short ECG signals can be analyzed using BEMD and RQA methods in violence detection applications. More experimental studies in-volving larger numbers of ultra-short ECG signals are required to make stronger conclusions about achievable performance.
subjects from different cultural backgrounds as it may affect how they perceive violent events. Fourthly, the ECG samples used in this study were recorded from either violent or non-violent events, not mixed events.
Both proposed feature extraction methods failed to offer general or universal features for violence detection. Other feature extraction methods able to analyze less than 6 second ECG signals are required. Another option is to improve the quality of the current features with supervised dimensionality reduction [30]. Other future works include reducing false negative rates, new data collection after redesigning the whole simulation procedure with more variability among the samples and employing more pupils involved in the simulation, data collection from other cultural backgrounds, and developing a real-life system which tracks violent events from continuous ECG signal.
Acknowledgments
We would like to express our thanks to the Youxie Second School in Harbin, China who gave us permission to conduct violence simulations. The research is partly funded by the Direc-torate General of Higher Education, Indonesia (2142/E4.4/K/2013); the Finnish Cultural Foundation, North Ostrobothnia Regional Fund; the National Natural Science Foundation of China (61602127); Reserve Talents of Universities Overseas Research Program of Hei-longjiang (2013); Harbin Science and Technology Bureau, China (2013RFQXJ171).
References
[1] C. P. Monk, and I. Coyne, Bullying in different context, Cambridge University Press, 2011.
[2] P. K. Smith, and S. Sharp, School Bullying: Insights and Perspectives, New York: Routledge,
1994.
[3] P. K. Smith, Y. Morita, J. Junger Tas, D. Olweus, R. Catalano, and P. Slee, The Nature of
School Bullying: A Cross-National Perspective, 1st Ed. New York: Routledge, 1999.
[4] D. S. Hawker and M. J. Boulton, ”Twenty years research on peer victimization and psychosocial
maladjustment: a meta-analytic review of cross-sectional studies,” J. Child Psychol. Psychiatry,
vol. 41, no. 4, pp. 441-455, 2000.
[5] D. Olweus, Bullying at School: What We Know and What We Can Do, 1st ed., Oxford:
Wiley-Blackwell, 1993.
[6] A. Sourander, L. Helstel, H. Helenius, and J. Piha, Persistence of bullying from childhood to
adolescence–a longitudinal 8-year follow-up study,”Child Abuse Negl.,vol. 24, no. 7, pp. 873-881,
2000.
[7] D. Galloway and E. Roland, ”Is the direct approach to reducing bullying always the best?”, in
Bullying in Schools: How Successful Can Interventions Be? 1st ed.,P. K. Smith, D. Pepler, and K. Rigby, Eds. Cambridge: Cambridge University Press, 2004.
[8] M. Choquet, J. M. Darves-Bornoz, S. Ledoux, R. Manfredi, and C. Hassler, Self-reported health and behavioral problems among adolescent victims of rape in France: results of a cross-sectional
survey,” Child Abuse Negl.,vol. 21, no. 9, pp. 82332, Sep. 1997.
[9] P. K. Smith and S. Shu, What Good Schools Can Do about Bullying: Findings from a Survey
in English Schools after a Decade of Research and Action, Child. A Glob. J. Child Res.,vol. 7,
no. 2, pp. 193212, 2000.
[10] E. Renold, Boys and girls speak out: a qualitative study of childrens gender and sexual cultures (age 10-12)” NSPCC Cardiff, 2003.
[11] Unicef, Toward a world free from violence. Global survey on violence against children, Unicef, 2013
[13] The Office of the United Nations High Commissioner for Human Rights,
2016, April Convention on the Rights of the Child [Online] Available:
http://www.ohchr.org/EN/ProfessionalInterest/Pages/CRC.aspx
[14] P. C. Ribeiro, R. Audigier, and Q. C. Pham, ”RIMOC, a feature to discriminate unstructured
motions: Application to violence detection for video-surveillance,” Computer Vision and Image
Understanding Academic Press Inc., 2014.
[15] T. Zhang, W. Jia, B. Yang, J. Yang, X. He, and Z. Zheng, ”MoWLD: a robust motion image
descriptor for violence detection,” Multimed. Tools Appl.,pp. 1-20, 2015.
[16] Y. Gao, H. Liu, X. Sun, C. Wang, and Y. Liu, Violence detection using Oriented VIolent Flows,
Image and Vision Computing,vol. 48, pp. 37-41, 2016.
[17] C. Penet, C. H. Demarty, G. Gravier, and P. Gros, Variability modelling for audio events
detection in movies, Multimed. Tools Appl.,vol. 74, no. 4, pp. 11431173, 2014.
[18] J. Fleureau, C. Penet, P. Guillotel, and C. H. Demarty, Electrodermal activity applied to
violent scenes impact measurement and user profiling, inProc. IEEE International Conference
on Systems, Man and Cybernetics,pp. 33103315, 2012.
[19] Task Force Heart rate variability. Standards of measurement, physiological interpretation, and clinical use. Task Force of the European Society of Cardiology and the North American Society
of Pacing and Electrophysiology, Eur. Heart J.,vol. 17, no. 3, pp. 354381, 1996.
[20] F. Agrafioti, D. Hatzinakos, and A. K. Anderson, ECG Pattern Analysis for Emotion Detection,
IEEE Trans. Affect. Comput.,vol. 3, no. 1, pp. 102115, Jan. 2012.
[21] H. Ferdinando, T. Sepp¨anen, and E. Alasaarela Comparing features from ECG pattern and
HRV analysis for emotion recognition system, inProc. 2016 IEEE Conference on Computational
Intelligence in Bioinformatics and Computational Biology (CIBCB),pp. 1-6, 2016.
[22] H. Ferdinando, L. Ye, T. Sepp¨anen, and E. Alasaarela, Emotion Recognition by Heart Rate
Variability, Aust. J. Basic Appl. Sci. Aust. J. Basic Appl. Sci,vol. 8, no. 814, pp. 5055, 2014.
[23] G. Gaoxiang Ouyang, X. Xiangyang Zhu, Z. Zhaojie Ju, and H. Honghai Liu, Dynamical
Characteristics of Surface EMG Signals of Hand Grasps via Recurrence Plot, IEEE J. Biomed.
Heal. Informatics,vol. 18, no. 1, pp. 257265, Jan. 2014.
[24] N Balogh, S Khoor, T Szuszai, I Kecskes, K Fugedi, I Kovacs, I Simon, and S Rubicsek, ”Re-currence quantification analysis based on P-P intervals measurement in postinfarction patients
with frequent ventricular ectopy,” Computing in Cardiology 2012,pp. 985-988, 2012
[25] H. Hui Yang, Multiscale Recurrence Quantification Analysis of Spatial Cardiac
Vectorcardio-gram Signals, IEEE Trans. Biomed. Eng.,vol. 58, no. 2, pp. 339347, Feb. 2011.
[26] R. Guo, Y. Wang, J. Yan, and H. Yan, Recurrence quantification analysis on pulse
morpholog-ical changes in patients with coronary heart disease, J. Tradit. Chinese Med.,vol. 32, no. 4, pp.
571-577, 2012.
[27] L. Murali, D. Chitra, T. Manigandan, and B. Sharanya, An Efficient Adaptive Filter
Archi-tecture for Improving the Seizure Detection in EEG Signal, Circuits, Syst. Signal Process.,pp.
118, Oct. 2015.
[28] L. Ye, H. Ferdinando, T. Seppnen, and E. Alasaarela, Physical Violence Detection for
Prevent-ing School BullyPrevent-ing, Adv. Artif. Intell.,vol. 2014, pp. 19, 2014.
[29] A. Lanata, A. Guidi, P. Baragli, G. Valenza, and E. P. Scilingo, A Novel Algorithm for Movement Artifact Removal in ECG Signals Acquired from Wearable Systems Applied to Horses,
PLoS One,vol. 10, no. 10, pp. 121, Oct. 2015.
[30] H. Ferdinando, T. Sepp¨anen, and E. Alasaarela, Enhancing Emotion Recognition from ECG
Signals using Supervised Dimensionality Reduction, inProc. of the 6th International Conference