INTRODUCTION
Land use change from forest to agricultural land has altered the soil properties, especially due to land clearance and cultivation. One of the soil properties mainly affected by forest clearance is soil organic matter (SOM) content. As reported by Gartzia-Bengoetxea, Arbestain, Mandiola, & Martínez de Arano (2011) found that a decrease in the pool of resistant C in the 5 cm soil depth reached 7 % for 20 years following mechanically forest clearance. Lower SOM content due to forest clearance also reported by Guillaume, Damris, & Kuzyakov (2015), that converting forest to plantations (oil palm and rubber) led to a loss of, on average, 10 t C h−1 after approximately 15 years of land use change. The carbon contents decreased sharply (close to 70 % and 62 %) in the Ah horizon respectively under plantations of oil palm and rubber. Furthermore, Llorente, Glaser, & Turrión (2017) found that land use change from natural forest to
farming land in northwestern Spain decreased the organic carbon in the surface soil by 67 % almost a century after land use conversion.
The decrease in SOM content will affect soil fertility status since it influences soil physical and chemical properties. Soil OM is considered as one of the soil properties used as an indicator for soil quality (Bautista-Cruz, Del Castillo, Etchevers-Barra, Gutiérrez-Castorena, & Baez, 2012). It was found a very strong correlation between soil organic carbon (SOC) and soil nitrogen (R2 = 0.9846) and soil cation exchange capacity (CEC) (R2 = 0.7456) of coarse-textured soil under oil palm plantation in West Kalimantan (Kasno & Subardja, 2010). Therefore, soil physicochemical properties are important to determine site-specific management (Yao et al., 2014).
Sohng, Singhakumara, & Ashton (2017) suggested that land use change in tropical forest area into some types of plantation changed some
AGRIVITA
Journal of Agricultural Science
Effects of Slope Position on Soil Physico-chemical Characteristics Under Oil Palm
Plantation in Wet Tropical Area, West Sumatra Indonesia
Syafrimen Yasin*) and Yulnafatmawita
Soil Science Department, Faculty of Agriculture, Andalas University, Kampus Limau Manis Padang, Indonesia
ARTICLE INFO
Keywords:
Oil palm plantation
Physico-chemical properties Slope position
Wet tropical area
Article History:
Received: April 11, 2016
Accepted: April 3, 2018 *) Corresponding author:
E-mail: [email protected]
ABSTRACT
soil properties such as soil bulk density (BD), N, and C stocks. Soil nitrogen percentage decreased from native grassland to farmland as well as to artificial grassland (Xue, Cheng, & An, 2013). They, furthermore, found that the soil N positively correlated to SOC but negatively to soil pH and BD.
Total organic carbon was found to be the best key determinant for soil conditions besides mineralizable N and basal respiration, while C derived from biomass of microorganisms as well as labile N was important to differentiate the types of land use (Liu et al., 2018). Then, at sloping farming area, soil physicochemical properties were found to be variated under different types of land management (Negasa, Ketema, Legesse, Sisay, & Temesgen, 2017).
Deforestation for oil palm plantation in West Sumatra has been conducted since the last few decades. In Dharmasraya region, the process for oil palm plantation was started in 1986 up to now. Most people cleared forest by cutting or slashing and burning. These activities decrease OM content very fast from soils. Since OM is a kind of soil ameliorant, decreasing SOM reduces the soil productivity. As reported by Murtilaksono et al. (2011) that application of organic mulch as the combination of bund terraces and silt-pit as soil and water conservation treatments at oil palm plantation gave higher production compared to control.
Forest clearance is quite risky on soil productivity degradation and on erosion process, especially for marginal soil under wet tropical area. The soil in the research area was classified into Ultisols having high clay and low SOM content (Hakim, Alfina, Agustian, Hermansah, & Yulnafatmawita, 2014). This kind of soil was easy to degrade as energy input introduced. Yulnafatmawita & Adrinal (2014) further explained that aggregate stability index of Ultisols highly correlated to the amount of run-off (R2 = 0.73) and soil loss (R2 = 0.94). This was due to erosion which was the main factor causing degradation of soil properties (An et al., 2008).
The negative impact of oil palm plantation appeared since forest clearance. All vegetation was slashed and burnt, therefore, the soil surface is exposed to kinetic energy (Ek) of rainfall received in the area. An et al. (2008) reported that aggregate stability of soil under the wet condition and average size of soil aggregate diameter declined by time after deforestation. The condition is kept until the crops developed enough. It takes 3-4 years until the crop canopy can fully cover the soil surface. Therefore, the
condition caused lower or no SOM accumulation and higher soil lost in the land, especially under sloping areas.
Margono, Potapov, Turubanova, Stolle, & Hansen (2014) reported that total forest loss in Indonesia approximately reached 6.02 Mha for 12 years period (from 2000 to 2012) and increased more or less by 47,600 ha per year by 2012. Petrenko, Paltseva, & Searle (2016) reported that Indonesia lost approximately 840,000 ha of primary forest each year between 2000 and 2012, mainly for oil palm plantation. They stated that the land use change contributed to one-tenth to one-fifth of greenhouse gas (GHG) productions in the tropics. The highest oil palm industry growth was found in Sumatra, it reached 167,000 and 219,000 ha for the first and second period, respectively, over twenty years (Gunarso, Hartoyo, Agus, & Killeen, 2013). Deforestation during land clearing and emissions from oil processing are the two components of C footprints in oil palm industry.
Oil palm plantation area in Dharmasraya reached > 63,000 ha (BAPPEDA, 2015). It was conducted under various types of topography, from flat to sloping areas. Topography will affect the movement and accumulation of soil materials, causing soil fertility difference among micro sites within the area. Therefore, slope position, besides soil parent material and the environment, affects soil fertility. As reported by Ezeaku & Eze (2014) as well as Khan et al. (2013) that there was substantial difference of the physico-chemical characteristics of soil among the slope positions. Zhu et al. (2014) also found that topographic position (erosion and deposition), land use, and their interactions regulated OC and N accumulation in soil.
MATERIALS AND METHODS
This research took place in oil palm plantation belonged to PT. Incassi Raya Pangian in District Asam Jujuhan, Dharmasraya regency, West Sumatra, Indonesia in 2013. It is located at 101o
39’00.2”-101o39’00.3” E and 01o19’38.1”-01o19’39.6” S, with
Syafrimen Yasin and Yulnafatmawita: Slope Position and Soil Physico-chemical Properties... 33 °C with the mean annual rainfall > 3000 mm per
year (± 265 mm per month) (BAPPEDA, 2015). At the beginning of plantation process, the forest was cut or slashed and then burnt. After that, it was continued with the 2nd burning to remove all of
the wood remnant or stumps from the soil surface. Crops were fertilized using inorganic fertilizers once in 6 months by applying NPK 1500 g, Kiserit 1000 g, rock phosphate 1500 g, and HGF Borate 60 g for each palm. The OM source for the soil was mainly from the leaves being cut and accumulated between the trees. The leaves degraded by time, and finally contributed to SOM, as well as soil nutrients. Soil was sampled 5 months after the last synthetic fertilizer application with equal distance among the trees.
Disturbed (using mineral soil bor) and undisturbed (using stainless steel ring) soil samples were collected from 0-20 cm soil depth and from 4 different positions of slope (the upper, the middle, the lower slope, and the bottom position). The upper, middle and lower slopes were on the sloping area, while the bottom position was the flat area following the lower slope. Soil sampling method as described in Fig. 1. Then, the samples were processed and analyzed at soil laboratory, Andalas University. Undisturbed soil samples were directly analyzed for soil bulk density, total porosity, and hydraulic conductivity determination. While disturbed soil samples, on the other hand, were processed by air drying, grinding, and sieving using 2 and 0.5 mm sieve for analyses of soil physical and chemical characteristics.
Soil properties were analyzed for distribution of the particle size using sieve and pipette method, and then the textural classes were determined based on the textural triangle. Soil bulk density and total porosity were analyzed using gravimeri method. Soil organic carbon content was determined using
wet oxidation method, pH using pH-meter, CEC, Al-exchangeable, basic cations (Ca, Mg, K) using NH4 -OAc leaching, N using macro Kjehdahl, and P using Bray II (Eviati & Sulaeman, 2009). Soil hydraulic conductivity (HC) was analyzed using constant head permeameter based on Darcy’s law (ASTM D5084-10, 2010).
Statistical analysis was conducted by using one-way analysis of variance to determine the variation among the slope position. Then, if the variance was significantly different, the test was continued using LSD test at 5 % level of significance.
RESULTS AND DISCUSSION
Particle Size Distribution
Slope position contributed different soil properties (Table 1). Soil clay content tended to increase by 13 %, 15 %, and 27 % from the upper to the middle, lower, and bottom positions of the slope, respectively, even though the texture class (clay) of the soil at all position stayed the same. The sand percentage decreased (R2 = 0.90) while
clay increased (R2 = 0.93) significantly as the slope
position moved down from the upper to the bottom position. This was probably due to lateral movement of soil particles as affected by runoff since the area receives high rainfall intensity (annual rainfall > 3000 mm) and steep slope (39 %), especially at the beginning of crop planting or after forest clearance. Negasa, Ketema, Legesse, Sisay, & Temesgen (2017) found that slope affected the distribution of sand, silt, and clay of soil particles under different types of land management. Furthermore, they stated that clay particles showed an increasing tendency in the sequential topography. However, Tan et al. (2014) found that there was no indicator of soil erosion under < 8 % slope at oil palm plantation in central Pahang.
Upper
Middle Slope
Lower slope
Bottom slope (Flat area)
Incassi Raya Pangian
The phenomenon of altering soil particle distribution among the slope position could be explained that after slashing and burning forest until the crops were well established [having good canopy cover (3-4 years old)], rainfall received on the area directly touched soil aggregates, detached, and then dispersed them due to rainfall kinetic energy. This exposed surface soil caused the finest especially clay particles suspended in water and moved onto the lower parts during the rainy season. As a consequence, the percentage of the clay particles increased at the bottom compared to the upper slope position.
Higher clay content at lower slope position was also reported by Ezeaku & Eze (2014) and Khan et al. (2013). Ezeaku & Eze (2014) found that clay content increased by lowering slope position from 7.44 % at the upper into 10.16 % and 24.29 % at the middle and foot slope, respectively. Khan et al. (2013) found that higher SOM and small size soil particles at the lower position of the slope were due to the past soil erosion. Guillaume, Damris, & Kuzyakov (2015) estimated higher erosion in oil palm (35 ± 8 cm) than in the rubber plantations.
On the other hand, sand content tended to be lower (20.44 %) at the bottom and higher (42.88 %) at the upper slope position. It was due to the fact that sand particles were heavy enough to suspend and move into the lower parts. Based on the data resulted, the sand content was 110 %, 90 %, and 95 % for upper, middle, and lower slope position compared to the bottom (flat) area, respectively.
Regarding to soil textural triangle by USDA, the soil texture was classified into clay for the whole research area (at 4 slope positions) because of high clay content. This was due to intensive weathering process in the area since it had high temperature all year long (21-33 oC) and received
high annual rainfall (> 3000 mm). These two climate factors (temperature and rainfall) have accelerated soil formation process. According to Minasny & Hartemink (2011) soils in the tropics have higher clay content than soils in the temperate regions.
Soil Organic Matter (SOM) Content
As the clay content, the percentage of SOM was also affected by slope position (Table 1). Soil organic matter content under oil palm plantation increased as the slope position became lower, except at the middle slope. The highest SOM content was determined at the bottom and the lowest was at the middle positions of the slope. At the bottom position of the slope, SOM content was significantly higher than those at other slope positions. It increased by 33 %, 94 %, 27 % compared to upper, middle, and lower slopes, respectively. This was found to be true that the SOM together with soil particles moved laterally to downslope during the rainy season since there were no crops cover the soil surface. As suggested by Su, Zhang, & Nie (2010) that soil erosion moved SOM from higher to lower position of the slope. Therefore, the OM was accumulated on the lower and the bottom slope. As found by Ezeaku & Eze (2014), as well as Khan et al. (2013) that SOC content increased in the downslope.
Other Soil Physico-chemical Properties
In general, soil physical and chemical properties seemed to be best on the bottom of the four slope position, as it had high SOM and clay content. Soil OM could improve soil physical properties especially soil aggregation process and aggregate stability, as well as soil water retention and transmission, besides as a nutrient source in the soils. Then, high clay content improves soil CEC (Table 2) as well as water retention.
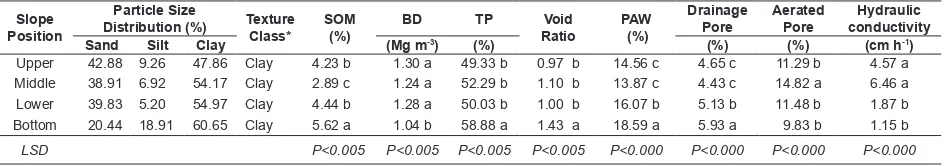
Table 1. Soil physical properties at four different slope positions under oil palm plantation in West Sumatra, Indonesia. LSD P<0.005 P<0.005 P<0.005 P<0.005 P<0.000 P<0.000 P<0.000 P<0.000
Syafrimen Yasin and Yulnafatmawita: Slope Position and Soil Physico-chemical Properties... Soil at the bottom slope position (the flat area)
had the lowest BD (only 80 %), aerated pore (87 %), hydraulic conductivity (25 %), Al-exchangeable (4 %) compared to those on the upper slope position. However, it had the highest void ratio (approximately 147 %), PAW (128 %), TP (119 %), drainage pores (128 %), pH H2O (141 %), pH KCl (156 %), SOM (133 %), total-N (270 %), P-available (214 %), CEC (271 %) compared to those on the upper slope position. Higher soil fertility at the bottom of a sloping land was also reported by Ezeaku & Eze (2014) and Khan et al. (2013).
Soil Physical Properties
The bottom site had the lowest value of soil BD (1.04 Mg m-3) and highest total pore (58.88 %) as
compared to the upper positions of the slope (all P < 0.005). Tan et al. (2014) found that soil bulk density was higher at the lower than that at the upper and middle slope positions under oil palm plantation in Central Pahang Malaysia. Lower soil BD at the bottom position was due to higher SOM content besides the percentage of sand particles which also tended to be the lowest. Therefore, the soil in the bottom position had more space (total pore) within the unit volume. This was due to the function of the SOM that can improve soil aggregates and create balance pore size distribution within each unit of soil volume, besides the OM itself has the much lower dry weight per volume than the mineral particles do. On the other hand, lowering slope position from the top to the bottom significantly increased soil total pore due to its inverse correlation to the soil BD. As reported by Yao et al. (2014) that there was an inversed relation between total carbon and soil BD, as well as BD and total pore in a soil. Based on Table 1, soil at the bottom position had significantly higher drainage pores and lower aerated pores. It means that the soil at the bottom position was dominated by small size (< 2 μm diameter) pores, therefore, it had
significantly lower hydraulic conductivity (P < 0.000) than that at the middle slope. This was probably due to the tendency of lower sand and higher clay content at the bottom slope.
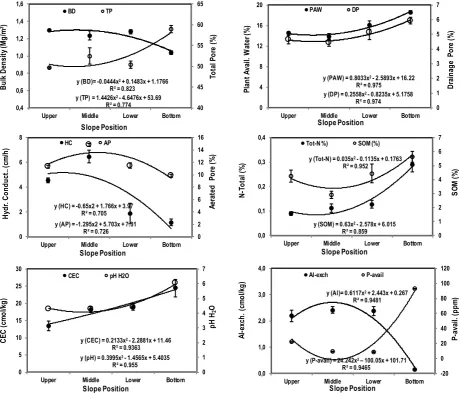
Percentage of plant available water (PAW) significantly increased (P < 0.000) polynomially (R2 = 0.97) by lowering slope position. The same tendency was also found for soil drainage pore (R2
= 0.97). At the bottom position, PAW and drainage pore increased by 1.28 times. This was caused by high clay and SOM content at the bottom slope position causing the soil to have higher water retention. Soil OM plays an important role in creating good soil structures and soil pore distribution, as well as retains more water. Yu, Zhang, Zhang, Xin, & Li (2017) found that soil OM, especially mineral-associated one, strongly affected the stability of soil aggregates. Sarker et al. (2018) found that high soil OC content was found higher at finer soil fractions than that at coarser ones.
The hydraulic conductivity and the aerated pores of the soil significantly decreased (P < 0.000) by lowering slope position. The highest soil hydraulic conductivity rate was found under two top slopes, then, it tended to decrease by decreasing slope position. Likewise, the percentage of aerated pores followed the same pattern. This was probably due to lower SOM but higher sand content on the two top slopes that tended to pass water rather than to retain it. Less SOM causes less water to be retained by the soil since the OM tends to hold water.
While on the other hand, at the bottom position, higher SOM, as well as lower aerated pores, decreased soil hydraulic conductivity. It means that the ability of soil to transmit water became lower. Marín-Castro, Geissert, Negrete-Yankelevich, & Gómez-Tagle Chávez (2016) found that there was an effect of soil clay as well as SOM, BD, and moisture content on soil hydraulic conductivity.
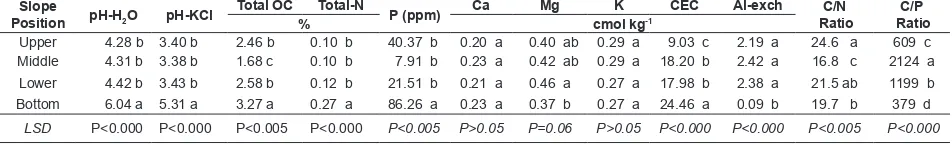
Table 2. Soil chemical properties at four different slope positions under oil palm plantation in West Sumatra, Indonesia.
Slope
Position pH-H2O pH-KCl
Total OC Total-N
P (ppm) Ca Mg K CEC Al-exch C/N Ratio
C/P Ratio
% cmol kg-1
Upper 4.28 b 3.40 b 2.46 b 0.10 b 40.37 b 0.20 a 0.40 ab 0.29 a 9.03 c 2.19 a 24.6 a 609 c Middle 4.31 b 3.38 b 1.68 c 0.10 b 7.91 b 0.23 a 0.42 ab 0.29 a 18.20 b 2.42 a 16.8 c 2124 a Lower 4.42 b 3.43 b 2.58 b 0.12 b 21.51 b 0.21 a 0.46 a 0.27 a 17.98 b 2.38 a 21.5 ab 1199 b Bottom 6.04 a 5.31 a 3.27 a 0.27 a 86.26 a 0.23 a 0.37 b 0.27 a 24.46 a 0.09 b 19.7 b 379 d
LSD P<0.000 P<0.000 P<0.005 P<0.000 P<0.005 P>0.05 P=0.06 P>0.05 P<0.000 P<0.000 P<0.005 P<0.000
Soil Chemical Properties
Soil pH, as well as CEC values of the soil significantly increased (P < 0.000) (Table 2) polynomially (R2 = 0.96 and 0.94, respectively) by
lowering slope position from the upper to the bottom position (Fig. 2). Soil pH value was the highest at the bottom and significantly different (P < 0.000) from the other slope positions. As reported by Tan et al. (2014) that soil pH was found to be higher at the footslope position under oil palm plantation. Higher pH value at the bottom slope was affected by some factors, among them was SOM. Rosenani, Rovica, Cheah, & Lim (2016) reported an increase in soil pH after increasing organic matter application. Organic matter content of the soil at the bottom slope position
was able to absorb and reduce the activity of Al-exchangeable. Furthermore, low Al-exchangeable caused less H+ to be released, therefore, pH value
of the soil increased since H+ contributes to soil pH.
Likewise, soil CEC was also highest at the bottom, and significantly different (P < 0.000) from the other slope position. High soil CEC at the bottom was possibly due to SOM content and clay particles at the slope position. Clay particles sizing < 2 μm and SOM, especially in humic form, contributed to soil colloids having charges which are able to hold cations. Tan et al. (2014) found that there was an increase in CEC and pH values of soil as the slope lower from the top (13.1 cmol kg-1, 4.6) to the bottom
(15.8 cmol kg-1, 4.96) under oil palm plantation.
Syafrimen Yasin and Yulnafatmawita: Slope Position and Soil Physico-chemical Properties... Unlike soil pH and CEC, basic cations
especially Ca, Mg, and K (Table 2) were not affected by slope position (P > 0.05). This might be due to the nature of the cations which are adsorbed on the colloid surface. Moreover, since the palm got the same amount of fertilizers, as well as they had the same age, the probability of the crops to take cations was assumed to be the same. Therefore, the concentration left in the soil was relatively similar. Comte et al. (2015) found that unlike P and N, K fluxes under oil palm plantation in Sumatra could be washed or leached if its application exceeds the oil palm requirement threshold.
The concentration of P available along with N-total in soil at the bottom slope followed the tendency of soil pH values. They significantly increased (P < 0.005 for P and P < 000 for N) (Table 2) polynomially (R2 = 0.95 for both P and N) at the
bottom than those at the other slope positions. This was probably due to higher soil pH value and SOM content at the bottom position. Soil pH would reduce Al activities in retaining P, so P became more available. High soil pH also intensified microorganisms decomposing SOM which released P and N. Other than that, the probability of lateral movement of P and N with soil material also caused higher soil P and N content at the bottom position. Khan et al. (2013) reported that due to erosion from the top, higher P soil content was found at lower
slope position. Higher soil N content at the bottom (gully) than that at the sloping position was also found by Zhu et al. (2014) in cropland after 25-30 years cultivation.
Besides improving plant nutrient availability, aluminum-exchangeable as the toxic element for plant growth significantly decreased (P < 0.000) polynomially (R2 = 0.95), from the upper to the
bottom slope position. Since the fertilizer applied as well as the management given to the crops was the same all over the slope position, decrease in concentration of Al-exchangeable on the bottom position could be due to the effect of high SOM on the slope position. Organic matter is able to chelate Al, therefore it cannot be available and uptake by crops. Organic matter derived from vegetation could reduced Al-exchangeable in soil (Bautista-Cruz, Del Castillo, Etchevers-Barra, Gutiérrez-Castorena, & Baez, 2012).
Based on Table 2 it could be inferred that by lowering slope position, the properties of soil under oil palm plantation improved, except for sand particle and soil macropore (aerated pore) percentage, as well as saturated hydraulic conductivity rate. Less sand content or high clay particles at the bottom slope position reduced macropores and increased micropores retaining more water. Therefore, the ability of soil to transmit water under saturation (the hydraulic conductivity) becomes low.
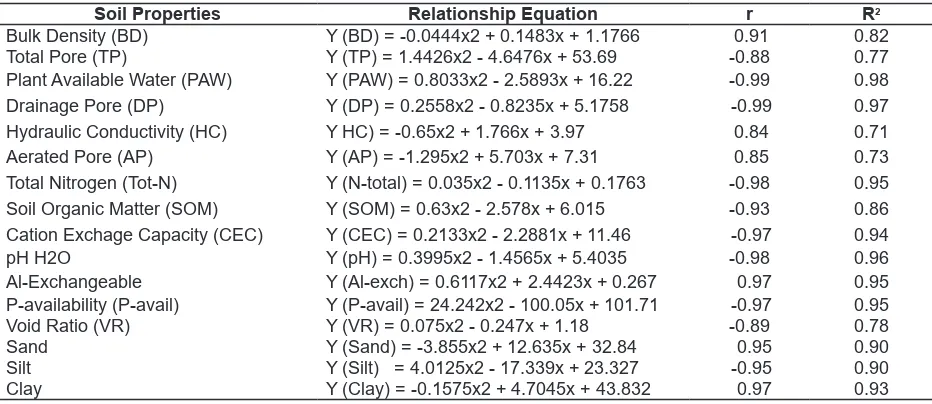
Table 3. Relationship between slope and some Soil Properties
Soil Properties Relationship Equation r R2
Bulk Density (BD) Y (BD) = -0.0444x2 + 0.1483x + 1.1766 0.91 0.82
Total Pore (TP) Y (TP) = 1.4426x2 - 4.6476x + 53.69 -0.88 0.77
Plant Available Water (PAW) Y (PAW) = 0.8033x2 - 2.5893x + 16.22 -0.99 0.98
Drainage Pore (DP) Y (DP) = 0.2558x2 - 0.8235x + 5.1758 -0.99 0.97
Hydraulic Conductivity (HC) Y HC) = -0.65x2 + 1.766x + 3.97 0.84 0.71
Aerated Pore (AP) Y (AP) = -1.295x2 + 5.703x + 7.31 0.85 0.73
Total Nitrogen (Tot-N) Y (N-total) = 0.035x2 - 0.1135x + 0.1763 -0.98 0.95
Soil Organic Matter (SOM) Y (SOM) = 0.63x2 - 2.578x + 6.015 -0.93 0.86
Cation Exchage Capacity (CEC) Y (CEC) = 0.2133x2 - 2.2881x + 11.46 -0.97 0.94
pH H2O Y (pH) = 0.3995x2 - 1.4565x + 5.4035 -0.98 0.96
Al-Exchangeable Y (Al-exch) = 0.6117x2 + 2.4423x + 0.267 0.97 0.95
P-availability (P-avail) Y (P-avail) = 24.242x2 - 100.05x + 101.71 -0.97 0.95
Void Ratio (VR) Y (VR) = 0.075x2 - 0.247x + 1.18 -0.89 0.78
Sand Y (Sand) = -3.855x2 + 12.635x + 32.84 0.95 0.90
Silt Y (Silt) = 4.0125x2 - 17.339x + 23.327 -0.95 0.90
Correlation between slope position and the soil properties is collectively presented in Table 3. Soil physicochemical properties, in general, polynomially related with the slope from the top to the bottom position. This was due to the fact that soil at the middle slope could easily pass water and material from the top to the lower part. Therefore, it retains less and transmits more water. As clay moved down horizontally on soil surface, the middle slope does not retain them, even it is eroded. Then, the materials are deposited at the bottom slope position, instead
CONCLUSION AND SUGGESTION
There was a significant difference of soil physicochemical properties among the slope position, except for basic cations (K, Ca, Mg, and Na). The properties of the soil at the bottom were the best among the slopes. SOM content increased by 33 %, therefore, it increased TP by 19 %, void ratio by 47 %, PAW by 28 %, pH-H2O by 41 %, CEC by 171 %, total-N by 170 %, and P-potential by 114 %, and then decreased soil BD by 20 % and Al-exchangeable by 96 % at the bottom compared to the upper slope. The middle slope was the poorest soil physicochemical properties among the slope positions after 26 years of forest conversion into oil palm plantation. All of the slope positions had clay in texture, but the clay content increased (R2 = 0.93)
by lowering positions of the slope, and so did SOM content (R2 = 0.86), CEC (R2 = 0.93), and total-N
(R2 = 0.76). It was suggested to keep SOM content
was high enough to improve soil physico-chemical properties of soil in sloping areas under oil palm plantation.
ACKNOWLEDGEMENT
Authors thank to Yudhi Kurniawan and Roni Dharmaputra for their help in sampling collection and laboratory analysis. Thanks are also given to PT. Incassi Raya Pangian which gave permission to do research in the oil palm plantation.
REFERENCES
An, S., Zheng, F., Zhang, F., Van Pelt, S., Hamer, U., & Makeschin, F. (2008). Soil quality degradation processes along a deforestation chronosequence in the Ziwuling area, China. Catena, 75(3), 248–
256. http://doi.org/10.1016/j.catena.2008.07.003
ASTM D5084-10. (2010). Standard test methods for
measurement of hydraulic conductivity of saturated porous materials using a flexible wall permeameter. West Conshohocken, PA: ASTM
International. http://doi.org/10.1520/D5084-10
BAPPEDA. (2015). Rencana Kerja Pemerintah
Daerah (RKPD) Kabupaten Dharmasraya Tahun 2016 [Local Government Work Plan,
Dharmasraya District 2016]. Retrieved from https://sipd.kemendagri.go.id/dokumen/uploads/ rkpd_77_2016.pdf
Bautista-Cruz, A., Del Castillo, R. F., Etchevers-Barra, J. D., Gutiérrez-Castorena, M. del C., & Baez, A. (2012). Selection and interpretation of soil quality indicators for forest recovery after clearing of a tropical montane cloud forest in Mexico. Forest Ecology and Management, 277, 74–80. http://
doi.org/10.1016/j.foreco.2012.04.013
Comte, I., Colin, F., Grünberger, O., Whalen, J. K., Widodo, R. H., & Caliman, J. P. (2015). Watershed-scale assessment of oil palm cultivation impact on water quality and nutrient fluxes: A case study
in Sumatra (Indonesia). Environmental Science
and Pollution Research, 22(10), 7676–7695.
http://doi.org/10.1007/s11356-015-4359-0
Eviati, & Sulaeman. (2009). Petunjuk teknis: Analisis kimia tanah, tanaman, air, dan pupuk (Edisi 2)
[Technical instructions: Chemical analysis of soil, plants, water, and fertilizers (2nd ed.)]. Bogor, ID: Balai Penelitian Tanah.
Ezeaku, P. I., & Eze, F. U. (2014). Effect of land use in relation to slope position on soil properties in a semi-humid Nsukka area, Southeastern Nigeria.
Journal Agricultural Research, 52(3), 369–381.
Retrieved from http://apply.jar.punjab.gov.pk/ upload/1414248924_114_7._106F_Composed. pdf
Gartzia-Bengoetxea, N., Arbestain, M. C., Mandiola, E., & Martínez de Arano, I. (2011). Physical protection of soil organic matter following mechanized forest operations in Pinus radiata D.Don plantations.
Soil Biology and Biochemistry, 43(1), 141–149.
http://doi.org/10.1016/j.soilbio.2010.09.025
Guillaume, T., Damris, M., & Kuzyakov, Y. (2015). Losses of soil carbon by converting tropical forest to plantations: Erosion and decomposition estimated by δ13C. Global Change Biology,
21(9), 3548–3560. http://doi.org/10.1111/
Syafrimen Yasin and Yulnafatmawita: Slope Position and Soil Physico-chemical Properties...
Gunarso, P., Hartoyo, M. E., Agus, F., & Killeen, T.
J. (2013). Oil palm and land use change in
Indonesia, Malaysia and Papua New Guinea. Reports from the Technical Panels of RSPOs 2nd Greenhouse Gas Working Group. Retrieved
from http://www.tropenbos.org/resources/
publications/oil+palm+and+land+use+change+ in+indonesia,+malaysia+and+papua+new+ guinea
Hakim, N., Alfina, R., Agustian, Hermansah, & Yulnafatmawita. (2014). Bacterial inoculants to increase the biomass and nutrient uptake of Tithonia cultivated as hedgerow plants in ultisols.
Malaysian Journal of Soil Science, 18, 115–123.
Retrieved from http://www.msss.com.my/mjss/ Full Text/vol18/9_Nurhajati.pdf
Kasno, A., & Subardja, D. (2010). Soil fertility and nutrient management on spodosol for oil palm. AGRIVITA Journal of Agricultural Science, 32(3), 285–292.
Retrieved from http://agrivita.ub.ac.id/index.php/ agrivita/article/view/26
Khan, F., Hayat, Z., Ahmad, W., Ramzan, M., Shah, Z., Sharif, M., … Hanif, M. (2013). Effect of slope position on physico-chemical properties of eroded soil. Soil and Environment, 32(1), 22–
28. Retrieved from http://www.se.org.pk/File-Download.aspx?publishedid=231
Liu, D., Huang, Y., An, S., Sun, H., Bhople, P., & Chen, Z. (2018). Soil physicochemical and microbial characteristics of contrasting land-use types along soil depth gradients. Catena, 162, 345–
353. http://doi.org/10.1016/j.catena.2017.10.028
Llorente, M., Glaser, B., & Turrión, M. B. (2017). Effect of land use change on contents and distribution of monosacharides within density fractions of calcareous soil. Soil Biology and Biochemistry,
107, 260–268. http://doi.org/10.1016/j.soilbio.
2017.01.013
Margono, B. A., Potapov, P. V., Turubanova, S., Stolle, F., & Hansen, M. C. (2014). Primary forest cover loss in Indonesia over 2000-2012. Nature Climate Change, 4(8), 730–735. http://doi.org/10.1038/
nclimate2277
Marín-Castro, B. E., Geissert, D., Negrete-Yankelevich, S., & Gómez-Tagle Chávez, A. (2016). Spatial distribution of hydraulic conductivity in soils of secondary tropical montane cloud forests and shade coffee agroecosystems.
Geoderma, 283, 57–67. http://doi.org/10.1016/j.
geoderma.2016.08.002
Minasny, B., & Hartemink, A. E. (2011). Predicting soil properties in the tropics. Earth-Science Reviews,
106(1–2), 52–62. http://doi.org/10.1016/j.
earscirev.2011.01.005
Murtilaksono, K., Darmosarkoro, W., Sutarta, E. S., Siregar, H. H., Hidayat, Y., & Yusuf, M. A. (2011). Feasibility of soil and water conservation techniques on oil palm plantation. AGRIVITA, Journal of Agricultural Science, 33(1), 63–69.
Retrieved from http://www.agrivita.ub.ac.id/ index.php/agrivita/article/view/40
Negasa, T., Ketema, H., Legesse, A., Sisay, M., & Temesgen, H. (2017). Variation in soil properties under different land use types managed by smallholder farmers along the toposequence in southern Ethiopia. Geoderma, 290, 40–50. http://
doi.org/10.1016/j.geoderma.2016.11.021
Petrenko, C., Paltseva, J., & Searle, S. (2016). Ecological impacts of palm oil expansion in Indonesia. Washington, DC. Retrieved from http://www. theicct.org/ecological-impacts-of-palm-oil-expansion-indonesia
Rosenani, A. B., Rovica, R., Cheah, P. M., & Lim, C. T. (2016). Growth performance and nutrient uptake of oil palm seedling in prenursery stage as influenced by oil palm waste compost in growing media. International Journal of Agronomy, 2016, 8. http://doi.org/10.1155/2016/6930735
Sarker, J. R., Singh, B. P., Cowie, A. L., Fang, Y., Collins, D., Badgery, W., & Dalal, R. C. (2018). Agricultural management practices impacted carbon and nutrient concentrations in soil aggregates, with minimal influence on aggregate stability and total carbon and nutrient stocks in contrasting soils.
Soil and Tillage Research, 178, 209–223. http://
doi.org/10.1016/j.still.2017.12.019
Sohng, J., Singhakumara, B. M. P., & Ashton, M. S. (2017). Effects on soil chemistry of tropical deforestation for agriculture and subsequent reforestation with special reference to changes in carbon and nitrogen. Forest Ecology and Management,
389, 331–340. http://doi.org/10.1016/j.
foreco.2016.12.013
Su, Z.-A., Zhang, J.-H., & Nie, X.-J. (2010). Effect of soil erosion on soil properties and crop yields on slopes in the Sichuan Basin, China. Pedosphere,
20(6), 736–746.
Tan, N. P., Wong, M. K., Yusuyin, Y., Abdu, A., Iwasaki, K., & Tanaka, S. (2014). Soil characteristics in an oil palm field, Central Pahang, Malaysia with special reference to micro sites under different managements and slope positions. Tropical Agriculture Development, 4(58), 146–154. http://
doi.org/10.11248/jsta.58.146
Xue, Z., Cheng, M., & An, S. (2013). Soil nitrogen distributions for different land uses and landscape positions in a small watershed on Loess Plateau, China. Ecological Engineering, 60, 204–213.
http://doi.org/10.1016/j.ecoleng.2013.07.045
Yao, R. J., Yang, J. S., Zhang, T. J., Gao, P., Wang, X. P., Hong, L. Z., & Wang, M. W. (2014). Determination of site-specific management zones using soil physico-chemical properties and crop yields in coastal reclaimed farmland. Geoderma,
232–234, 381–393. http://doi.org/10.1016/j.
geoderma.2014.06.006
Yu, Z., Zhang, J., Zhang, C., Xin, X., & Li, H. (2017). The coupling effects of soil organic matter and particle interaction forces on soil aggregate stability. Soil and Tillage Research, 174, 251–260. http://doi.
org/10.1016/j.still.2017.08.004
Yulnafatmawita, & Adrinal. (2014). Physical characteristics of ultisols and the impact on soil loss during soybean (Glycine max Merr) cultivation in a wet tropical area. AGRIVITA Journal of Agricultural Science, 36(1), 57–64. http://doi.org/10.17503/
Agrivita-2014-36-1-p057-064
Zhu, H., Wu, J., Guo, S., Huang, D., Zhu, Q., Ge, T., & Lei, T. (2014). Land use and topographic position control soil organic C and N accumulation in eroded hilly watershed of the Loess Plateau.
Catena, 120, 64–72. http://doi.org/10.1016/j.