IOP Conference Series: Materials Science and Engineering
PAPER • OPEN ACCESS
Design for Warehouse with Product Flow Type
Allocation using Linear Programming: A Case
Study in a Textile Industry
To cite this article: M S A Khannan et al 2018 IOP Conf. Ser.: Mater. Sci. Eng.319 012013
View the article online for updates and enhancements.
Related content
Promotion bureau warehouse system design. Case study in University of AA
N Parwati and M Qibtiyah
-Supercritical carbon dioxide for textile applications and recent developments
H A Eren, O Avinc and S Eren
-System of error detection in the manufacture of garments using artificial vision
J J Moreno, A Aguila, E Partida et al.
1234567890‘’“”
APCOMS-IMEC2017 IOP Publishing
IOP Conf. Series: Materials Science and Engineering 319 (2018) 012013 doi:10.1088/1757-899X/319/1/012013
Design for Warehouse with Product Flow Type Allocation
using Linear Programming: A Case Study in a Textile
Industry
M S A Khannan1, L Nafisah, D L Palupi
Industrial Engineering Department, Universitas Pembangunan Nasional Veteran Yogyakarta, Indonesia
Email: [email protected], [email protected],[email protected]
Abstract. Sari Warna Co. Ltd, a company engaged in the textile industry, is experiencing problems in the allocation and placement of goods in the warehouse. During this time the company has not implemented the product flow type allocation and product placement to the respective products resulting in a high total material handling cost. Therefore, this study aimed to determine the allocation and placement of goods in the warehouse corresponding to product flow type with minimal total material handling cost. This research is a quantitative research based on the theory of storage and warehouse that uses a mathematical model of optimization problem solving using mathematical optimization model approach belongs to Heragu (2005), aided by software LINGO 11.0 in the calculation of the optimization model. Results obtained from this study is the proportion of the distribution for each functional area is the area of cross-docking at 0.0734, the reserve area at 0.1894, and the forward area at 0.7372. The allocation of product flow type 1 is 5 products, the product flow type 2 is 9 products, the product flow type 3 is 2 products, and the product flow type 4 is 6 products. The optimal total material handling cost by using this mathematical model equal to Rp43.079.510 while it is equal to Rp 49.869.728 by using the company’s existing method. It saves Rp6.790.218 for the total material handling cost. Thus, all of the products can be allocated in accordance with the product flow type with minimal total material handling cost.
1. Introduction
As there is a rapid development of the industry and followed by an increasement of sophisticated technology, it can cause problems to the existance in the manufacturing industry. One of the problems encountered with the utilization of warehouse space for placing the product. A warehouse is a place to store the goods, both raw materials that will be the manufacturing process and finished goods ready for marketing. A good warehousing system is capable of utilizing the warehousing system for the storage space effectively in order to increase the utility of space and minimize material handling cost.
Sari Warna Co. Ltd in Boyolali, Central Java, Indonesia is a company engaged in the field of textile industry. One department in the company is a Weaving Department II which produces semi-finished yarn into fabric (gray). Gray cloth production is made to order that the amount of production tailored to consumer demand. In a gray warehouse at the weaving department there the product is streamed before the product is shipped to the customer. Based on the observations that have been made that the
2
1234567890‘’“”
APCOMS-IMEC2017 IOP Publishing
IOP Conf. Series: Materials Science and Engineering 319 (2018) 012013 doi:10.1088/1757-899X/319/1/012013
Department of Weaving II is still experiencing problems in the placement of the product stream for each product. In May 2016 there were placements of stock of products that did not match the products in the warehouse stock plan. Data stock products in May 2016 showed that there is a kind of fabric with conditions that are not in accordance with the stock plan products in the warehouse, i.e. the type of fabric R188, C247, R155 / 63, and R197L. The fabric types do not need to have a stock of fabrics which are stored in the warehouse based on interviews with the head of the warehouse. This leads to reduced utilization of space which will result in the fact that many products can not be accommodated in the shed. In other conditions warehouse clerks also had difficulty to locate and retrieve gray cloth, because the drafting and structuring of gray fabric warehouse that does not comply with the product stream. This leads to inaccuracy in the time of delivery of goods / products to consumers, the high total cost of the movement of products, and the products exceed the storage capacity. So, the current company’s warehouse condition is needed to be redesigned on the product flow type allocation policy case.
In the next section, we discuss the theoretical background about warehousing in section 2. The mathematical model that is used in this problem is presented in section 3. Research Methodology in section 4. A numerical example and computational result is presented in section 5. And the paper concludes with section 6.
2. Theoretical Background
Warehouse is a place with the duty to keep the items to be used for the production, until the goods are required under production schedule [1]. Here are some essential warehouse functions [2]:
1. Provide temporary storage of goods. To achieve economies of scale in production, transportation, and handling of the product, it is often necessary to store products in warehouses and issued to customers when there is a demand.
2. Put together customer orders. To save the order from the customer in large quantities.
3. Serve as a customer service facility. Because the warehouse is a storage place the product is to be shipped to the customer, the warehouse can provide services to the customer facility and handle the change as well as damage to the product, conduct market surveys, and provide aftersales services.
4. Protect goods. Warehouses are usually equipped with a circuitry security system, so that goods manufacturing results can be protected from hazards such as theft, fire, flood and other weather problems.
5. Segregate hazardous or Contaminated materials. The security code does not allow hazardous materials near the production floor, so that the warehouse be a good place to separate and put a dangerous and contaminated material.
6. Perform value-added services. Some warehouses serve as packing product value addition, preparation of customer orders based on customer specific requirements, material inspection and testing of products.
7. Inventory. Because it is difficult to forecast product demand, in some businesses, it is important to conduct an inventory and safety stock to maintain an unexpected request.
To carry out these functions, a warehouse area is usually divided into reserve storagearea,forward area, and cross-docking area.Warehouse configuration including a part of the five functional areas such as the reception area, delivery, cross-docking,reserve, and forward. Here is a possible flow of material in a warehouse [2]:
a. Flow 1: Receiving (Reception) - cross-docking - shipping (delivery) b. Flow 2: Receiving (Reception) - reserve - shipping (delivery)
c. Flow 3: Receiving (Reception) - reserve - forward - shipping (delivery) d. Flow 4: Receiving (Reception) - forward - shipping (delivery)
3.
Mathematical Model1234567890‘’“”
APCOMS-IMEC2017 IOP Publishing
IOP Conf. Series: Materials Science and Engineering 319 (2018) 012013 doi:10.1088/1757-899X/319/1/012013
The following notation used is as follows:
Parameter
i : Number of products; i = 1, 2, 3, ..., n j : Type of product flow; j = 1, 2, 3, 4 λi : Average annual demand of each product Ai : The cost of production of each product P i : The selling price of each product
pi : The average percentage of time the store in a reserve area, if the flow of products in flow type 3
di : Comparing the size of the product in the area of the reserve and forward q ij : The capacity of the product stack height in each functional area
a B C a = cross-docking, b = reserve, c = forward r : Cost savings and inventory
H ij : The cost of the movement of products in the product stream type j C ij : Cost savings per year of products in the product stream type j S i: :The space required to store each product
TS : Total warehouse capacity available Q i : The number of booking products
T i :average shelf life of each product within one year
CDLL CDUL
:minimum and maximum capacity for functional areas cross-docking
LLR, UL R
:minimum and maximum capacity for functional area reserve
LL M, UL F:
:minimum and maximum capacity for functional areas forward
The decision variables
Xij :Proportion of storage space for each functional area
α =Cross-docking, β=reserve, γ=forwardCross-docking area
Objective Function
Minimize Z= 2 ∑22𝑖=1∑4𝑗=1 qij Hij λi Xij + 0,5 ∑22𝑖=1∑4𝑗=1 qij Cij Qi Xij (1)
Constraint
∑
4𝑗=1
X
ij= 1
∀
i
(2)0,5 ∑
𝑛𝑖=1
Q
iS
iX
i1≤ a
𝛼
TS
∀
i(3)
0,5 ∑
𝑛𝑖=1Q
iS
iX
i2+
∑
𝑖=1𝑛p
iQ
iS
iX
i3≤ b
𝛽
TS
(4)0,5 ∑
𝑛𝑖=1
(1-p
i) Q
iS
iX
i3+
0,5 ∑
𝑛𝑖=1Q
iS
iX
i4≤ c
𝛾
TS
(5)α+β+ γ =1 (6)
CDLLUL≤ a≤ TSCD (7)
LL R≤ b≤ULTSR (8)
LL F≤ c≤ULTSF (9)
X ij = 0 or 1
∀
i, j (10)
Based on the cost of the annual product demand (Ai), ) the selling price of each product per unit (Pij), and the cost of transporting supplies (r), then to find economic order quantity (EOQ) with the formula:
4
1234567890‘’“”
APCOMS-IMEC2017 IOP Publishing
IOP Conf. Series: Materials Science and Engineering 319 (2018) 012013 doi:10.1088/1757-899X/319/1/012013
4. Numerical Test
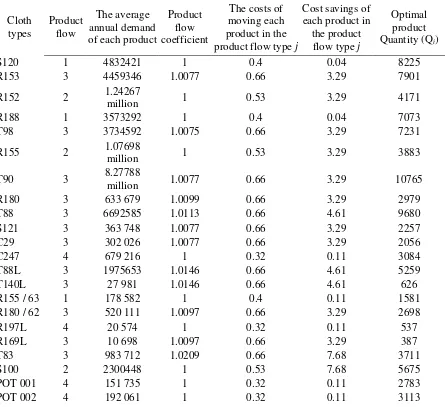
Based on the observations and data gathering, Data related to the cloth type at the Department of
Weaving II of Sari Warna Co. Ltd such as current Product flow, The average annual demand of each
product, Product flow coefficient, The costs of moving each product in the product flow type j, Cost savings of each product in the product flow type j can be shown in Table 1.
Table 1. Data related to the cloth types
Cloth types Product flow The average annual demand of each product
Product flow coefficient
The costs of moving each product in the product flow type j
Cost savings of each product in
the product flow type j
Optimal product Quantity (Qi)
S120 1 4832421 1 0.4 0.04 8225
R153 3 4459346 1.0077 0.66 3.29 7901
R152 2 1.24267
million 1 0.53 3.29 4171
R188 1 3573292 1 0.4 0.04 7073
T98 3 3734592 1.0075 0.66 3.29 7231
R155 2 1.07698
million 1 0.53 3.29 3883
T90 3 8.27788
million 1.0077 0.66 3.29 10765
R180 3 633 679 1.0099 0.66 3.29 2979
T88 3 6692585 1.0113 0.66 4.61 9680
S121 3 363 748 1.0077 0.66 3.29 2257
C29 3 302 026 1.0077 0.66 3.29 2056
C247 4 679 216 1 0.32 0.11 3084
T88L 3 1975653 1.0146 0.66 4.61 5259
T140L 3 27 981 1.0146 0.66 4.61 626
R155 / 63 1 178 582 1 0.4 0.11 1581
R180 / 62 3 520 111 1.0097 0.66 3.29 2698
R197L 4 20 574 1 0.32 0.11 537
R169L 3 10 698 1.0097 0.66 3.29 387
T83 3 983 712 1.0209 0.66 7.68 3711
S100 2 2300448 1 0.53 7.68 5675
POT 001 4 151 735 1 0.32 0.11 2783
POT 002 4 192 061 1 0.32 0.11 3113
1234567890‘’“”
APCOMS-IMEC2017 IOP Publishing
IOP Conf. Series: Materials Science and Engineering 319 (2018) 012013 doi:10.1088/1757-899X/319/1/012013
Table 2. Results of the allocation of product
No. Cloth type
Product allocation
flow 1 flow 2 flow 3 flow 4
1 S120 0 1 0 0
2 R153 0 1 0 0
3 R152 1 0 0 0
4 R188 0 1 0 0
5 T98 0 1 0 0
6 R155 1 0 0 0
7 T90 0 1 0 0
8 R180 1 0 0 0
9 T88 0 1 0 0
10 S121 0 0 0 1
11 C29 0 0 0 1
12 C247 1 0 0 0
13 T88L 0 1 0 0
14 T140L 0 0 0 1
15 R155 / 63 0 0 0 1 16 R180 / 62 1 0 0 0
17 R197L 0 0 0 1
18 R169L 0 0 0 1
19 T83 0 1 0 0
20 S100 0 1 0 0
21 POT 001 0 0 1 0
22 POT 002 0 0 1 0
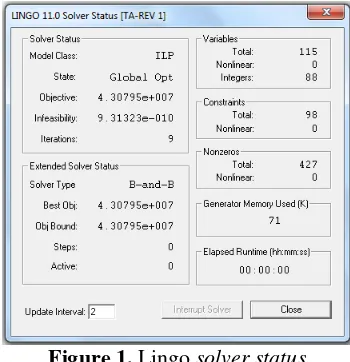
There are four flow types in the current flow type based policy as the same as in the proposed policy. The result of the allocation of product shown in Table 2 above is different with the current allocation of product (shown in Table 1). LINGO software output results stating the optimal solution or not and details of the optimization result can be seen on the Status Solver shown in Figure 1.
Figure 1. Lingo solver status
6
1234567890‘’“”
APCOMS-IMEC2017 IOP Publishing
IOP Conf. Series: Materials Science and Engineering 319 (2018) 012013 doi:10.1088/1757-899X/319/1/012013
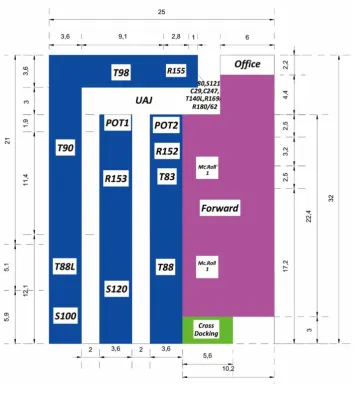
Figure 2. The current layout
From Figure 2 above, we can see that Reserve area is the greatest functional area with 55.9% followed in the second one is Forward area 41.36%, and the smallest one is crossdocking area with 2.72%.
reserve capacity calculation = Reserve 1 + Reserve 2 + Reserve 3+Reserve 4 = 279.36 m3+ 691.2m3+ 548,64m3+548,64m3
= 1530 m3
forward area capacity calculation = (l x w x h) + (l x w x h)
= (10,2 x 22,4 x 6) + (6 x 4,4 x 6) = 1,530 m3
cross-docking capacity calculation = length x width x height = 5,6 m x 3 m x 6 m = 100.8 m3
1234567890‘’“”
APCOMS-IMEC2017 IOP Publishing
IOP Conf. Series: Materials Science and Engineering 319 (2018) 012013 doi:10.1088/1757-899X/319/1/012013
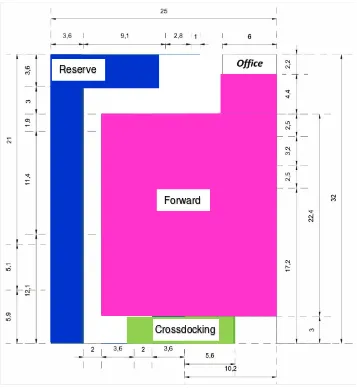
Figure 3. The Proposed Layout
Based on the Figure 3 above, it can be seen that forward area is the greatest functional in the proposed layout, followed by reserve area and crossdocking area is the smallest one. Cross docking is almost double from the current value while reserve area is decrease become the third of the current value while forward area almost double from current value. The full comparison between each fucntional area in the current layout and the proposed lay out can be seen in Table 3.
Table 3. Capacitycomparison between each functional area in the current layout and the proposed lay out
Area fungsional
Current
Layout
percentage
Proposed
Layout
percentage
Cross-docking
(α)100.8 m
32.72%
271,48 m
3 7.34%Reserve (β)
2.067.84 m
355.90%
700,52m
3 18.94%Forward (γ)
1.530 m
341.36%
2726,64m
3 73.72%The total material handling cost before the model applied is Rp 49.722.747. This result found using the mathematical model with current layout parameter. Total material handling cost after the model applied based on the output of LINGO software is Rp 43.079.510. It takes 12 times iteration process to
Forward Reserve
8
1234567890‘’“”
APCOMS-IMEC2017 IOP Publishing
IOP Conf. Series: Materials Science and Engineering 319 (2018) 012013 doi:10.1088/1757-899X/319/1/012013
obtain optimal results. Based on the calculation above, it is known that the company can reduce the total cost by switching to the proposed model by Rp 6.643.237.
5. Conclusion
In the current work we have applied a mathematical model for design warehouse flow type allocation using linear programming in a textile industry. The objective function of the mathematical model is minimizing the total material handling cost. Based on the output generated from the software LINGO it can be determined the proportions of each functional area that is Cross-docking area (α) : 0.0734, Reserve area (β) : 0.1894 , Area forward(γ) : 0.7372. All kinds of products have been allocated to each type of product flow in the warehouse, with the distribution of products included in the product stream 1 number 5 product, the product stream 2 are 9 product, the product stream 3 number 2 product, and the product stream 4 number 6 products. The total material handling cost before the model applied is Rp49.722.747. Total material handling cost sfter the proposed model applied based on the output of LINGO software is Rp.43.079.510. It takes 12 times iteration process to obtain optimal results. Based on the calculation above, the company can reduce the total cost by switching to the proposed model by Rp.6.643.237.
Suggestions needed for further research in order to improve further research are: (1) Subsequent research can be done by adding or considering new constraint function in the mathematical model of optimization that already exist (2) Need to do a review of the production and scheduling of taking goods from the warehouse to the costumer because it is directly related to the capacity and the flow of products in the warehouse.
6. References
[1] Apple J M 1990 Plant Layout and Material Handling, 3rd Ed, (Bandung: Institut Teknologi Bandung)
[2] Heragu S S 2008 Facilies Design, 3rd ed. (CRC Press)