Jakarta, Agustus 2016
Otoritas Jasa Keuangan Indonesia
Jakarta, August 2016
Indonesia Financial Services Authority Statistik Dana Pensiun Indonesia (SDPI) merupakan
media publikasi yang menyajikan data mengenai Dana Pensiun Indonesia. SDPI diterbitkan secara tahunan oleh Direktorat Statistik dan Informasi IKNB (DSIN) untuk memberikan gambaran perkembangan Dana Pensiun di Indonesia. SDPI tidak mencakup dana pensiun bagi Pegawai Negeri Sipil, TNI dan POLRI yang dikelola oleh PT Taspen dan PT Asabri.
Sehubungan dengan dimulainya Program Jaminan Pensiun pada tanggal 1 Juli 2015 oleh BPJS Ketenagakerjaan, maka SDPI tahun 2015 juga memuat perkembangan Program Jaminan Pensiun tersebut. SDPI dapat diakses melalui situs resmi Otoritas Jasa Keuangan (OJK) dengan alamat www.ojk.go.id.
Secara umum, total aset bersih Dana Pensiun Indonesia mengalami peningkatan dari tahun sebelumnya sebesar 7,08%, dari Rp192,90 triliun menjadi Rp206,51 triliun. Namun demikian, pelaku Dana Pensiun Indonesia berkurang sebanyak 7 Dana Pensiun dibandingkan tahun sebelumnya, dari 267 Dana Pensiun menjadi 260 Dana Pensiun. Terkait Program Jaminan Pensiun BPJS Ketenagakerjaan, total aset bersih program jaminan pensiun tercatat sebesar Rp2,62 triliun.
Kami senantiasa berupaya memastikan kualitas data pada buku ini. Namun demikian, apabila masih ditemukan kekurangakuratan data dan informasi yang disajikan dalam buku ini, maka kami akan melakukan revisi yang diperlukan. Akhirnya, kami berharap buku ini dapat bermanfaat bagi pengguna.
The Indonesia Pension Fund Statistic is a publication media that provides data of Indonesia Pension Fund. The SDPI is published by Directorate of Non-Bank Financial Statistics and Information annually to give an overview of Pension Fund development in Indonesia. The SDPI is not include data of the pension funds for the Civil Service, Military and Police that managed by PT TASPEN and PT Asabri.
Regarding with the commencement of pension program that managed by BPJS Ketenagakerjaan on July 1, 2015, the SDPI also include data of the development of pension program that managed by BPJS Ketenagakerjaan. SDPI is accessible through official website of Indonesia Financial Service Authority at www.ojk.go.id.
In general, total net assets of the Indonesia Pension Fund has increased from the previous year 7.08%, from Rp192,90 trillion to Rp206,51 trillion. However, the Entity of Indonesia Pension Fund were reduced by 7 compared to the previous year, from 267 to 260 Pension Fund. Related to BPJS Ketenagakerjaan Pension Program, the total net assets of the pension program was Rp2,62 trillion.
We endeavours to ensure the quality of data of this book. However, if in the future are found inaccuracy on data and information presented in this book, then we will make any necessary revisions. Finally, we hope that this book can be useful for user/stakeholders.
Content
IKHTISAR PERTUMBUHAN PROGRAM JAMINAN PENSIUN BPJS KETENAGAKERJAAN
SUMMARY OF PENSION SECURITY PROGRAM GROWTH BPJS - KETENAGAKERJAAN
STATISTIK DANA PENSIUN 2015
STATISTICS OF PENSION FUND 2015
PORTOFOLIO INVESTASI DANA PENSIUN TAHUN 2015 PENSION FUND INVESTMENT PORTFOLIO IN 2015
PORTOFOLIO INVESTASI BULANAN TAHUN 2015 MONTHLY INVESTMENT PORTFOLIO IN 2015
KINERJA INVESTASI DANA PENSIUN TAHUN 2015 PENSION FUND INVESTMENT PERFORMANCE IN 2015
PENDANAAN DANA PENSIUN FUNDING OF PENSION FUND
TINGKAT PENDANAAN DANA PENSIUN FUNDING LEVEL OF PENSION FUND
RASIO PENDANAAN DANA PENSIUN FUNDING RATIO OF PENSION FUND
RASIO SOLVABILITAS DANA PENSIUN SOLVENCY RATIO OF PENSION FUND
ASUMSI TINGKAT BUNGA ASSUMPTION OF INTEREST RATE
METODE PERHITUNGAN AKTUARIA ACTUARIAL CALCULATION METHOD
ASUMSI TINGKAT MORTALITA ASSUMPTION OF MORTALITY RATE
KEPESERTAAN PROGRAM JAMINAN PENSIUN THE MEMBERSHIP OF PENSION SECURITY PROGRAM
PERKEMBANGAN ASET NETO PROGRAM JAMINAN PENSIUN
GROWTH OF NET ASSET PENSION SECURITY PROGRAM
PORTOFOLIO INVESTASI PROGRAM JAMINAN PENSIUN INVESTMENT PORTFOLIO OF PENSION SECURITY PROGRAM
IKHTISAR PERTUMBUHAN DANA PENSIUN
SUMMARY OF PENSION FUND GROWTH
JUMLAH DANA PENSIUN NUMBER OF PENSION FUND
PROGRAM PENSIUN PENSION PLAN
KEPESERTAAN DANA PENSIUN PENSION FUND PARTICIPANT
PENYEBARAN JUMLAH PESERTA DANA PENSIUN TAHUN 2015
DISTRIBUTION OF PENSION FUND PARTICIPANTS YEAR 2015
ASET BERSIH DANA PENSIUN PENSION FUND NET ASSETS
PERTUMBUHAN ASET BERSIH DANA PENSIUN TAHUN 2011 - 2015 GROWTH OF PENSION FUND NET ASSETS YEARS 2011 - 2015
PENYEBARAN JUMLAH DANA PENSIUN, ASET BERSIH, DAN KEPESERTAAN DANA PENSIUN BERDASARKAN GRUP
DISTRIBUTION OF NUMBER PENSION FUND, NET ASSETS, NUMBER OF PARTICIPANTS MANAGED BY GROUP
INVESTASI DANA PENSIUN PENSION FUND INVESTMENT
PERTUMBUHAN INVESTASI DANA PENSIUN TAHUN 2011 - 2015
PENSION FUND INVESTMENT GROWTH IN 2011 - 2015
Kata Pengantar / Foreword Daftar Isi / Content Daftar Grafik / List of Graph Daftar Tabel / List of Table
A
B
C
D
E
F
G
H
I
J
K
M
L
N
O
P
Q
R
S
T
U
V
20 21 22 24 25 26 28 29 30 30 32 33 35 I II III V 01 04 06 10 13 14 15 17 18List of Graph
Grafik 01 Jumlah Dana Pensiun Tahun 2011 - 2015 Graph 01 The Number of Pension Fund in 2011 - 2015 Grafik 02 Alasan Pembubaran Dana Pensiun Graph 02 Reasons of Pension Fund Liquidation
Grafik 03 Penambahan (Pengurangan) Jumlah Program Pensiun di DPPK Tahun 2011 - 2015 Graph 03 Increase (Decrease) in EPF’s Pension Plan in 2011 - 2015
Grafik 04 Jumlah Pemberi Kerja di DPLK Tahun 2011 - 2015 Graph 04 The Number of Employers in the FIPF in 2011 - 2015
Grafik 05 Jumlah Peserta Dana Pensiun Menurut Jenis Dana Pensiun Tahun 2011 s.d. 2015 Graph 05 The Number of Pension Fund Participant Based on Type of Pension Fund in 2011 to 2015 Grafik 06 Komposisi Penerima Manfaat Pensiun Tahun 2015
Graph 06 The Composition of Pension Beneficiaries in 2015
Grafik 07 Penetrasi Peserta Dana Pensiun Terhadap Tenaga Kerja Nasional Tahun 2015 Graph 07 The Penetration of Pension Fund Participant on Man Power in 2015
Grafik 08 Penyebaran Jumlah Peserta Berdasarkan Grup Tahun 2015 Graph 08 Distribution of Pension Fund Participant Based on Group in 2015 Grafik 09 Persentase Dana Pensiun Berdasarkan Jumlah Peserta Tahun 2015 Graph 09 The Percentage of Pension Fund Based on Participants in 2015 Grafik 10 Distribusi Aset Bersih Dana Pensiun Tahun 2015
Graph 10 Distribution of Pension Fund Net Assets 2015
Grafik 11 Pertumbuhan Aset Bersih Dana Pensiun Tahun 2011 - 2015 Graph 11 Growth of Pension Fund Net Assets in 2011 - 2015
Grafik 12 Pertumbuhan Aset Bersih Dana Pensiun Berdasarkan Program Pensiun Tahun 2011 s.d. 2015 Graph 12 Growth of Pension Fund Net Assets Based on Pension Plan in 2011 to 2015
Grafik 13 Distribusi Jumlah Dana Pensiun, Aset Bersih, dan Peserta Dana Pensiun Berdasarkan Grup Tahun 2015 Graph 13 Distribution of Pension Fund, Net Assets, and Participants Based on Group in 2015
Grafik 14 Proporsi Investasi Dana Pensiun Tahun 2015 Graph 14 Proportion of Pension Fund Investment 2015
Grafik 15 Pertumbuhan Investasi Dana Pensiun Tahun 2011 s.d. 2015 Graph 15 Growth of Pension Fund Investment in 2011 to 2015
Grafik 16 Pertumbuhan Investasi Dana Pensiun Berdasarkan Program Pensiun Tahun 2011 s.d. 2015 Graph 16 Growth of Pension Fund Investment Based on Pension Plan in 2011 to 2015
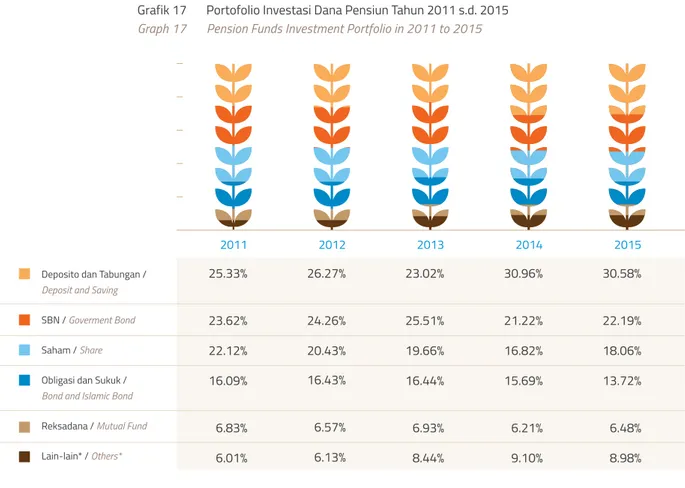
Grafik 17 Portofolio Investasi Dana Pensiun Tahun 2011 s.d. 2015 Graph 17 Pension Funds Investment Portfolio in 2011 to 2015
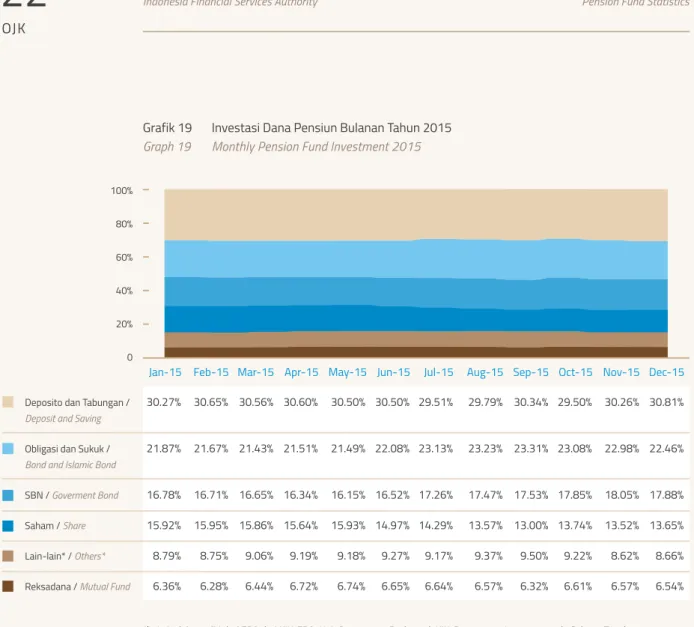
Grafik 18 Investasi Dana Pensiun di Pasar Uang dan Pasar Modal Tahun 2011 s.d. 2015 Graph 18 Pension Fund Investment in Money Market and Capital Market in 2011 to 2015 Grafik 19 Investasi Dana Pensiun Bulanan Tahun 2015
Graph 19 Monthly Pension Fund Investment 2015
03 04 05 06 08 09 09 11 12 13 14 15 16 18 18 19 20 21 22
Grafik 20 Tingkat Pengembalian Investasi Dana Pensiun Tahun 2008 s.d. 2015 Graph 20 Return On Investment of Pension Fund in 2008 to 2015
Grafik 21 Tingkat Pengembalian Investasi Dana Pensiun Berdasarkan Jenis Dana Pensiun Tahun 2008 s.d. 2015 Graph 21 Return On Investment of Pension Fund Based on Pension Fund Type in 2008 to 2015
Grafik 22 Tahun Valuasi Laporan Aktuaris Graph 22 Year Actuarial Valuation Report Grafik 23 Tingkat Pendanaan DPPK PPMP Graph 23 Funding Level of EPF DBPP Grafik 24 Rasio Pendanaan DPPK PPMP Graph 24 Funding Ratio of EPF DBPP Grafik 25 Rasio Solvabilitas DPPK PPMP Graph 25 Solvency Ratio of EPF DBPP Grafik 26 Asumsi Tingkat Bunga Graph 26 Assumption of Interest Rate
Grafik 27 Asumsi Metode Perhitungan Aktuaria Graph 27 Assumption of Actuarial Calculation Method Grafik 28 Asumsi Tingkat Mortalita Peserta Pasif Graph 28 Assumption of Passive Participant Mortality Rate
Grafik 29 Pertumbuhan Aset Neto Program Jaminan Pensiun Tahun 2015 Graph 29 Growth of Net Asset Pension Security Program in 2015
23 23 25 26 27 28 29 30 31 34
List of Table
IKHTISAR PERTUMBUHAN DANA PENSIUN
SUMMARY OF PENSION FUND GROWTH
Tabel 01 Jumlah Dana Pensiun Tahun 2011 - 2015 Table 01 Total Pension Fund in 2011 - 2015
Tabel 02 Peserta Dana Pensiun Tahun 2014 dan 2015 Table 02 Pension Fund Participant in 2014 and 2015
Tabel 03 Penetrasi Peserta Dana Pensiun Tahun 2011 s.d. 2015 Table 03 The Penetration of Pension Fund Participant in 2011 to 2015
02
07
10
KHTISAR PERTUMBUHAN PROGRAM JAMINAN PENSIUN BPJS KETENAGAKERJAAN
SUMMARY OF PENSION SECURITY PROGRAM GROWTH-BPJS KETENAGAKERJAAN Tabel 04 Kepesertaan Program Jaminan Pensiun Tahun 2015 Table 04 The Membership of Pension Security Program in 2015 Tabel 05 Aset Neto Program Jaminan Pensiun Tahun 2015 Table 05 Net Assets of Pension Security Program 2015
Tabel 06 Portofolio Investasi Program Jaminan Pensiun Tahun 2015 Table 06 Pension Security Program Investment Portfolio in 2015
33
34
35
STATISTIK INDUSTRI DANA PENSIUN 2015
STATISTICS OF PENSION FUND INDUSTRY 2015
DAFTAR GRAFIK / LIST OF GRAPH
Grafik 01 Pertumbuhan Jumlah Dana Pensiun Tahun 2005 s.d. 2015 Graph 01 Growth of Number of Pension Fund in 2005 to 2015 Grafik 02 Kompisisi Dana Pensiun Berdasarkan Grup Tahun 2015 Graph 02 Group Based on Pension Fund Composition Year 2015 Grafik 03 Kepesertaan Dana Pensiun Berdasarkan Grup Tahun 2015 Graph 03 The Membership of Pension Fund Based on Group in 2015 Grafik 04 Peserta DPPK dan DPLK Berdasarkan Grup Tahun 2015 Graph 04 The Participant of EPF and FIPF Based on Group in 2015 Grafik 05 Aset Bersih Dana Pensiun Berdasarkan Grup Tahun 2015 Graph 05 Pension Fund Net Assets Based on Group Year 2015
54
54
55
55
Grafik 06 Kepemilikan Aset Bersih dan Investasi Berdasarkan Grup Tahun 2015 Graph 06 The Ownership of Net Assets and Investments Based on Group in 2015 Grafik 07 Portofolio Investasi tahun 2003 - 2015
Graph 07 Investments Portfolio in 2003 - 2015
Grafik 08 Perkembangan Tingkat Pengembalian Investasi Tahun 2003 - 2014 Graph 08 Growth of Return On Investment 2003 - 2014
Grafik 09 Tingkat Pengembalian Investasi Dana Pensiun Tahun 2015 Graph 09 Return On Investment Pension Fund in 2015
Grafik 10 Tingkat Pengembalian Investasi Menurut Grup dan Program Dana Pensiun Tahun 2015 Graph 10 Pension Fund's Return on Investment Based on Group and Pension Plan in 2015
Grafik 11 Pertumbuhan Investasi DPLK Tahun 2010 s.d. 2015 Graph 11 Growth of FIPF Investment in 2010 to 2015
Grafik 12 Portofolio Investasi DPLK Tahun 2010 s.d. 2015 Graph 12 FIPF Investment Portfolio in 2010 to 2015 Grafik 13 Tren Investasi Bulanan DPLK Tahun 2015 Graph 13 Monthly Pension Fund Investment Trends in 2015
Grafik 14 Investasi DPLK di Pasar Uang dan Pasar Modal Tahun 2010 - 2015 Graph 14 FIPF Investment in Money Market and Capital Market 2010 - 2015 Grafik 15 Tingkat Pengembalian Investasi DPLK Tahun 2010 - 2015 Graph 15 FIPF’s Return On Investment 2010 - 2015
56 57 57 58 58 59 59 60 60 61
Tabel 01 Pertumbuhan Peserta Dana Pensiun Table 01 Growth of Pension Fund Participant
Tabel 02 Aset Bersih dan Investasi Dana Pensiun Berdasarkan Jenis Dana Pensiun Tahun 2011 s.d. 2015 Table 02 Net Assets and Investments Pension Fund Based on Type in 2011 to 2015
Tabel 03 Portofolio Investasi Dana Pensiun Tahun 2011 s.d. 2015 Table 03 Investment Portfolio of Pension Fund in 2011 to 2015 Tabel 04 Ringkasan Umum Statistik Dana Pensiun Tahun 2015 Table 04 General Summary of Pension Fund Statistics Year 2015
Tabel 05 Tingkat Pengembalian Investasi Dana Pensiun Berdasarkan Grup Tahun 2015 Table 05 Return On Investment Pension Fund Based on Group Year 2015
DAFTAR TABEL / LIST OF TABLE
39 40
40
41
Tabel 06 Rekapitulasi Dana Pensiun Berdasarkan Provinsi Table 06 Summary of Pension Funds Based on Province
Tabel 07 Laporan Aset Bersih, Perhitungan Hasil Usaha dan Neraca Dana Pensiun Per 31 Desember 2015 (Audited) Table 07 Pension Fund's Statements of Net Assets, Income Statements and Statements of Financial Position
As of December 31, 2015 (Audited)
Tabel 08 Ringkasan Laporan Keuangan Dana Pensiun Lembaga Keuangan Per 31 Desember 2015 Table 08 Summary of Financial Institution Pension Fund Financial Statement as of December 31, 2015
44
46
Summary of Pension
Fund Growth
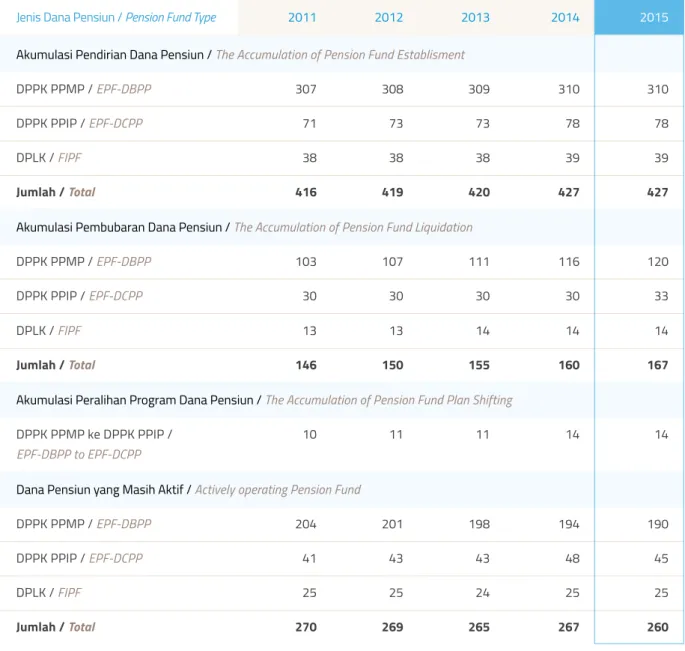
Sejak tahun 1992 sampai dengan akhir tahun 2015, tercatat sebanyak 427 Dana Pensiun yang telah memperoleh pengesahan dari Otoritas Jasa Keuangan (OJK). Namun demikian, jumlah Dana Pensiun yang masih aktif beroperasi per 31 Desember 2015 sebanyak 260 Dana Pensiun, yaitu terdiri atas 235 DPPK dan 25 DPLK.
Dibandingkan tahun sebelumnya, jumlah Dana Pensiun mengalami penurunan sebanyak 7 Dana
Since 1992 to the end of 2015, there were 427 Pension Funds which have been listed in Indonesia Financial Services Authority (FSA). However, the number of Pension Funds as of December 31, 2015 was 260 Pension Funds that are still active operating, consist of 235 EPFs and 25 FIPFs.
Compared to the previous year, the number of pension funds decreased by 7 of the Pension Fund
Jumlah Dana Pensiun
Number of Pension Fund
A.
Dana Pensiun adalah badan hukum yang mengelola dan menjalankan program yang menjanjikan Manfaat Pensiun. Secara umum, industri Dana Pensiun terdiri atas Dana Pensiun Pemberi Kerja (DPPK) dan Dana Pensiun Lembaga Keuangan (DPLK). Dalam penyelenggaraannya, DPPK dapat menjalankan Program Pensiun Manfaat Pasti (PPMP) dan Program Pensiun Iuran Pasti (PPIP), sedangkan DPLK hanya dapat menjalankan PPIP.
Pension Fund is a legal entity that manages and runs a program that promises Pensions Benefit. In general, Pension Fund industry consists of Employer Pension Fund (EPF) and the Financial Institution Pension Fund (FIPF). In its implementation, EPF can run a Defined Benefit Pension Plan (DBPP) and the Defined Contribution Pension Plan (DCPP), while the FIPF can only run DCPP.
Ikhtisar
Pertumbuhan
Dana Pensiun
Summary of Pension
Fund Growth
DPLK / FIPF Jumlah / Total 13 146 13 150 14 155 14 160 14 167
Dana Pensiun yang Masih Aktif / Actively operating Pension Fund DPPK PPMP / EPF-DBPP DPPK PPIP / EPF-DCPP DPLK / FIPF Jumlah / Total 204 41 25 270 201 43 25 269 198 43 24 265 194 48 25 267 190 45 25 260
Akumulasi Peralihan Program Dana Pensiun / The Accumulation of Pension Fund Plan Shifting DPPK PPMP ke DPPK PPIP /
EPF-DBPP to EPF-DCPP
10 11 11 14 14
Jenis Dana Pensiun / Pension Fund Type
Akumulasi Pendirian Dana Pensiun / The Accumulation of Pension Fund Establisment DPPK PPMP / EPF-DBPP DPPK PPIP / EPF-DCPP DPLK / FIPF Jumlah / Total 2015 307 71 38 416 308 73 38 419 309 73 38 420 310 78 39 427 310 78 39 427 2011 2012 2013 2014
Akumulasi Pembubaran Dana Pensiun / The Accumulation of Pension Fund Liquidation DPPK PPMP / EPF-DBPP DPPK PPIP / EPF-DCPP 103 30 107 30 111 30 116 30 120 33 Tabel 01 Jumlah Dana Pensiun Tahun 2011 s.d. 2015
Table 01 Total Pension Fund in 2011 to 2015 Pensiun karena pembubaran Dana Pensiun, yang terdiri dari 4 DPPK-PPMP dan 3 DPPK-PPIP. DPPK-PPMP yang bubar pada tahun 2015 adalah Dana Pensiun Merpati Nusantara, Atelier Enam, Avesta Continental Pack, dan Kertas Leces. DPPK-PPIP yang bubar pada tahun 2015 adalah Dana Pensiun Unilever Indonesia, Yadika, dan PT. Rheem Indonesia (Tabel 01).
for the liquidation of the Employer Pension Fund, which consists of 4 DBPP and 3 DCPP. Four EPF-DBPP which have been liquidated in 2015 are Merpati Nusantara, Atelier Enam, Avesta Continental Pack and Kertas Leces. Three EPF-DCPP which have been liquidated in 2015 was Unilever Indonesia Pension Fund, Yadika, and PT. Rheem Indonesia (Table 01).
Based on its type, during 2011 to 2015 EPFs remains a majority of Pension Fund compared with FIPFs. However, the number of EPF tends to decrease from year to year. On the other hand, the FIPF’s number is stable (Graph 01).
Berdasarkan dari jenisnya, selama periode tahun 2011 sampai dengan 2015 DPPK masih merupakan mayoritas entitas Dana Pensiun dibandingkan DPLK. Namun demikian, jumlah DPPK tersebut cenderung mengalami penurunan dari tahun ke tahun. Di lain pihak, jumlah DPLK cenderung tetap (Grafik 01).
Grafik 01 Jumlah Dana Pensiun Tahun 2011 s.d. 2015 Graph 01 The Number of Pension Fund in 2011 to 2015
2011 2012 2013 2014 2015
Jumlah Dana Pensiun / The Number Pension Funds
DPPK / EPF DPLK / FIPF
245 244 241 242 235
25 25 24 25 25
6.30%
”Jumlah Dana Pensiun yang masih aktif beroperasi per 31 Desember 2015 sebanyak 260 Dana Pensiun, yaitu terdiri atas 235 DPPK dan 25 DPLK”
"The Number of Pension Funds were still actively operating as of December 31, 2015 as many as 260 Pension Funds, which consist of 235 EPFs and 25 FIPFs"
Sejak tahun 1992 sampai dengan akhir tahun 2015, terdapat 167 Dana Pensiun yang telah ditetapkan pengesahan pembubarannya, yang terdiri atas 153 DPPK dan 14 DPLK. Faktor-faktor yang menyebabkan Pendiri mengajukan permohonan pembubaran Dana Pensiun, antara lain karena hasil investasi Dana Pensiun yang rendah; rencana program efisiensi di Pendiri; Pendiri membubarkan diri /konsolidasi/ akuisisi/ merger; Pendiri bermaksud menggabungkan Dana Pensiunnya ke Dana Pensiun lain atau mengalihkan program pensiunnya ke Program Jaminan Pensiun BPJS Ketenagakerjaan dan lain-lain.
Since 1992 until the end of 2015, there were 167 Pension Funds that have been liquidated, which consisted of 153 EPFs and 14 FIPFs. There are several factors that led the company, as Founders of Pension Fund, to liquidate their Pension Fund, such as return of pension fund’s investment is less profitable; efficiency program in founder; the founder bankrupt/ consolidated/merged; The founder joined/merged their Pension Fund with others, the company shifting their pension benefit program for their employee to pension security managed by social security agency, etc.
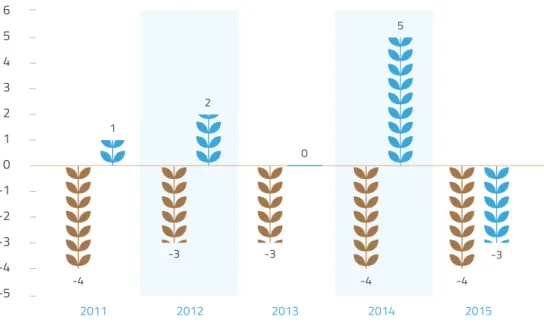
Berdasarkan jenis program pensiun, jumlah DPPK PPMP memiliki trend yang menurun dalam kurun waktu lima tahun ke belakang. Grafik 03 memperlihatkan bahwa selama periode 2011
Based on the type of pension plan, the number of EPF-DBPP tends to decrease during the last 5 years. Grafik 03 shows that from 2011 to 2015, EPF DBPP tends to decline each year. In the last five
Program Pensiun
Pension Plan
B.
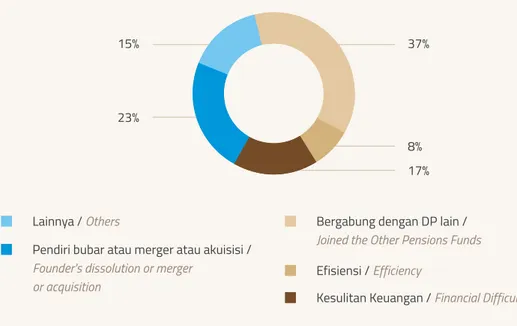
Grafik 02 Alasan Pembubaran Dana Pensiun Graph 02 Reasons of Pension Fund Liquidation
15%
23%
37%
8% 17%
Lainnya / Others Bergabung dengan DP lain /
Joined the Other Pensions Funds Efisiensi / Efficiency
Kesulitan Keuangan / Financial Difficulties Pendiri bubar atau merger atau akuisisi /
Founder's dissolution or merger or acquisition
Grafik 02 memperlihatkan bahwa alasan terbanyak dari pembubaran Dana Pensiun adalah Pendiri mengalihkan atau menggabungkan Dana Pensiunnya dengan Dana Pensiun lain. Sementara alasan berikutnya, Perusahaan selaku pendiri Dana Pensiun bubar.
Graph 02 shows that the most reason of Pension Fund liquidation is due to the company (as founder) joined/merged their Pension Fund to other Pension Fund. The second reason is due to the company (as founder) bankrupt/consolidated/merged.
Grafik 03 Penambahan (Pengurangan) Jumlah Program Pensiun di DPPK Tahun 2011 s.d. 2015 Graph 03 Increase (Decrease) in EPF’s Pension Plan in 2011 to 2015
2011 2012 2013 2014 2015 -4 1 -3 2 -3 0 -4 -3 5 -4
DPPK PPMP / EPF DBPP DPPK PPIP / EPF DCPP
6 5 4 3 2 1 0 -1 -2 -3 -4 -5
sampai dengan 2015, jumlah DPPK PPMP mengalami pengurangan setiap tahunnya. Dalam periode tersebut, jumlah DPPK PPMP berkurang sebanyak 18 Dana Pensiun.
Terkait dengan DPPK PPIP, jumlah DPPK PPIP dalam periode tersebut mengalami penambahan sebanyak 5 Dana Pensiun meskipun di tahun 2015 terdapat 3 Dana Pensiun yang dibubarkan. (Grafik 03).
years, the number of EPF DBPP has been decreased by 18 Pension Funds.
Regarding to EPF-DCPP, the number of EPF DCPP in the last five years has been increased by 5 Pension Funds even though in 2015 there were 3 Pension Funds were liquidated (Graph 03).
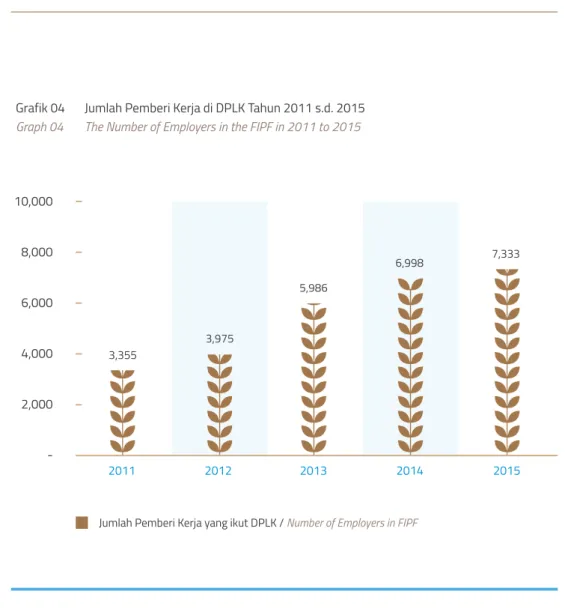
Dari tahun 2011 sampai dengan 2015, pemberi kerja yang mengikutsertakan pekerjanya sebagai peserta DPLK mengalami peningkatan sebagaimana terlihat pada Grafik 04.
From 2011 to 2015, the number of employers that proposed their employees as participant in FIPF has increased as seen in Graph 04.
Jumlah peserta Dana Pensiun pada tahun 2015 sebanyak 4.189.527 orang atau mengalami kenaikan sebesar 264.083 orang (6,30%) dibandingkan dengan tahun 2014. Peningkatan peserta terjadi pada DPLK sebanyak 268.727 peserta atau sebesar 9,78% sedangkan pada DPPK turun sebanyak 4.644 peserta sebesar 0,32% dibandingkan tahun sebelumnya (Tabel 02).
In 2015, the number of pension fund participants were 4,189,527 participants which was increased by 6.30% or increased 264,083 participants compared to 2014. The increasing of participants derived from increasing of FIPF participants 268.727 participants or increased 9.78% from previous year. Meanwhile, EPF participants decreased by 0.32% or decreased 4.644 participants from previous year. (Table 02).
Kepesertaan Dana Pensiun
Pension Fund Participant
C.
Grafik 04 Jumlah Pemberi Kerja di DPLK Tahun 2011 s.d. 2015 Graph 04 The Number of Employers in the FIPF in 2011 to 2015
2011 2012 2013 2014 2015 3,355 3,975 5,986 6,998 7,333 10,000 8,000 6,000 4,000 2,000
6.30%
6.30%
”Jumlah peserta DPPK dan DPLK pada tahun 2015 tercatat sebanyak 4.189.527 orang atau mengalami kenaikan sebesar 6,30% atau 264.083 orang”
"The Number of Participant EPF and FIPF in 2015 was 4,189,527 participants and increased by 6.30% or 264,083 participants.” 903.663 542.346 353.641 122.693 3.376 62.636 1.446.009 2.051.231 818.549 1.232.682 428.204 2.479.435 3.925.444 883.091 558.274 366.115 126.309 3.428 62.422 1.441.365 2.308.374 800.597 1.507.777 439.788 2.748.162 4.189.527 -20.572 15.928 12.474 3.616 52 -214 -4.644 257.143 -17.952 275.095 11.584 268.727 264.083 -2,33% 2,85% 3,41% 2,86% 1,52% -0,34% -0,32% 11,14% -2,24% 18,25% 2,63% 9,78% 6,30%
1. Peserta Aktif DPPK / EPF Active Participant
2. Peserta Pasif DPPK / EPF Passive Participant
- Pensiunan / Pensioner
- Janda/Duda / Widow/Widower
- Anak / Children
- Karyawan MP Tunda / Deferred Pension Benefit
3. Peserta DPPK / EPF Participant (1) + (2)
4. Peserta Aktif DPLK / FIPF Participant
- Peserta Mandiri / Independent Participant
- Peserta Kelompok / Group Participant
5. Peserta Pasif DPLK (Pensiun Ditunda) / FIPF Passive Participant (Deferred Pension)
6. Peserta DPLK / FIPF Participant (4) + (5)
Jumlah Peserta Dana Pensiun /
Total of Pension Fund Participant (3) + (6)
Uraian / Description 2014 Tahun / Years 2015 Kenaikan / Increase (Penurunan / Decrease) Orang / Man %
Tabel 02 Peserta Dana Pensiun Tahun 2014 dan 2015 Table 02 Pension Fund Participant in 2014 and 2015
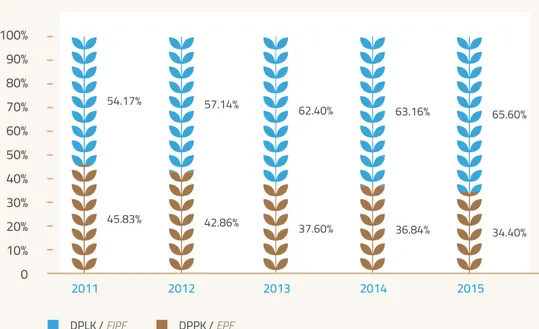
Berdasarkan peserta menurut jenis Dana Pensiun, terlihat bahwa trend peningkatan peserta terjadi pada peserta di DPLK sementara peserta di DPPK cenderung menurun. Porsi peserta DPLK menjadi lebih dominan dibandingkan peserta DPPK selama 5 tahun terakhir sebagaimana tergambar dalam grafik 05 di bawah ini.
Based on the participants by type of pension funds, it showed that increase in participants of Pension Fund derived from the increasing participants in FIPF, while participants in EPF tends to decrease. Portions of FIPF participants become more dominant than the EPF participants during the last 5 years as illustrated by the graph 05 below.
Berdasarkan data penerima manfaat pensiun di tahun 2015, komposisi penerima manfaat pensiun terdiri dari penerima manfaat pensiun normal bulanan sebesar 59,70%, penerima manfaat pensiun janda/duda bulanan sebesar 20,60%, penerima manfaat pensiun sekaligus sebesar 18,95%, penerima manfaat pensiun anak bulanan sebesar 0,56%, dan penerima manfaat pensiun dengan pembelian anuitas sebesar 0,20% (Grafik 06).
Based on the data of pension benefit beneficiaries in 2015, the composition of pension beneficiaries consists of monthly normal pension by 59.70%, the monthly widow / widower by 20.60%, pension beneficiaries at lumpsum by 18.95%, the children pension beneficiaries by 0.56%, and purchased an annuity of 0.20% (Chart 06).
Grafik 05 Jumlah Peserta Dana Pensiun Menurut Jenis Dana Pensiun Tahun 2011 s.d. 2015 Graph 05 The Number of Pension Fund Participant Based on Type of Pension Fund in 2011 to 2015
DPPK / EPF DPLK / FIPF 54.17% 45.83% 57.14% 62.40% 63.16% 65.60% 42.86% 37.60% 36.84% 34.40% 2011 2012 2013 2014 2015 100% 90% 80% 70% 60% 50% 40% 30% 20% 10% 0 54.17% 45.83% 57.14% 42.86% 62.40% 37.60% 63.16% 36.84% 65.60% 34.40%
Grafik 06 Komposisi Penerima Manfaat Pensiun Tahun 2015 Graph 06 The Composition of Pension Beneficiaries in 2015
Pensiunan / Pensioner Anuitas / Annuity Sekaligus / Lump Sum Janda/Duda / Widow/Widower Anak / Children 18.95% 0.20% 59.70% 20.60% 0.56%
Grafik 07 Penetrasi Peserta Dana Pensiun Terhadap Tenaga Kerja Nasional Tahun 2015 Graph 07 The Penetration of Pension Fund Participant on Man Power in 2015
Jumlah tenaga kerja yang belum memiliki Program Pensiun / Total of workers have not had Pension Plan
Jumlah Peserta Dana Pensiun / Total of Pension Fund Participant
6.16% 93.84% Berdasarkan data Badan Pusat Statistik pada bulan Agustus 2015, jumlah tenaga kerja yang termasuk dalam kategori berusaha sendiri, berusaha dengan buruh tetap dan buruh/ karyawan/pegawai sebanyak 68.036.477 orang. Dengan demikian, penetrasi jumlah peserta Dana Pensiun pada tahun 2015 terhadap jumlah tenaga kerja Indonesia secara nasional hanya sebesar 6,16%, sedangkan penetrasi jumlah tenaga kerja yang belum memiliki program pensiun sebesar 93,84% (Grafik 07).
Based on data from the Statistics Indonesia in August 2015, the numbers of workers who belong to the category on their own, trying to keep the workers and laborers/ employees/ employee were 68,036,477 people. Thus, the penetration of the number of participants in the Pension Fund in 2015 to the number of Indonesian workers nationally only by 6.16% while the penetration of the workers have not had pension plan by 93.84% (Graph 07).
Sejak tahun 2011 sampai dengan tahun 2015, perkembangan rasio penetrasi peserta Dana Pensiun relatif stabil pada kisaran 5,00% - 6,16%. Namun demikian, jumlah peserta Dana Pensiun dari tahun ke tahun mengalami kenaikan (Tabel 03).
Since 2011 to 2015, the growth of ratio of penetration of pension fund participant was relatively stable in the range of 5.00 – 6.16%. However, the number of pension fund participants from year to year has increased (Table 03).
*) Tenaga kerja yang berusaha sendiri, berusaha dengan buruh tetap, dan buruh/karyawan/pegawai *) Employers, who try to own business, try to be fixed workers and labor/employees
Untuk mempermudah penjelasan pada bagian-bagian berikutnya, maka Dana Pensiun dibagi menjadi tiga grup, yaitu:
• Grup I: Dana Pensiun dengan kepemilikan aset bersih sama dengan atau di atas Rp1 triliun;
• Grup II: Dana Pensiun dengan aset bersih sama dengan atau lebih dari Rp100 miliar dan kurang dari Rp1 triliun.
• Grup III: Dana Pensiun dengan kepemilikan aset bersih kurang dari Rp100 miliar.
Penyebaran jumlah peserta Dana Pensiun berdasarkan Grup Dana Pensiun dapat dilihat pada Grafik 08 di bawah ini. Pada tahun 2015,
To simplify the explanation in the next section, the pension fund is divided into three groups, namely:
• Group I: Pension Fund with net assets equal or above Rp1 trillion,
• Group II: Pension Fund with net assets equal or more than Rp100 billion and less than Rp1 trillion.
• Group III: Pension Fund with net assets less than Rp100 billion.
The distribution of participants based on the Group Pension Fund as showed in Chart 08 below. In 2015, the total participants of FIPF was 2,748,162
Penyebaran Jumlah Peserta Dana Pensiun
Tahun 2015
Distribution of Pension Fund Participants 2015
D.
Tabel 03 Penetrasi Peserta Dana Pensiun Tahun 2011 s.d. 2015 Table 03 The Penetration of Pension Fund Participant in 2011 to 2015
Jumlah Tenaga Kerja / Total of Manpower*)
Jumlah Peserta Dana Pensiun / Total of Pension Fund Participant
Penetrasi (%) / Penetration (%) Uraian / Description 2015 Tahun / Years 60.905.202 3.082.708 5,06% 62.605.346 3.345.798 5,34% 64.192.990 3.633.645 5,66% 67.045.437 3.925.444 5,85% 68.036.477 4.189.527 6,16% 2011 2012 2013 2014 • • • • • •
• • • • • • • • • • • •
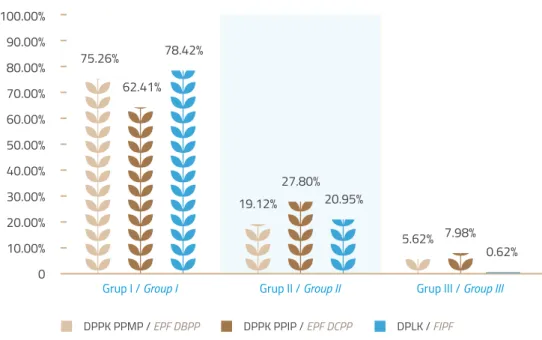
jumlah peserta Dana Pensiun terbanyak berasal dari DPLK, yaitu 2.748.162 orang atau 65,60% dari total peserta Dana Pensiun. Dari jumlah tersebut, peserta DPLK yang termasuk dalam Grup I, Grup II, dan Grup III masing-masing sebanyak 2.155.121 peserta (78,42%), 575.876 peserta (20,95%), dan 17.165 peserta (0,62%).
Jumlah peserta terbanyak berikutnya berasal dari DPPK PPMP, yaitu 1.088.755 orang atau 25,99% dari total peserta Dana Pensiun. Dari jumlah tersebut, peserta DPPK PPMP yang termasuk dalam Grup I, Grup II, dan Grup III masing-masing sebanyak 819.424 peserta (75,26%), 208.182 peserta (19,12%), dan 61.149 peserta (5,62%).
Jumlah peserta yang terkecil berasal dari peserta DPPK PPIP, yaitu sebanyak 352.610 orang atau 8,42% dari total peserta Dana Pensiun. Dari jumlah tersebut, peserta DPPK PPIP yang termasuk dalam Grup I, Grup II, dan Grup III masing-masing 226.422 peserta (64,21%), 98.042 peserta (27,80%), dan 17.165 peserta (7,98%).
participants or 65.60% of total participants. Of that total, it divided into Group I, Group II, and Group III respectively 2,155,121 participants (78.42%), 575,876 participants (20.95%), and 17,165 participants (0.62%).
Total participants of EPF DBPP were 1,088,755 participants or 25.99% of total participants. Of that total, it divided into Group I, Group II, and Group III respectively 819,424 participants (75.26%), 208,182 participants (19.12%), dan 61,149 participants (5.62%).
The total of participants of EPF DCPP were 352,610 participants or 8.42% of total participants. Of these, EPF DCPP participants were divided to Group I, Group II, and Group III respectively 226,422 participants (64.21%), 98,042 participants (27.80%), dan 17,165 participants (7.98%).
Grup II / Group II
Grup I / Group I Grup III / Group III
DPPK PPMP / EPF DBPP DPPK PPIP / EPF DCPP DPLK / FIPF
75.26% 62.41% 78.42% 19.12% 27.80% 20.95% 5.62% 7.98% 0.62% 100.00% 90.00% 80.00% 70.00% 60.00% 50.00% 40.00% 30.00% 20.00% 10.00% 0
Grafik 08 Penyebaran Jumlah Peserta Berdasarkan Grup Tahun 2015 Graph 08 Distribution of Pension Fund Participant Based on Group in 2015
Dana Pensiun dibagi menjadi 4 kategori terkait dengan jumlah peserta yang dimilikinya, yaitu:
• Kategori I: Jumlah kepesertaan kurang dari 1000 peserta;
• Kategori II: Jumlah kepesertaan lebih dari 1000 sampai dengan 10.000 peserta;
• Kategori III: Jumlah kepesertaan lebih dari 10.000 sampai dengan 50.000 peserta;
• Kategori IV: Jumlah kepesertaan lebih dari 50.000 peserta.
Berdasarkan pembagian kategori tersebut, jumlah Dana Pensiun berdasarkan kategori I, II, III dan IV masing-masing sebanyak 108 Dana Pensiun (41,54%), 111 Dana Pensiun (42,69%), 24 Dana Pensiun (9,23%), dan 17 Dana Pensiun (6,54%), sebagaimana tergambar dalam Grafik 09.
Pension funds divided into 4 categories based on the amount of participants which were managed, namely:
• Category I: Total membership of less than 1,000 participants;
• Category II: Total membership of more than 1000 to 10,000 participants;
• Category III: Total membership of more than 10,000 up to 50,000 participants;
• Category IV: Total membership of more than 50,000 participants.
Based on the distribution of these categories, the number of pension funds by categories I, II, III and IV respectively of 108 (41.54%), 111 (42.69%), 24 (9.23%) and 17 (6.54%), as illustrated in Chart 09.
Kategori I / Category I Kategori II / Category II Kategori III / Category III Kategori IV / Category IV 6.54%
42.69%
9.23%
41.54%
Grafik 09 Persentase Dana Pensiun Berdasarkan Jumlah Peserta Tahun 2015 Graph 09 The Percentage of Pension Fund Based on Participants in 2015
• • • • • Category I: • Category II: • Category III: • Category IV: 2014 2015
DPPK PPMP / EPF DBPP DPPK PPIP / EPF DCPP DPLK / FIPF
150 100 50 -133.01 20.49 39.40 136.35 22.18 47.98 Grafik 10 Distribusi Aset Bersih Dana Pensiun Tahun 2015 (Rp Triliun)
Graph 10 Distribution of Pension Fund Net Assets 2015 (IDR Trillion)
Aset Bersih Dana Pensiun
Pension Fund Net Assets
E.
Pada akhir tahun 2015 total aset bersih Dana Pensiun naik sebesar 7,08%, dari Rp192,90 triliun menjadi Rp206,51 triliun. Berdasarkan total aset tersebut, aset bersih untuk DPPK PPMP, DPPK PPIP, dan DPLK masing-masing sebesar Rp136,35 trilliun, Rp22,18 trilliun dan Rp47,98 trilliun(Grafik 10).
Aset bersih Dana Pensiun masih didominasi oleh DPPK PPMP. Nilai aset bersih DPPK PPMP, yaitu sebesar 66,03% dari total aset bersih Dana Pensiun. Sedangkan DPPK PPIP dan DPLK masing-masing sebesar 10,74% dan 23,23%.
At the end of 2015, total net assets of the Pension Fund increased by 7.08%, from Rp192.90 trillion to Rp206.51 trillion. Of total net assets, net assets for DPPK PPMP, DPPK PPIP, and DPLK respectively Rp136.35 trillion, Rp22.18 trillion and Rp47.98 trillion (Graph 10).
The total net assets of Pension Funds were still dominated by EPF DBPP by 66.03%. Meanwhile, the net assets of EPF DCPP and FIPF respectively 10.73% and 23.23% of total pension funds net assets.
Pertumbuhan Aset Bersih Dana Pensiun
Tahun 2011 - 2015
Growth of Pension Fund Net Assets 2011 - 2015
F.
Dalam kurun waktu lima tahun terakhir, aset bersih Dana Pensiun terus mengalami peningkatan. Secara umum, nilai aset bersih Dana Pensiun telah bertambah dari Rp141,58 triliun pada tahun 2011 menjadi Rp206,51 triliun pada tahun 2015 atau meningkat sebesar 45,86%. Untuk rata-rata pertumbuhan aset bersih Dana Pensiun dari tahun 2011 hingga 2015 sebesar 10,06% per tahun (Grafik 11).
In the last five years, the Pension Funds net assets increased by 45.86%, from Rp141.58 trillion to Rp206.51 trillion. The average growth of net assets for the last five years was 10.06% per year. (Graph 11)
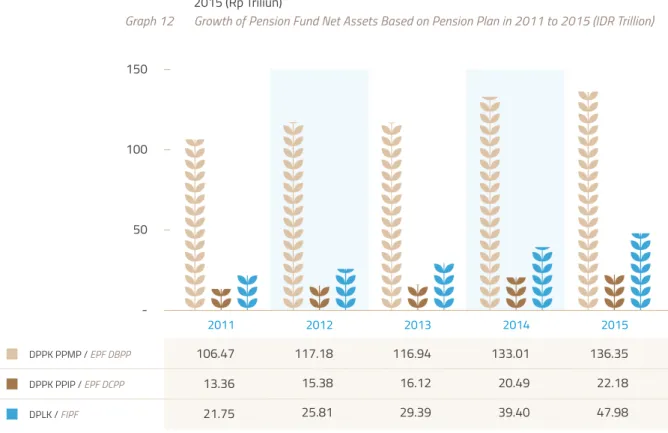
Apabila dilihat berdasarkan jenis program pensiun, selama lima tahun terakhir nilai aset bersih DPLK meningkat lebih tinggi dibandingkan dengan DPPK PPIP maupun DPPK PPMP. Selama periode tersebut, jumlah aset bersih DPLK meningkat sebesar 120,59%, dari Rp21,75 triliun menjadi Rp47,98 triliun. Untuk DPPK PPIP, jumlah aset bersih meningkat sebesar 65,99%,
Based on type of pension plan, for the last five years, the FIPF’s net assets has a higher growth than EPF DCPP and EPF DBPP. The FIPF’s net assets has increased by 120.59%, from Rp21.75 trillion to Rp47.98 trillion. The EPF DCPP’s net assets has increased by 65.99%, from Rp13.36 trillion to Rp22.18 trillion. The EPF DBPP’s net assets has increased by 28.07%, from Rp106.47 Grafik 11 Pertumbuhan Aset Bersih Dana Pensiun Tahun 2011 s.d. 2015 (Rp Triliun)
Graph 11 Growth of Pension Fund Net Assets in 2011 to 2015 (IDR Trillion)
2011 2012 2013 2014 2015 141.58 158.37 162.44 192.90 206.51 250 200 150 100 50
-106.47 13.36 21.75 117.18 15.38 25.81 116.94 16.12 29.39 133.01 20.49 39.40 136.35 22.18 47.98 DPPK PPMP / EPF DBPP DPPK PPIP / EPF DCPP DPLK / FIPF
Grafik 12 Pertumbuhan Aset Bersih Dana Pensiun Berdasarkan Program Pensiun Tahun 2011 s.d. 2015 (Rp Triliun)
Graph 12 Growth of Pension Fund Net Assets Based on Pension Plan in 2011 to 2015 (IDR Trillion)
2012 2013 2014 2015 2011 150 100 50
-Penyebaran Jumlah Dana Pensiun,
Aset Bersih, dan Kepesertaan Dana Pensiun
Berdasarkan Grup
Distribution of Number Pension Fund, Net Assets, Number
of Participants Managed by Group
G.
Penyebaran jumlah Dana Pensiun, aset bersih, dan jumlah kepesertaannya berdasarkan grup dapat dilihat pada Grafik 13 berikut ini.
the distribution of the number of pension funds, net assets, and number of participants managed based on group can be seen in Graph 13 below.
dari Rp13,36 triliun menjadi Rp22,18 triliun. Berikutnya, jumlah aset bersih DPPK PPMP meningkat sebesar 28,07%, dari Rp106,47 triliun menjadi Rp136,35 triliun (Grafik 12).
Grafik 13 diatas menunjukkan bahwa terdapat 125 Dana Pensiun berada dalam grup III. Grup III mengelola total aset bersih sebesar Rp5,11 triliun dan total peserta sebanyak 106.406 peserta. Apabila dibandingkan dengan data industri, persentase grup III untuk jumlah dana pensiun, aset bersih dan jumlah peserta masing-masing sebesar 48.08%, 2,47% dan 2,54%.
Selanjutnya, terdapat 94 Dana Pensiun pada grup II yang mengelola total aset bersih sebesar Rp37,95 triliun dan jumlah peserta sebanyak 882.100 peserta. Apabila dibandingkan dengan data industri, persentase grup II untuk jumlah dana pensiun, aset bersih dan jumlah peserta masing-masing sebesar 36,15%, 18,38% dan 21,05%.
Terakhir, terdapat 41 Dana Pensiun pada grup I yang mengelola total aset sebesar Rp163,45 triliun dan jumlah peserta sebanyak 3.200.967 peserta. Apabila dibandingkan dengan data
Graph 13 above shows that there were 125 pension funds in the group III which managed total net assets of Rp5.11 trillion and 106,406 participants. When it compared to industry, the percentage of group III related to the number of pension funds, the net assets and the number of participants respectively by 48.08%, 2.47% and 2.54%.
Furthermore, there were 94 pension funds in group II, which manage total net assets of Rp37.95 trillion and 882,100 participants. When it compared to industry, the percentage of group II related to the number of the pension fund, the net assets and the number of participants respectively by 36.15%, 18.38% and 21.05%.
there are 41 pension funds in group I, which manage total assets of Rp163,45 trillion and 3,200,967 participants. When it compared to industry, the percentage of group I related to the Grafik 13 Distribusi Jumlah Dana Pensiun, Aset Bersih, dan Peserta Dana Pensiun Berdasarkan
Grup Tahun 2015
Graph 13 Distribution of Pension Fund, Net Assets, and Participants Based on Group in 2015
350 300 250 200 150 100 50 -Grup II / Group II
Grup I / Group I Grup III / Group III
Jumlah Dana Pensiun / Total Pension Fund
Aset Bersih (Rp Triliun) / Net Assets (IDR Trillion)
Dana Peserta Pensiun (x10.000) / Pension Fund Participants (x 10.000) 41 163.45 320.10 94 37.95 88.21 125 5.11 10.65
industri, persentase grup I untuk jumlah dana pensiun, aset bersih dan jumlah peserta masing-masing sebesar 15,77%, 79,15% dan 76,40%.
Dengan demikian, aset bersih dan jumlah peserta di industri Dana Pensiun terkonsentrasi pada grup I. Kondisi ini dapat menjadi pertimbangan dalam metode pengawasan terhadap industri dana pensiun.
number of the pension fund, the net assets and the number of participants respectively by 15.77%, 79.15% and 76.40%.
Thus, the net assets and the number of participants in the pension fund industry was concentrated in group I. These conditions can be taken into consideration in the method of supervision of the pension fund industry.
6.30%
“Terdapat 41 Dana Pensiun di Grup I yang mengelola aset bersih sebesar Rp163,45 triliun dan 3.200.967 peserta atau 79,15% dari total aset bersih industri dan 76,40% dari total peserta di industri”
"There are 41 pension funds in Group I, which managed net assets of Rp163,45 trillion and 3,200,967 participants or 79.15% of the total net assets of the industry and 76.40% of the total participants in the industry"
Dalam kurun waktu tahun 2011 sampai dengan 2015, rata-rata rasio investasi terhadap aset bersih sebesar 96,89%. Hal ini karena investasi merupakan salah satu sumber pendanaan utama bagi Dana Pensiun. Per posisi Desember 2015, nilai investasi Dana Pensiun sebesar Rp200,35 triliun atau sebesar 97,01% dari total aset bersih Dana Pensiun. Nilai investasi tersebut meningkat sebesar 7,63%, dari Rp184,14 triliun menjadi sebesar Rp200,35 triliun.
Berdasarkan jenis Dana Pensiun, peningkatan investasi untuk DPLK, DPPK PPIP dan DPPK PPMP masing-masing 24,30%, 9,06% dan 2,43%. Meskipun demikian, total investasi DPPK PPMP masih terbesar yaitu 65,33% dari total investasi industri. Sementara porsi total investasi untuk DPLK dan DPPK PPIP masing-masing sebesar 23,68% dan 10,99% (Grafik 14).
In the period of 2011 to 2015, the average ratio of investment to net assets amounted to 96.89%. This is because the investment is one of the main sources of funding for the Pension Fund. Per December 2015, the total investment of pension funds were Rp200,35 trillion or 97.01% of the total net assets of industry. The investment of pension fund increased by 7.63%, from Rp184,14 trillion to Rp Rp200,35 trillion.
Based on the type of pension funds, increased investment for FIPF, EPF-DCPP and EPF-DBPP respectively 24.30%, 9.06% and 2.43%. However, EPF-DBPP has the largest portion of investment in industry, that was 65.33% of total investment of industry. While the portion of the total investment for FIPF and EPF-DCPP respectively 23.68% and 10.99% (Graph 14).
Investasi Dana Pensiun
Pension Fund Investment
Grafik 14 Proporsi Investasi Dana Pensiun Tahun 2015 Graph 14 Proportion of Pension Fund Investment 2015
DPPK-PPMP / EPF-DBPP DPPK-PPIP / EPF-DCPP DPLK / FIPF 23.68% 10.99% 65.33%
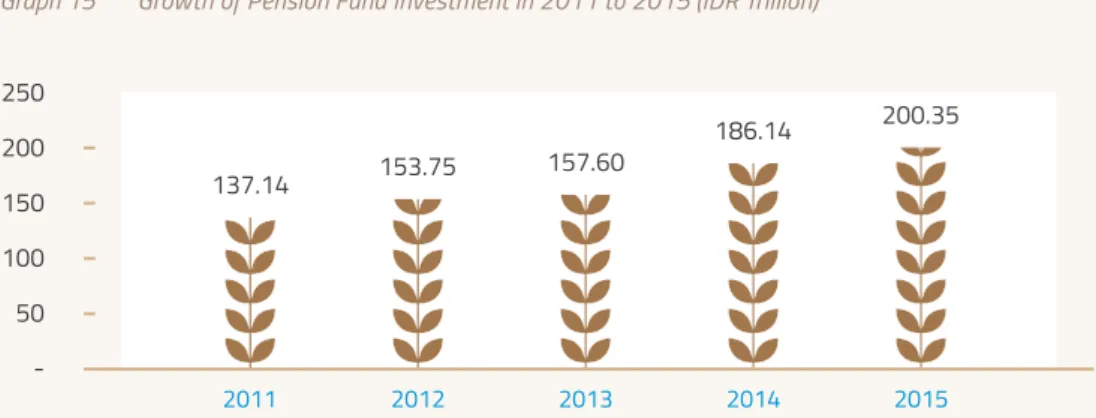
Dalam kurun waktu 5 tahun terakhir, nilai investasi Dana Pensiun meningkat sebesar 46,09%, yaitu dari Rp137,14 triliun menjadi Rp200,35 triliun. Apabila dilihat dari pertumbuhan per tahunnya, rata-rata pertumbuhan investasi Dana Pensiun selama periode tahun 2011 sampai dengan 2015 sebesar 10,09% per tahun (Grafik 15).
From 2011 to 2015, the investments of pension fund increased by 46.09%, from Rp137,14 trillion to Rp200,35 trillion. Regarding to growth per year, the average growth per year of the investment during the last five year was 10.09% per year (Graph 15).
Pertumbuhan Investasi Dana Pensiun
2011 - 2015
Pension Fund Investment Growth 2011 - 2015
I.
Grafik 15 Pertumbuhan Investasi Dana Pensiun Tahun 2011 s.d. 2015 (Rp Trilliun) Graph 15 Growth of Pension Fund Investment in 2011 to 2015 (IDR Trillion)
2012 2013 2014 2015 2011 137.14 153.75 157.60 186.14 200.35 250 200 150 100 50
-6.30%
6.30%
”Selama 5 tahun terakhir, investasi Dana Pensiun meningkat sebesar 46,09%, dari Rp137,14 triliun menjadi Rp200,35 triliun, dengan pertumbuhan rata-rata sebesar 10,09% per tahun”
"Over the last 5 years, the Pension Fund increased by 46.09%, from Rp137,14 trillion to Rp200,35 trillion, with an average growth of 10.09% per year"
Terkait pertumbuhan investasi berdasarkan jenis Dana Pensiun, selama 5 tahun terakhir, ketiga jenis Dana Pensiun mengalami peningkatan di investasinya. Investasi DPLK meningkat sebesar 120,02%, dari Rp21,26 triliun menjadi Rp47,44 triliun. Investasi DPPK-PPIP mengalami peningkatan sebesar 69,10%, dari Rp13,02 triliun menjadi Rp22,02 triliun. Investasi DPPK-PPMP meningkat sebesar 27,63%, dari Rp102,56 triliun menjadi Rp130,89 triliun.
Secara rata-rata pertumbuhan investasi per tahun dalam periode lima tahun terakhir untuk DPLK, DPPK-PPIP dan DPPK-PPMP masing-masing sebesar 21,91%, 14,38%, dan 6,43%. Dengan demikian, DPLK mengalami peningkatan investasi yang lebih tinggi dibandingkan dengan DPPK PPIP dan DPPK PPMP (Grafik 16).
The investment growth of FIPF during 2011 to 2015 has increased 120.02% from Rp21.26 trillion to Rp47.44 trillion. As well as EPF DCPP and EPF DBPP have increased, respectively 69.10% or Rp13.02 trillion to Rp22.02 trillion and 27.63% or Rp102.56 trillion to Rp 130.89 trillion. Thus, the data shown that the growth of FIPF’s investment has the highest growth in type of pension funds.
On the average investment growth per annum in the last five years for FIPF, EPF-DCPP and EPF-DBPP respectively 21.91%, 14.38%, and 6.43% Thus, FIPF has increased investment that is higher than EPF-DCPP and EPF-DBPP (Graph 16).
Grafik 16 Pertumbuhan Investasi Dana Pensiun Berdasarkan Program Pensiun Tahun 2011 s.d. 2015 (Rp Triliun)
Graph 16 Growth of Pension Fund Investment Based on Pension Plan in 2011 to 2015 (IDR Trillion)
2012 2013 2014 2015 2011 150 100 50
-DPPK PPMP / EPF DBPP DPPK PPIP / EPF DCPP DPLK / FIPF
102.56 13.02 21.56 112.82 15.37 25.56 112.64 15.91 29.05 127.79 20.19 38.16 130.89 22.02 47.44
Berdasarkan Peraturan OJK nomor 3/POJK.05/2015 tanggal 31 Maret 2015 tentang Investasi Dana Pensiun, terdapat 17 jenis investasi yang diperkenankan oleh regulator. Di antara 17 jenis investasi tersebut, terdapat 4 jenis investasi yang mendominasi portofolio investasi Dana Pensiun, yaitu Deposito, Surat Berharga Negara (SBN), Saham, dan Obligasi dengan porsi masing-masing sebesar 30,58%, 22,19%, 18,06%, dan 13,72% (Grafik 17).
Based on the FSA Rule number 3/ POJK.05/2015 dated March 31, 2015 on Pension Fund Investment, there are 17 types instruments of investment allowed by the regulator. Among the 17 types of instruments, there are 4 instruments of investment that dominate the investment portfolio of pension funds industry, namely deposits, Government Bonds, stocks, and bonds with a portion of each respectively 30.58%, 22.19%, 18, 06%, and 13.72% (Graph 17).
Portofolio Investasi Dana Pensiun
Pension Fund Investment Portfolio
J.
Grafik 17 Portofolio Investasi Dana Pensiun Tahun 2011 s.d. 2015 Graph 17 Pension Funds Investment Portfolio in 2011 to 2015
*) Lain-lain terdiri dari EBA dari KIK-EBA, Unit Penyertaan Berbentuk KIK, Penyertaan Langsung pada Saham, Tanah dan Bangunan, dan Investasi lain yang diperkenankan.
*) Others consists of Assets backed Security. Collective Investment Contract. Direct Placement in Share. Land and Building. and Other Admitted Investments
25.33% 23.62% 22.12% 16.09% 6.83% 6.01% Deposito dan Tabungan /
Deposit and Saving
SBN / Goverment Bond
Saham / Share
Obligasi dan Sukuk /
Bond and Islamic Bond
Reksadana / Mutual Fund
Lain-lain* / Others* 26.27% 24.26% 20.43% 16.43% 6.57% 6.13% 23.02% 25.51% 19.66% 16.44% 6.93% 8.44% 30.96% 21.22% 16.82% 15.69% 6.21% 9.10% 30.58% 22.19% 18.06% 13.72% 6.48% 8.98% 2012 2013 2014 2015 2011 100 80 60 40 20
-Apabila portofolio investasi industri dana pensiun diklasifikasi menjadi instrumen pasar uang dan instrumen pasar modal, maka komposisi investasi dana pensiun: pasar uang 60,62%, pasar modal 30,58% dan lain-lain 8,8% (penyertaan langsung, tanah dan bangunan).
If the investment portfolio of the pension fund industry are classified into money market and capital market instruments, the composition of pension fund investment: 60.62% money market, capital market 30.58% and others 8.8% (direct investment, land and building).
Grafik 18 Investasi Dana Pensiun di Pasar Uang dan Pasar Modal Tahun 2011 s.d. 2015 Graph 18 Pension Fund Investment in Money Market and Capital Market in 2011 to 2015
Berdasarkan data bulanan yang berasal dari laporan keuangan unaudited, diketahui bahwa deposito, obligasi, SBN dan saham merupakan empat instrumen investasi yang menjadi pilihan berinvestasi bagi Dana Pensiun. Per Desember 2015, nilai deposito, obligasi, SBN dan saham masing-masing sebesar Rp61,15 Trilliun, Rp44,70 Trilliun, Rp35,60 Trilliun dan Rp27,17 Trilliun. Selanjutnya, persentase nilai keempat investasi tersebut terhadap total invesasi industri adalah sebagai berikut: Deposito 30,81%, Obligasi 22,46%, SBN 17,88% dan Saham 13,65%.
Based on recapitulation of data from the unaudited monthly financial statements, it is known that the deposits, bonds, government securities and shares represent four investment instrument of choice for pension funds to invest. As of December 2015, the value of deposits, bonds, government securities and shares respectively Rp61,15 Trillion, Trillion Rp44,70, and Rp27,17 Rp35,60 Trillion Trillion. Furthermore, the percentage of four instrument of investments compared to total investment in industry are as follows: Deposits 30.81%, Bonds 22.46%, Government Bonds 17.88% and Stocks 13.65%.
Portofolio Investasi Bulanan Tahun 2015
Monthly Investment Portfolio in 2015
K.
68.66% 25.33% 67.59% 26.27% 23.02% 68.55% 30.96% 59.94% 30.58% 60.62% 2012 2013 2014 2015 2011 80% 70% 60% 50% 40% 30% 20% 10% 0Tingkat pengembalian investasi (Return on Investment/ROI) merupakan salah satu ukuran kinerja investasi Dana Pensiun. Semakin besar ROI yang dicapai, kinerja investasi Dana Pensiun semakin baik. Berdasarkan data keuangan tahun 2015, Dana Pensiun secara keseluruhan memperoleh ROI sebesar 9,79% atau meningkat dari 8,28% di periode sebelumnya. (grafik 20).
The return on investment (Return on Investment / ROI) is one measure of the performance of pension fund investments. The greater the ROI achieved, pension fund investment performance is getting better. Based on the financial data in 2015, the ROI of Pension Fund industry were 9.79%, or increased from 8.28% in the previous period. (Graph 20).
Kinerja Investasi Dana Pensiun
Pension Fund Investment Performance
L.
Grafik 19 Investasi Dana Pensiun Bulanan Tahun 2015 Graph 19 Monthly Pension Fund Investment 2015
30.27% 21.87% 16.78% 15.92% 8.79% 6.36% 30.65% 21.67% 16.71% 15.95% 8.75% 6.28% 30.56% 21.43% 16.65% 15.86% 9.06% 6.44% 30.60% 21.51% 16.34% 15.64% 9.19% 6.72% 30.50% 21.49% 16.15% 15.93% 9.18% 6.74% 30.50% 22.08% 16.52% 14.97% 9.27% 6.65% 29.51% 23.13% 17.26% 14.29% 9.17% 6.64% 29.79% 23.23% 17.47% 13.57% 9.37% 6.57% 30.34% 23.31% 17.53% 13.00% 9.50% 6.32% 29.50% 23.08% 17.85% 13.74% 9.22% 6.61% 30.26% 22.98% 18.05% 13.52% 8.62% 6.57% 30.81% 22.46% 17.88% 13.65% 8.66% 6.54% Deposito dan Tabungan /
Deposit and Saving
Obligasi dan Sukuk /
Bond and Islamic Bond
SBN / Goverment Bond
Saham / Share
Lain-lain* / Others*
Reksadana / Mutual Fund
*) Lain-lain terdiri dari EBA dari KIK-EBA, Unit Penyertaan Berbentuk KIK, Penyertaan Langsung pada Saham, Tanah dan Bangunan, dan Investasi lain yang diperkenankan.
*) Others consists of Assets backed Security. Collective Investment Contract. Direct Placement in Share. Land and Building. and Other Admitted Investments
100% 80% 60% 40% 20% 0
DPPK PPMP / EPF DBPP DPPK PPIP / EPF DCPP DPLK / FIPF 2008 2009 2010 2011 2012 2013 2014 2015 -4.00% 21.83% 16.10% 7.62% 12.11% 3.67% 8.57% 10.59% -5.92% 24.71% 16.90% 9.01% 13.24% 3.17% 7.71% 7.58% 4.68% 16.16% 10.95% 8.80% 8.24% 3.64% 7.11% 8.45%
” ROI Dana Pensiun secara keseluruhan tahun 2015 sebesar 9,79%” " ROI of Industry of Pension Fund in 2015 were 9.79%"
Sementara itu, dari sisi kinerja per jenis Dana Pensiun, capaian ROI yang diperoleh DPPK-PPMP, DPPK-PPIP dan DPLK pada tahun 2015 masing-masing sebesar 10,59%, 8,45% dan 7,58%. Kondisi tersebut lebih tinggi dari tahun 2014 (Grafik 21).
Based on the type of Pension Fund, the ROI for each type of Pension Fund in 2015 as follow EPF-DBPP, EPF-DCPP, and FIPF in 2014 respectively 10.59%, 8.45% and 7.58%. Achievements of ROI in 2015 were higher than the ROI in 2014 (Graph 21). 2008 2009 2010 2011 2012 2013 2014 2015 40% 35% 30% 25% 20% 15% 10% 5% 0 -5% -10%
Grafik 20 Tingkat Pengembalian Investasi Dana Pensiun Tahun 2008 s.d. 2015 Graph 20 Return On Investment of Pension Fund in 2008 to 2015
Grafik 21 Tingkat Pengembalian Investasi Dana Pensiun Berdasarkan Jenis Dana Pensiun Tahun 2008 s.d. 2015
Graph 21 Return On Investment of Pension Fund Based on Pension Fund Type in 2008 to 2015
30% 20% 10% 0 -10% Return On Investment -6.32% 38.38% 28.74% 9.22% 12.21% 3.59% 8.28% 9.79%
Dalam subbab selanjutnya, akan dijelaskan mengenai tahun valuasi aktuaris, tingkat pendanaan Dana Pensiun, rasio pendanaan, rasio solvabilitas, asumsi tingkat bunga, metode perhitungan aktuaris, dan asumsi tingkat mortalita yang hanya mencakup tentang Dana Pensiun Pemberi Kerja yang menyelenggarakan program pensiun manfaat pasti.
In the next subsection, will be explained about the actuarial valuation, the level of pension funds funding, funding ratio, solvency ratio, interest rate assumptions, actuarial calculation methods, and mortality rate assumptions which only covered about Employer Pension Funds Define Benefit Pension Program.
Aspek penting lainnya dalam penyelenggaraan Dana Pensiun, yaitu pendanaan, yang umumnya berasal dari iuran maupun hasil pengembangannya. Iuran tersebut dapat dilakukan oleh pemberi kerja sendiri atau bersama-sama antara pemberi kerja dan pekerja (peserta).
Kondisi pendanaan bagi DPPK PPMP merupakan tanggung jawab pemberi kerja. Oleh karena itu, risiko keuangan tetap berada pada pemberi kerja. Sementara untuk DPPK PPIP, risiko keuangan pada pendanaan merupakan tanggung jawab peserta dan sangat bergantung pada periode waktu pemupukan dana dan pilihan jenis investasinya.
DPPK PPMP dapat dikatakan dalam keadaan dana terpenuhi, apabila jumlah aset bersihnya telah mencukupi untuk memenuhi liabilitasnya. Apabila aset bersih tersebut kurang dari liabilitasnya, pemberi kerja mempunyai kewajiban untuk melakukan pembayaran sejumlah dana tambahan guna tercapainya keadaan dana terpenuhi. Berbeda dengan DPPK PPMP, DPPK PPIP dikatakan dalam keadaan dana terpenuhi apabila iuran bulanan yang jatuh tempo telah disetorkan dengan tepat jumlah ke DPPK PPIP.
Another important aspect in the implementation of Pension Fund, namely funding, which generally comes from contribution and investment result. Contribution can be done by the employer alone or jointly between employers and employees (participants).
EPF DBPP funding condition is the responsibility of employer. Therefore, financial risk remains with the employer. As for EPF DCPP, the financial risk of funding is the responsibility of participants and depends on the time period of fund accumulation and types of investment options.
EPF DBPP can be stated as a fully funded condition, if its assets have sufficient to meet its liabilities. If its asset is less than its liabilities, the employer has the obligation to make a payment of additional funds in order to achieve a fully funded condition. Unlike EPF DBPP, EPF DCPP is stated to be a fully funded condition, if monthly accrued contribution has been paid with the appropriate amount to EPF DCPP.
Pendanaan Dana Pensiun
Funding of Pension Fund
Untuk mengukur dan mengetahui kondisi pendanaan DPPK PPMP, regulasi mewajibkan DPPK PPMP melakukan valuasi aktuaria, yaitu sekurang-kurangnya tiga tahun sekali. Namun demikian, apabila hasil valuasi aktuaria menunjukkan kondisi pendanaan berada pada tingkat ketiga, DPPK PPMP diwajibkan untuk melakukan valuasi aktuaria pada tahun berikutnya.
Data statistik mengenai pendanaan DPPK PPMP ini terhimpun dari laporan aktuaris terakhir yang dilaporkan. Laporan tersebut terdiri atas laporan aktuaris dengan tahun valuasi 2013, 2014, dan 2015 masing-masing sebesar 23,16%, 52,63% dan 24,21% (Grafik 22).
To measure and determine EPF DBPP funding condition, regulation requires EPF DBPP takes actuarial valuation, which is at least three years. However, if the results of actuarial valuation showed funding condition is at the third level, EPF DBPP has to perform an actuarial valuation in the following year.
Statistical data on EPF DBPP funding is collected from the last actuarial report reported. The report consists of a report by the actuarial valuation in 2013, 2014 and 2015, respectively 23.16%, 52.63% and 24.21% (Graph 22).
Tingkat pendanaan Dana Pensiun merupakan gambaran kemampuan Dana Pensiun untuk membiayai liabilitas Dana Pensiun saat ini dan yang akan datang. Besar liabilitas Dana Pensiun tersebut dihitung pada saat tanggal valuasi. Tingkat pendanaan Dana Pensiun diukur dengan membandingkan jumlah aset bersih Dana
Pension Fund funding rate is a picture of the ability of Pension Fund to finance its liabilities currently and in the future. The amount of Pension Fund liabilities is calculated at the date of valuation. Pension Fund funding rate is measured by comparing the amount of Pension Fund assets to its solvency liabilities and actuarial present value of
Tingkat Pendanaan Dana Pensiun
Funding Level of Pension Fund
N.
Grafik 22 Tahun Valuasi Laporan Aktuaris Graph 22 Year Actuarial Valuation Report
23.16% 24.21% 52.63% Tahun 2013 / Year 2013 Tahun 2014 / Year 2014 Tahun 2015 / Year 2015
Pensiun dengan kewajiban solvabilitas dan nilai kini aktuaria Dana Pensiun. Ada tiga kriteria tingkat pendanaan Dana Pensiun, yaitu tingkat pertama, tingkat kedua dan tingkat ketiga.
Pendanaan tingkat pertama terjadi bila aset bersih Dana Pensiun untuk pendanaan lebih besar dari nilai kini aktuarianya. Kondisi ini disebut juga Dana Pensiun berada dalam keadaan dana terpenuhi. Pendanaan tingkat kedua terjadi bila aset bersih Dana Pensiun untuk pendanaan kurang dari nilai kini aktuaria dan tidak kurang dari kewajiban solvabilitas. Pendanaan tingkat ketiga yaitu apabila aset bersih untuk pendanaan kurang dari kewajiban solvabilitas. Dalam kondisi ini, Dana Pensiun disebut juga berada dalam keadaan tidak solven. Dari 190 (seratus sembilan puluh) DPPK PPMP, terdapat sebanyak 36,84% Dana Pensiun memiliki pendanaan tingkat pertama, 36,32% tingkat kedua, dan 26,84% tingkat ketiga (Grafik 23).
Pension Fund. There are three criteria for the funding level of the Pension Fund, which are the first level, second level and third level.
The first occurs when the funding level of Pension Fund assets to finance is the greater of its actuarial present value. This condition is also called fully funded Pension Fund. The second occurs when the level of funding Pension Fund assets to finance is less than its actuarial present value but not less than its solvency liabilities. The third level of funding if Pension Fund assets are less than its solvency liabilities. In this condition, it is called an insolvent Pension Fund.
Of 190 (one hundred and ninety) EPF DBPP, there are 36.84% Pension Fund have a first funding level, 36.32% at the second level, and 26.84% at the third level (Graph 23).
Grafik 23 Tingkat Pendanaan DPPK PPMP Graph 23 Funding Level of EPF DBPP
Pendanaan Tingkat Pertama / First Level
Pendanaan Tingkat Ketiga / Third Level Pendanaan Tingkat Kedua / Second Level 26.84%
36.84%
36.32%
Rasio Pendanaan Dana Pensiun sangat berkaitan dengan kemampuan Dana Pensiun dalam memenuhi liabilitas pembayaran manfaat
Funding Ratio of Pension Fund is related to the ability of Pension Fund to meet the payment obligations of pension benefits in the long term.
Rasio Pendanaan Dana Pensiun
Funding Ratio of Pension Fund
O.
• • • • • • • • RP IV : • • • • • • • • RP IV :• • • • • • • • RP IV :
Grafik 24 Rasio Pendanaan DPPK PPMP Graph 24 Funding Ratio of EPF DBPP
Rasio Pendanaan II / Funding Ratio II Rasio Pendanaan III / Funding Ratio III Rasio Pendanaan IV / Funding Ratio IV Rasio Pendanaan I / Funding Ratio I
12.63%
4.74% 46.84%
35.79% pensiun secara jangka panjang. Terkait dengan Rasio Pendanaan, ketentuan Menteri Keuangan mengenai pendanaan Dana Pensiun mengatur bahwa pemberi kerja dapat menggunakan surplus sebagai pengurang iuran normal pemberi kerja ke Dana Pensiun.
Selanjutnya untuk mempermudah penjelasan rasio pendanaan Dana Pensiun dibagi dalam 4 (empat) kategori, yaitu :
• RP I : Dana Pensiun dengan rasio pendanaan lebih dari 100%;
• RP II : Dana Pensiun dengan rasio pendanaan lebih dari 75% atau kurang dari sama dengan 100%;
• RP III : Dana Pensiun dengan rasio pendanaan lebih dari 50% atau kurang dari sama dengan 75%;
• RP IV : Dana Pensiun dengan rasio pendanaan kurang dari 50%.
Berdasarkan Grafik 24 di bawah ini, dapat dijelaskan bahwa sebagian besar DPPK PPMP memiliki rasio pendanaan kategori RP II sebesar 46,84% atau 89 (delapan puluh sembilan) Dana Pensiun, sedangkan DPPK PPMP rasio pendanaan diatas 100% sebanyak 68 (enam puluh delapan) Dana Pensiun atau 35,79% dari total DPPK PPMP dan sisanya merupakan Dana Pensiun yang mempunyai rasio pendanaan dibawah 75%.
Related to the Funding Ratio, the Minister of Finance Decree regarding Pension Fund funding stipulated the use of surplus to the employer as a reduction in the employer contribution to Pension Funds.
Then to simplify the explanation of pension funds funding rate is divided by 4 (four) categories namely :
• RP I : Pension Funds Funding Ratio is more than 100%;
• RP II : Pension Funds Funding Ratio is more than 75% or less than equal to 100%;
• RP III : Pension Funds Funding Ratio is more than 50% or less than equal to 75%;
• RP IV : Pension Funds Funding Ratio is less than 50%.
Based on Graph 24 below, can be explained that almost of EPF DBPP had funding ratio in RP II category amount 46.84% or 89 (eighty nine) EPF DBPPs, while EPF DBPP funding ratio above 100% as many 68 (sixty eight) Pension Funds or 35.79% from total EPF DBPP and the rest is pension funds funding ratio below 75%.
Hasil penghitungan Rasio Solvabilitas biasanya digunakan untuk menilai kondisi pendanaan Dana Pensiun dengan asumsi Dana Pensiun dibubarkan pada saat tanggal penghitungan dilakukan. Gambaran mengenai Rasio Solvabilitas DPPK PPMP terlihat pada Grafik 25.
The calculation result of Solvency Ratio is usually used to assess the financial condition of Pension Fund with the assumption that the Pension Fund dissolved on the date of the calculation is done. Overview of the EPF DBPP Solvency Ratio is seen in Graph 25.
Selanjutnya untuk mempermudah penjelasan rasio solvabilitas Dana Pensiun dibagi dalam 4 (empat) kategori, yaitu :
• RS I : Dana Pensiun dengan rasio solvabilitas lebih dari 100%;
• RS II : Dana Pensiun dengan rasio solvabilitas lebih dari 75% atau kurang dari sama dengan 100%; • RS III : Dana Pensiun dengan rasio solvabilitas lebih
dari 50% atau kurang dari sama dengan 75%; • RS IV : Dana Pensiun dengan rasio solvabilitas
kurang dari 50%.
Berdasarkan Grafik 25 di atas, dapat dijelaskan bahwa mayoritas DPPK PPMP mempunyai rasio solvabilitas di atas 100% yaitu 137 (seratus tiga
Then to simplify the explanation of pension funds solvency ratio is divided by 4 (four) categories namely :
• RS I :Pension Funds Solvency Ratio is more than 100%; • RS II : Pension Funds Solvency Ratio is more
than 75% or less than equal to 100%;
• RS III : Pension Funds Solvency Ratio is more than 50% or less than equal to 75%;
• RS IV : Pension Funds Solvency Ratio is less than 50%.
Based on Graph 25 above, can be explained that majority of EPF DBPP had solvency ratio above 100% that is 137 (one hundred thirty seven) EPF
Rasio Solvabilitas Dana Pensiun
Solvency Ratio of Pension Fund
P.
Grafik 25 Rasio Solvabilitas DPPK PPMP Graph 25 Solvency Ratio of EPF DBPP
Rasio Solvabilitas I / Solvency Ratio I 4.21%
3.16% 20.53%
72.11%
Rasio Solvabilitas II / Solvency Ratio II Rasio Solvabilitas III / Solvency Ratio III Rasio Solvabilitas IV / Solvency Ratio IV
≥ 10% ≥ 10% 8% ≤ Tk. Bunga 8% ≤ • • • • • • • • RS IV :