Analytical methods for
food additives
Roger Wood, Lucy Foster, Andrew Damant
and Pauline Key
CRC Press
Boca Raton Boston New York Washington, DC
www.woodhead-publishing.com
Published in North America by CRC Press LLC, 2000 Corporate Blvd, NW Boca Raton FL 33431, USA
First published 2004, Woodhead Publishing Ltd and CRC Press LLC © 2004, Woodhead Publishing Ltd
The authors have asserted their moral rights.
This book contains information obtained from authentic and highly regarded sources. Reprinted material is quoted with permission, and sources are indicated. Reasonable efforts have been made to publish reliable data and information, but the authors and the publishers cannot assume responsibility for the validity of all materials. Neither the authors nor the publishers, nor anyone else associated with the publication, shall be liable for any loss, damage or liability directly or indirectly caused or alleged to be caused by this book.
Neither this book nor any part may be reproduced or transmitted in any form or by any means, electronic or mechanical, including photocopying, microfilming and recording, or by any information storage or retrieval system, without permission in writing from the publishers.
The consent of Woodhead Publishing and CRC Press does not extend to copying for general distribution, for promotion, for creating new works, or for resale. Specific permis-sion must be obtained in writing from Woodhead Publishing or CRC Press for such copying. Trademark notice: Product or corporate names may be trademarks or registered trade-marks, and are used only for identification and explanation without intent to infringe. British Library Cataloguing in Publication Data
A catalogue record for this book is available from the British Library. Library of Congress Cataloging in Publication Data
A catalog record for this book is available from the Library of Congress. Woodhead Publishing ISBN 1 85573 722 1 (book) 1 85573 772 8 (e-book) CRC Press ISBN 0-8493-2534-X
CRC Press order number: WP2534
The publisher’s policy is to use permanent paper from mills that operate a sustainable forestry policy, and which have been manufactured from pulp which is processed using acid-free and elementary chlorine-free practices. Furthermore, the publisher ensures that the text paper and cover board used have met acceptable environmental standards. Typeset by Ann Buchan (Typesetters), Middx, England
Introduction . . . xi
1 E110: Sunset yellow. . . 1
1.1 Introduction . . . 1
1.2 Methods of analysis . . . 1
1.3 Recommendations . . . 2
1.4 References . . . 2
1.5 Appendix: method procedure summaries . . . 4
Table 1.1 Summary of methods for sunset yellow in foods . . . 6
Table 1.2 Summary of statistical parameters for sunset yellow in foods . . . 10
Table 1.3 Performance characteristics for sunset yellow in lemonade (pre-trial samples) . . . 14
Table 1.4 Performance characteristics for sunset yellow in bitter samples . . . 14
2 E122: Azorubine (carmoisine) . . . 15
2.1 Introduction . . . 15
2.2 Methods of analysis . . . 15
2.3 Recommendations . . . 16
2.4 References . . . 16
2.5 Appendix: method procedure summaries . . . 17
Table 2.1 Summary of methods for azorubine in foods . . . 19
Table 2.2 Summary of statistical parameters for azorubine in foods . . . 21
Table 2.3 Performance characteristics for azorubine in collaborative trial samples . . . 23
Table 2.4 Performance characteristics for azorubine in bitter samples . . . 23
3 E141: Copper complexes of chlorophylls and chlorophyllins. . . 24
3.1 Introduction . . . 24
3.2 Methods of analysis . . . 24
3.3 Recommendations . . . 25
3.4 References . . . 25
Table 3.1 Summary of methods for Cu complexes of chlorophylls and chlorophyllins in foods . . . 26
Table 3.2 Summary of statistical parameters for Cu complexes of chlorophylls and chlorophyllins in foods . . . 26
4 E150c: Caramel class III. . . 27
4.1 Introduction . . . 27
4.2 Methods of analysis . . . 27
4.3 Recommendations . . . 27
4.4 References . . . 28
Table 4.1 Summary of methods for caramel (class III) . . . 29
5 E160b: Annatto extracts . . . 30
5.1 Introduction . . . 30
5.2 Methods of analysis . . . 30
5.3 Recommendations . . . 31
5.4 References . . . 31
Table 5.1 Summary of methods for annatto extracts in foods . . 32
Table 5.2 Summary of statistical parameters for annatto extracts in foods . . . 34
6 E200–3: Sorbic acid and its salts. . . 35
6.1 Introduction . . . 35
6.2 Methods of analysis . . . 35
6.3 Recommendations . . . 36
6.4 References . . . 36
6.5 Appendix: method procedure summaries . . . 37
Table 6.1 Summary of methods for sorbic acid in foods . . . 42
Table 6.2 Summary of statistical parameters for sorbic acid in foods . . . 48
Table 6.3 Performance characteristics for sorbic acid in almond paste, fish homogenate and apple juice . . . 52
Table 6.4 Performance characteristics for sorbic acid in orange squash, cola drinks, beetroot, pie filling and salad cream . . . 53
7 E210–13: Benzoic acid . . . 54
7.1 Introduction . . . 54
Contents v
7.3 Recommendations . . . 55
7.4 References . . . 55
7.5 Appendix: method procedure summaries . . . 57
Table 7.1 Summary of methods for benzoic acid in foods . . . 62
Table 7.2 Summary of statistical parameters for benzoic acid in foods . . . 67
Table 7.3 Performance characteristics for benzoic acid in almond paste, fish homogenate and apple juice . . . 70
Table 7.4 Performance characteristics for benzoic acid in orange juice . . . 71
Table 7.5 Performance characteristics for benzoic acid in orange squash, cola drinks, beetroot and pie filling . . . 72
8 E220–8: Sulphites. . . 73
8.1 Introduction . . . 73
8.2 Methods of analysis . . . 73
8.3 Recommendations . . . 75
8.4 References . . . 76
8.5 Appendix: method procedure summaries . . . 77
Table 8.1 Summary of methods for sulphites in foods . . . 87
Table 8.2 Summary of statistical parameters for sulphites in foods . . . 90
Table 8.3 Performance characteristics for sulphites in hominy, fruit juice and seafood . . . 92
Table 8.4 Performance characteristics for sulphites in wine, dried apples, lemon juice, potato flakes, sultanas and beer . . . 92
Table 8.5 Performance characteristics for total sulphite in shrimp, orange juice, dried apricots, dehydrated potato flakes and peas . . 94
Table 8.6 Performance characteristics for total sulphite in starch, lemon juice, wine cooler, dehydrated seafood and instant mashed potatoes . . . 95
Table 8.7 Performance characteristics for total sulphite in shrimp, potatoes, pineapple and wine . . . 96
Table 8.8 Performance characteristics for free sulphite in wine . 97 9 E249–50: Nitrites . . . 98
9.1 Introduction . . . 98
9.2 Methods of analysis . . . 98
9.3 Recommendations . . . 100
9.4 References . . . 100
9.5 Appendix 1: method procedure summaries (meat – DD ENV 12014) . . . 101
Table 9.1 Summary of methods for nitrites in foods . . . 118
Table 9.2 Summary of statistical parameters for nitrites in foods . . . 122
Table 9.3 Performance characteristics for nitrite in meat products . . . 126
Table 9.4 Performance characteristics for nitrite in foods . . . . 127
10 E297: Fumaric acid and its salts. . . 128
10.1 Introduction . . . 128
10.2 Methods of analysis . . . 128
10.3 Recommendations . . . 129
10.4 References . . . 129
10.5 Appendix: method procedure summaries . . . 131
Table 10.1 Summary of methods for fumaric acid in foods . . . 132
Table 10.2 Summary of statistical parameters for fumaric acid in foods . . . 138
Table 10.3 Performance characteristics for fumaric acid in Table 10.4 Performance characteristics for fumaric acid in lager beers . . . 141
11 E310–12: Gallates. . . 142
11.1 Introduction . . . 142
11.2 Methods of analysis . . . 142
11.3 Recommendations . . . 142
11.4 References . . . 143
11.5 Appendix: method procedure summaries . . . 144
Table 11.1 Summary of methods for gallates in foods . . . 146
Table 11.2 Summary of statistical parameters for gallates in foods . . . 150
Table 11.3 Performance characteristics for gallates in oils, lard and butter oil . . . 152
12 E320: BHA. . . 153
12.1 Introduction . . . 153
12.2 Methods of analysis . . . 153
12.3 Recommendations . . . 154
12.4 References . . . 154
12.5 Appendix: method procedure summaries . . . 155
Table 12.1 Summary of methods for BHA in foods . . . 157
Table 12.2 Summary of statistical parameters for BHA in foods . . . 162
Contents vii
13 E334–7, E354: L-tartaric acid and its salts . . . 166
13.1 Introduction . . . 166
13.2 Methods of analysis . . . 166
13.3 Recommendations . . . 167
13.4 References . . . 167
13.5 Appendix: method procedure summaries . . . 167
Table 13.1 Summary of methods for L-tartaric acid in foods . . 169
Table 13.2 Summary of statistical parameters for L-tartaric acid in foods . . . 172
Table 13.3 Performance characteristics for L-tartaric acid in grape juices . . . 173
14 E355–7, E359: Adipic acid and its salts . . . 174
14.1 Introduction . . . 174
14.2 Methods of analysis . . . 174
14.3 Recommendations . . . 175
14.4 References . . . 175
14.5 Appendix 1: method procedure summaries (analysis of orange drinks) . . . 176
14.6 Appendix 2: method procedure summaries: analysis of starch . . . 177
Table 14.1 Summary of methods for adipic acid in foods . . . . 179
Table 14.2 Summary of statistical parameters for adipic acid in foods . . . 181
Table 14.3 Performance characteristics for adipic acid in orange drink samples . . . 182
Table 14.4 Performance characteristics for adipic acid in acetylated adipyl cross-linked starches . . . 182
15 E405, E477: Propylene glycol (propan-1,2-diol). . . 183
15.1 Introduction . . . 183
15.2 Methods of analysis . . . 183
15.3 Recommendations . . . 184
15.4 References . . . 184
Table 15.1 Summary of methods for propylene glycol in foods . . . 185
Table 15.2 Summary of statistical parameters for propylene glycol in foods . . . 186
16 E416: Karaya gum . . . 187
16.1 Introduction . . . 187
16.2 Methods of analysis . . . 187
16.3 Recommendations . . . 188
16.4 References . . . 188
17 E432–6: Polysorbates. . . 190
17.1 Introduction . . . 190
17.2 Methods of analysis . . . 190
17.3 Recommendations . . . 191
17.4 References . . . 191
Table 17.1 Summary of methods for polysorbates in foods . . . 192
Table 17.2 Summary of statistical parameters for polysorbates in foods . . . 194
18 E442: Ammonium phosphatides . . . 196
18.1 Introduction . . . 196
18.2 Methods of analysis . . . 197
18.3 Recommendations . . . 197
18.4 References . . . 197
Table 18.1 Summary of methods for phosphorus in foods . . . . 198
Table 18.2 Summary of statistical parameters for phosphorus in foods . . . 199
Table 18.3 Performance characteristics for total phosphorus in collaborative trial samples . . . 200
19 E444: Sucrose acetate isobutyrate. . . 201
19.1 Introduction . . . 201
19.2 Methods of analysis . . . 201
19.3 Recommendations . . . 201
19.4 References . . . 202
19.5 Appendix: method procedure summary . . . 202
Table 19.1 Summary of methods for sucrose acetate isobutyrate in foods . . . 204
Table 19.2 Summary of statistical parameters for sucrose acetate isobutyrate in foods . . . 204
20 E472e: Mono/diacetyl tartaric acid esters of mono/diglycerides of fatty acids. . . 205
20.1 Introduction . . . 205
20.2 Methods of analysis . . . 205
20.3 Recommendations . . . 206
20.4 References . . . 206
Table 20.1 Summary of methods for mono/diacetyl tartaric acid esters of mono/diglycerides of fatty acids in foods . . . 207
Contents ix
21 E476: Polyglycerol esters of polycondensed fatty acids of
castor oil . . . 209
21.1 Introduction . . . 209
21.2 Methods of analysis . . . 209
21.3 Recommendations . . . 209
21.4 References . . . 210
Table 21.1 Summary of methods for polyglycerol polyricinoleate in foods . . . 211
22 E481–2: Stearoyl lactylates . . . 212
22.1 Introduction . . . 212
22.2 Methods of analysis . . . 212
22.3 Recommendations . . . 213
22.4 References . . . 213
Table 22.1 Summary of methods for stearoyl lactylates in foods . . . 214
Table 22.2 Summary of statistical parameters for stearoyl lactylates in foods . . . 214
23 E483: Stearyl tartrate. . . 215
23.1 Introduction . . . 215
23.2 Methods of analysis . . . 215
23.3 Recommendations . . . 215
24 E491–2, E493–4, E495: Sorbitan esters . . . 216
24.1 Introduction . . . 216
24.2 Methods of analysis . . . 216
24.3 Recommendations . . . 216
24.4 References . . . 217
Table 24.1 Summary of methods for sorbitan esters in foods . 218 Table 24.2 Summary of statistical parameters for sorbitan esters in foods . . . 219
25 E520–3, E541, E554–9, E573: Aluminium. . . 220
25.1 Introduction . . . 220
25.2 Methods of analysis . . . 220
25.3 Recommendations . . . 221
25.4 References . . . 221
Table 25.1 Summary of methods for aluminium in foods . . . . 223
Table 25.2 Summary of statistical parameters for aluminium in foods . . . 226
Table 25.3 Performance characteristics for aluminium in milk powder . . . 228
26 E954: Saccharin. . . 230
26.1 Introduction . . . 230
26.2 Methods of analysis . . . 230
26.3 Recommendations . . . 231
26.4 References . . . 232
26.5 Appendix: method procedure summaries . . . 233
Table 26.1 Summary of methods for saccharin in foods . . . 241
Table 26.2 Summary of statistical parameters for saccharin in foods . . . 246
Table 26.3 Performance characteristics for saccharin in sweetener tablets . . . 248
Table 26.4 Performance characteristics for saccharin in liquid sweetener . . . 249
Table 26.5 Performance characteristics for sodium saccharin in marzipan, yogurt, orange juice, cream, cola and jam . . . 250
Table 26.6 Performance characteristics for sodium saccharin in juice, soft drink and sweets . . . 251
Table 26.7 Performance characteristics for sodium saccharin in juice, soft drink and dessert . . . 252
Introduction
Additives are added to food to perform different technological functions, for example, to increase shelf life (preservatives), or to protect against rancidity (antioxidants). The use of additives in food is controlled by separate legislation relating to, for example, colours in food, sweeteners, miscellaneous additives (other than colours and sweeteners) and flavourings. Most areas of food additives legislation (with the exception of additives in flavourings, additives in other additives (i.e. other than carriers/solvents) and controls on enzymes/processing aids) have been fully harmonised throughout the European Union for a number of years. The initial groundwork for this was laid down by the Food Additives Framework Directive (89/107/EEC). Indeed, UK legislation covering the main groups of food additives is based on European Community Directives, which were agreed during 1994 and 1995. Under these legislative requirements (including amendments), most additives are permitted only in certain specified foods, at specified maximum levels (although some are generally permitted at levels of ‘quantum satis’). However, only additives that have been approved for safety by the European Commission’s Scientific Committee on Food are included in the legislation and are identifiable by their designated E number in the relevant Directives.
information on additive levels and usage. This information is needed to monitor additive levels in foods, changes in dietary behaviour and patterns of additive use, and to fulfil European Community legislation requirements for Member States to monitor food intakes. A preliminary European Commission monitoring exercise carried out in the European Union has identified several additives or additive groups that require further review by Member States.*
To ensure consumer safety, existing intake estimations and safety monitoring of additives need refining, and information is required to compare actual levels of additive use and consumption with safety guidelines (acceptable daily intakes) set by the EU Scientific Committee on Food. To obtain this information, robust quantitative methods of analysis are required to measure levels of additives in a broad range of food matrices, as several additives or groups of additives with similar functions may coexist within a single food matrix. A variety of published analytical methods are available in the literature, particularly for artificial food colours, preservatives and sweeteners. However, the availability of reliable meth-odology for some of the more analytically complex additives, such as emulsifiers, natural colours and polysaccharide gums is limited by the inherent compositional complexity of these substances and the variability of food matrices in which they occur.
To meet this problem, a review of published analytical methods has been compiled which seeks to identify those additives for which methods are incom-plete, i.e. protocols which only cover a limited range of permitted foods, or are missing. For this exercise, selection of additives for review was based on additive use in foods (at permitted levels and quantum satis), availability of dietary intake information and analyte complexity (chemical form). Additives selected were those where more information is required in terms of additive level and usage to refine intake estimates. However, information is generally lacking for these additives because robust methods are not available for analysis due to the complex-ity of the additive/matrix. Therefore the law cannot be enforced.
The additives listed below have been identified as requiring more information in terms of their level and usage. The E number and name are given below:
E110 Sunset yellow
E122 Azorubine
E141 Copper complexes of chlorophylls and
chlorophyllins
E150c Caramel class III
E160b Annatto extracts
E200–3 Sorbic acid and its salts
E210–13 Benzoic acid
E220–8 Sulphites
E249–50 Nitrites
E297 Fumaric acid and its salts
*Council of the European Union, Report from the Commission on dietary food additive intake in the
Introduction xiii
E310–12 Gallates
E320 BHA
E334–7, E354 L-tartaric acid and its salts
E355–7, E359 Adipic acid and its salts
E405, E477 Propylene glycol
E416 Karaya gum
E432–6 Polysorbates
E442 Ammonium phosphatides
E444 Sucrose acetate isobutyrate
E472e Mono/diacetyl tartaric acid ester of mono/
diglycerides of fatty acids
E476 Polyglycerol esters of polycondensed fatty
acids of castor oil
E481–2 Stearoyl lactylates (including calcium and
sodium stearoyl lactylate)
E483 Stearyl tartrate
E491–2, E493–4 and E495 Sorbitan esters E520–3, E541, E554–9 and E573 Aluminium
E954 Saccharin
This review considers the published methodology available for the extraction and analysis of a specific additive or group of additives. The present status of the methodology is also assessed for each additive and information on the most widely used available methods for the determination of the additive in specified foods is detailed, including the performance characteristics where these are available. Some recommendations for future research to improve method availability are also given. For each of the additives an introduction, a summary of the available methods of analysis, any recommendations and appropriate references are given. There are also tables which summarise the available methods, the available statistical performance parameters for the methods and results of any collaborative trials that may have been carried out on the method. Provision of this information should help analysts estimate the concentration of any of the additives of interest in foods. Where ‘gaps’ in methodology have been identified, then these are mentioned in the recommendations and may lead to research being carried out to develop appropriate methods for these additives. It is becoming increasingly common for method criteria to be incorporated in legislation rather than particular methods of analysis being prescribed. This means that methods of analysis used for control purposes, or for due diligence purposes, should meet certain specified minimum analysis requirements. It will then become increasingly helpful to food analysts for information in this format to be made readily available.
1
E110: Sunset yellow
1.1
Introduction
The major food groups contributing to dietary intake of sunset yellow are confectionery, emulsified sauces, soft drinks and chocolate products; the maximum permitted level of 500 mg/kg is allowed in sauces, seasonings, pickles, relishes, chutney, piccalilli; decorations and coatings; salmon substitutes; surimi. The acceptable daily intake (ADI) for sunset yellow is 2.5 mg/kg body weight.
1.2
Methods of analysis
The general scheme for identifying coal-tar dyes present in foods normally involves:1
1 Preliminary treatment of the food.
2 Extraction and purification of the dye from the prepared solution or extract of the food.
3 Separation of mixed colours if more than one is present. 4 Identification of the separated dyes.
There are numerous methods published for the determination of sunset yellow in foodstuffs. The majority of these methods are for the determination of various water-soluble dyes, including sunset yellow, in foodstuffs. The early workers on the development of methods for food colours used paper chromatography and TLC but over the last 20 years HPLC,2–8 spectrophotometric,9–15,22 voltammetric20,21 and
more recently capillary zone electrophoresis16–19 methods have been developed
summarised in Table 1.2. The majority of published methods are for the determination of sunset yellow in liquid matrices i.e. drinks, therefore further development of extraction procedures is necessary to adapt methods for other food matrices i.e. chocolate products.
A suitable method for the analysis of sunset yellow in soft drinks was collaboratively trialled.2 The method consisted of a quantitative extraction, as ion
pairs with cetylpyridinium chloride, from aqueous solutions into n-butanol. The sunset yellow was analysed using reversed phase, ion pair gradient elution HPLC with diode array detection. A summary of the procedure for this method is given in the Appendix and the performance characteristics are given in Table 1.3.
A reverse phase HPLC method for the analysis of six dyes including sunset yellow was applied to a number of food samples (three beverages, gelatin dessert and a strawberry flavoured syrup) and found to be suitable.3 Separation was
performed on a Nova-Pak C18 column using methanol–NaH2PO4/Na2HPO4, pH 7, buffer solution (0.1 M) as mobile phase with an elution gradient system and UV– vis detection at 520 nm. Under optimum conditions (details given in the Appendix) dyes were eluted in 4 min. A summary of the procedure for this method is given in the Appendix and a summary of the statistical parameters in Table 1.4. This method has also been used to compare the results for the simultaneous determina-tion of dyes in foodstuffs when new methods have been developed i.e. by capillary zone electrophoresis.16
1.3
Recommendations
For sunset yellow analytical methods using extraction followed by spectoroscopy1
are in place for a full range of beverages, sauces, starchy and fatty foods. There are no recent publications for sunset yellow in chocolate products, therefore this is an area that requires method development.
1.4
References
1 Pearson’s Composition and Analysis of Foods, 9 ed. Kirk R and Sawyer R, Longman Scientific, Harlow, (1989).
2 ‘Determination of synthetic coal-tar dyes in soft drinks, skimmed milks and cakes: collaborative trial’, Dennis J, Chapman S, Brereton P, Turnbull J, Wood R. J. Assoc. Publ. Analysts (1997) 33,161–202.
3 ‘A reverse phase HPLC method to determine six food dyes using buffered mobile phase’, BerzasNevado J J, GuiberteauCabanillas C and ContentoSalcedo A M. Analytical Letters (1998) 31(14), 2513–2535.
4 ‘Simultaneous determination of preservatives, sweeteners and colourings in soft drinks
by ion-pair reversed phase HPLC’, Zhou S, Li J. Sepu (1990) 8(1), 54–56. [Chinese]
5 ‘Rapid determination of preservatives, sweeteners, food colourings and caffeine by
HPLC’, Ren Y, Gao Z, Huang B. Shipin Yu Fajiao Gongye (1990) 1, 72–75. [Chinese]
6 ‘Simultaneous determination of nine food additives in beverages by high-performance
liquid chromatography (HPLC)’, Wu F, Zhang P. Sepu (1992) 10(5), 311–312. [Chinese]
E110: Sunset yellow 3
chromatography’, Chen Q C, Mou S F, Hou X P, Riviello J M, Ni Z M. Journal of Chromatography A (1998) 827(1), 73–81.
8 ‘Separation and determination of dyes by ion-pair chromatography’, BerzasNevado J J, GuiberteauCabanillas C, ContentoSalcedo A M. Journal of Liquid Chromatography & Related Technologies (1997) 20(18), 3073–3088.
9 ‘A comparison of three spectrophotometric methods for simultaneous quantitation of mixtures E102 and E110 food additives’, GarciaPenalver L, SimalLorano J,
LopezHernandez J. Spectroscopy Europe (1999) 11(1), 8–12.
10 ‘Determination of colourant matters mixtures in foods by solid-phase spectrophotom-etry’, Capitan F, CapitanVallvey L F, Fernandez M D, deOrbe I, Avidad R. Analytica Chimica Acta (1996) 331(1), 141–148.
11 ‘Spectrophotometric determination of single synthetic food colour in soft drinks using ion-pair formation and extraction’, Lau O W, Poon M M K, Mok S C, Wong F M Y, Luk
S F. International Journal of Food Science and Technology (1995) 30(6), 793–798.
12 ‘Simultaneous determination of the colorants tartrazine, ponceau 4R and sunset yellow FCF in foodstuffs by solid phase spectrophotometry using partial least square multivariate calibration’, CapitanVallvey L F, Fernandez M D, deOrbe I, Avidad R. Talanta (1998)
47, 861–868.
13 ‘First-derivative spectrophotometric determination of Ponceau 4R, Sunset Yellow and tartrazine in confectionery products’, Sayar S, Ozdemir Y. Food Chemistry (1998)
61(3), 367–372.
14 ‘Simultaneous spectrophotometric determination of mixtures of food colorants’, Ni Y G,
Gong X F. Analytica Chimica Acta (1997) 354(1–3), 163–171.
15 ‘Resolution of ternary mixtures of Tartrazine, Sunset Yellow and Ponceau 4R by derivative spectrophotometric ratio spectrum-zero crossing methods in commercial foods’, BerzasNevado J J, RodriguezFlores J, GuiberteauCabanillas C, VillasenorLlerena
M J, ContentoSalcedo A M. Talanta (1998), 46(5), 933–942.
16 ‘Method development and validation for the simultaneous determination of dyes in food stuffs by capillary zone electrophoresis’, BerzasNevado J J, GuiberteauCabanillas C,
ContentoSalcedo A M. Analytica Chimica Acta (1999) 378(1–3), 63–71.
17 ‘Simultaneous determination of synthetic food colourings and preservatives in bever-ages by capillary zone electrophoresis’, Wang W, He J H, Xu Z, Chen H M. Fenxi Ceshi Xuebao (1998) 17(5), 72–75. [Chinese]
18 ‘High-performance capillary electrophoretic analysis of synthetic food colorants’, Kuo
K L, Huang H Y, Hsieh Y Z. Chromatographia (1998) 47(5/6), 249–256.
19 ‘Determination of synthetic colours in confectionery by micellar electrokinetic capillary chromatography’, Thompson C O, Trenerry V C. Journal of Chromatography A (1995)
704(1), 195–201.
20 ‘Simultaneous determination of Amaranth and Sunset Yellow by ratio derivative
voltammetry’, Ni Y, Bai J. Talanta (1997) 44, 105–109.
21 ‘Square wave adsorptive voltammetric determination of sunset yellow’, Nevado J J B,
Flore J R, Llerena M J V. Talanta (1997) 44, 467–474.
1.5
Appendix: method procedure summaries
Analysis of soft drinks2
Sample preparation
Accurately weigh 10 g of sample into a 25 mL beaker and adjust to pH 7.0 with 0.1 mol/L sodium hydroxide.
Extraction
Transfer neutralised sample to centrifuge tube. Rinse beaker and pH electrode with 2 × 5 mL portions of water and transfer washings to centrifuge tube. Add 5 mL 0.1 mol/L cetylpyridinium chloride in water, mix and add 10 mL of water-saturated n-butanol. Shake vigorously for 10 min on mechanical shaker. Centrifuge at 1000 g for 5 min and transfer upper organic layer to a 25 mL volumetric flask using a Pasteur pipette. Repeat the procedure with three 5 mL portions of water-saturated n-butanol.
Make the combined n-butanol extracts up to 25 mL with water-saturated
n-butanol. Accurately dilute an aliquot of the filtrate with an equal volume of mobile phase (1 L + 1 L dilution of mobile phase A and solution B). Mix and filter a portion through a filter.
Quantitative determination: HPLC
Load 20µL of sample extract onto column and use gradient (linear) elution to achieve optimum separation.
Column Spherisorb C8, 250 × 4.6 mm, 5µm
Guard column packed with 40µm reverse phase material (e.g. Perisorb RP8 30–40µm
Mobile phase 60 % Solution B and 40 % Solution A linear gradient to 80 % Solution B and 20 % Solution A after 20 min
Flow rate 1.5 mL/min
Detector 430 nm
Solution A Phosphate buffer and water are diluted 50 mL + 850 mL, and this solution is de-gassed. To the de-gassed solution, 50 mL of cetylpyridinium chloride solution is added and the final solution made to 1 L in a volumetric flask. The solution is de-gassed before the addition of cetylpyridinium chloride solution to avoid frothing.
E110: Sunset yellow 5
Analysis of beverages3
Sample preparation
The samples were prepared as follows:
1 Quantitative determination by direct preparation using calibration graphs: 5 mL of the sample was transferred to a 25 mL flask and diluted with deionised water to the mark.
2 Quantitative determination by standard addition: to 5 mL of the beverage sample were added different amounts (2, 4, 6, 8 mg/L) of the dye to determine and proceed as before.
Analysis of beverages
The samples were filtered through a Millipore filter before being injected into the chromatographic system and all the experiments were carried out in duplicate.
HPLC conditions
Column Nova-Pak C18
Mobile phase Eluent A Methanol
Eluent B NaH2PO4/Na2HPO4 buffer solution 0.1 M pH=7
Gradient profile t0(initial) 20 % eluent A, 80 % eluent B t1(2 min) 100 % eluent A
t2(4 min) 100 % eluent A
t0(5 min) 20 % eluent A, 80 % eluent B
Flow rate 2 mL/min
Injection volume 20µL
Analytical methods for food additives
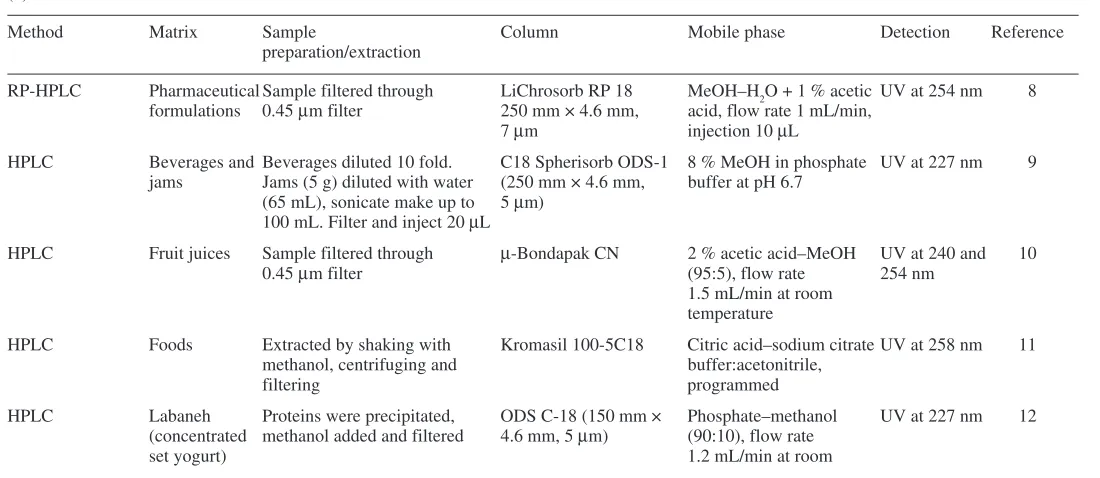
Table 1.1 Summary of methods for sunset yellow in foods (a)
Method Matrix Sample Column Mobile phase Detection Reference
preparation/extraction
IP-RP-HPLC Lemonade Ion pairs with cetylpyridinium Spherisorb C8 Gradient elution (1.5 mL/min) Diode-array 2
chloride from aqueous with phosphate buffer containing at 430 nm
solutions into n-butanol cetylpyridinium chloride,
acetonitrile and methanol
RP-HPLC Bitter Diluted with water and filtered Nova-Pak C18 Gradient elution (2 mL/min) 520 nm 3
using methanol and 0.1 M sodium phosphate buffer at pH 7
Ion-pair reversed- Fruit juice Neutralised with aq 50 % NH3 Zorbax ODS Gradient elution (1 mL/min) 254 nm 4
phase HPLC soy sauce and centrifuged MeOH–CH3CN–0.02
M-triammonium citrate (10:1:39), to methanol (1:1)
HPLC Beverages Altex Ultra- Gradient elution with 0.2 N 5
and foods sphere TM ODS ammonium acetate and 18 to
100 % methanol
HPLC Beverages Neutralised with aq NH3 and µBondapak C18 Gradient elution (2 mL/min) 230 nm 6
filtered with 20 mM ammonium acetate
aq and methanol
High-performance Drinks and Diluted with water and Dionex Ion Gradient elution (1.5 mL/min) 480 nm 7
ion instant filtered Pac AS11 with HCl:water:acetonitrile,
E110: Sunset yellow
7
(b)
Method Matrix Sample preparation Extraction Detection Reference
Ion-pair HPLC Beverages, Diluted with water and filtered Nova-Pak C18 column with gradient 520 nm 8
gelatine, syrups elution (1.5 mL/min) with
methanol-phosphate buffer of pH 7 containing 5 mM tetra-butylammonium bromide
Spectro- Commercially Diluted with water and Computer program that determines MULTv3.0 Quimio 9
photometry visible available dyes ultrasonicated concentration of mixtures of 4 program
compounds by comparing their spectra with standard spectra
Solid-phase Soft drinks, Filtered food samples were diluted The mixture was agitated with 50 mg 487 nm 10
spectrophotometry fruit liqueurs and to 100 mL with the addition of Sephadex DEAE A-25gel. The solid
ice-cream 5 mL 1 M acetate buffer at pH 5 phase was extracted and packed into
and 10 mL ethanol 1 mm cells for spectrophotometric
determination
Spectro- Soft drinks Ion-pair formation with octadecyl- Extraction of the ion-pair into 485 nm 11
photometric trimethylammonium bromide at n-butanol
pH 5.6
Solid-phase Soft drinks, Samples dissolved in water and The colourants were fixed in Sephadex Between 400 and 12
spectrophotometry sweets and fruit filtered DEAE A-25gel at pH 2.0 and packed 800 nm. Partial least
jellies into 1 mm cells for spectrophotometric squares (PLS)
determination multivariate calibration
Analytical methods for food additives Table 1.1 cont’d
(c)
Method Matrix Sample preparation Method conditions Detection Reference
First-derivative Confectionery Samples diluted 5–20 g in 100 mL 350–700 nm. First 13
spectrophotometry products water derivative spectrum
was obtained
Simultaneous Candy and Food samples were diluted to The colourants were isolated from the 300–700 nm in 5 nm 14
spectrophotometry carbonated drinks 25 mL with the addition of 5 mL food matrices by SPE using polyamide intervals. First and,
acetate buffer at pH 4.5 and water sorbent packed into 1 mm cells for second derivatives
spectrophotometric determination were analysed by
(PLS) multivariate calibration
Derivative Commercial This method is applied to samples No separation step is required. Method 15
spectrophotometric products containing 3 dyes to determine was used to determine synthetic
ratio spectrum-zero each dye under optimum conditions mixtures of these dyes in different ratios
crossing from 1:1:1 to 1:5:5 or even higher
Capillary zone Non-alcoholic Samples used as is or diluted with A background solution consisting of 216 nm 16
electrophoresis beverages and water 15 mM borate buffer at pH 10.5,
(CZE) fruit-flavoured hydrodynamic injection and a 20 kV
syrups separation voltage
CZE Beverages – Sample, either concentrated or Uncoated quartz column operated at 254 nm 17
strawberry and directly after filtration was applied separation voltage 28 kV with 10 mM
orange drinks for determination by CZE KH2PO4/Na2B4O7/3 % ethanol at pH 11
E110: Sunset yellow
9
High-performance Ice-cream bars Direct injection of liquids pH 9.5 borax–NaOH buffer containing Diode-array 18
capillary electro- and fruit soda 5 mM β-cyclodextrin
phoretic (HPCE) drinks
Micellar electro- Cordials and 5 g sample was extracted with Fused-silica capillary column operated 214 nm 19
kinetic capillary confectionery 25 mL water–methanol (4:1). 1 mL at 30 kV with a buffer of 0.05 M sodium
chromatography 0.05 M tetrabutylammonium deoxycholate in 5 mM NaH2PO4/5 mM
(MECC) phosphate was added and extracted sodium borate at pH 8.6/acetonitrile
by adsorption onto C18 Sep-Pak (17:3)
cartridge and elution with methanol
Ratio derivative Soft drinks Samples were dissolved in water, Measurements were carried out directly 20
voltammetry warmed to dissolve completely using an HMDE (hanging mercury
and filtered dropping electrode)
Square wave Refreshing drinks Samples were diluted with water Measurements were made directly. 21
adsorptive Sunset yellow in 0.5 M NH4Cl/NH3
voltammetry buffer solution gave an adsorptive
stripping voltammetric peak at the hanging mercury drop electrode at: –0.60V using an accumulation potential of –0.40V
Integrated solid Drinks Samples (3 mL) into a 10 mL When the flow cell contains C18 silica 22
phase spectro- volumetric flask made up to the sunset yellow is transported across
photometric-FIA volume with carrier solution and the filled cell measuring the absorbance
analysed by the flow procedure at increase at 487 nm
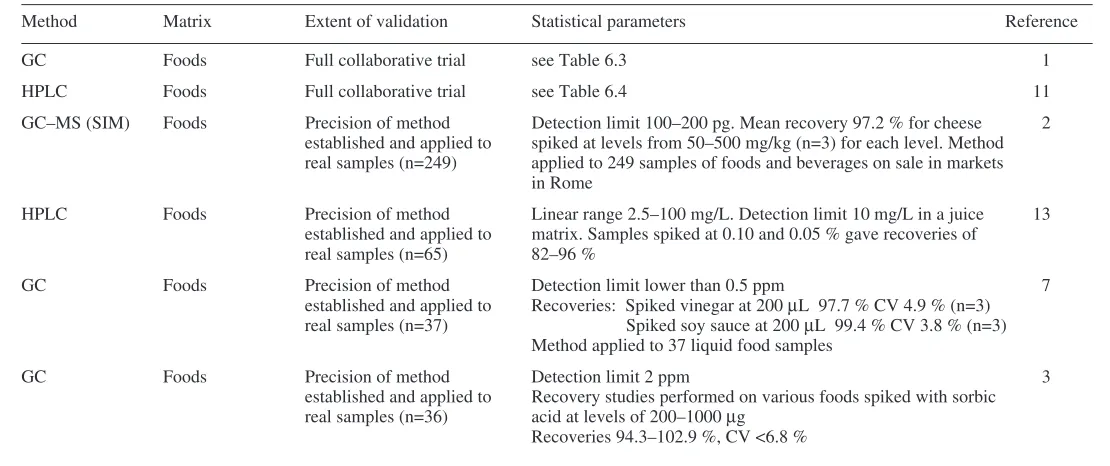
Analytical methods for food additives
Method Matrix Extent of validation Statistical parameters Reference
IP-RP-HPLC Lemonade Full collaborative trial see Table 1.3 2
RP-HPLC Bitter Performance of method Linear range of calibration 2–10 mg/L Determination limit 4 ng 3
established with standards Recoveries 88.1–106.0 % CV 3.5 %
(n=9) and validated with Bitter sample (n=9) see Table 1.4
real samples
SP spectro- Soft drinks, Performance of method Linear range 50–650 ng/mL SD 5.5267 RSD 6.07 % square of correlation 12
photometry sweets, fruit established and applied coefficient 0.9977
jellies to 7 real samples (n=5) RSD 1.8–7.6 % for commercial samples
Orange drinks: 3.68 mg/L RSD 3.5 % (n=5)
Pineapple jelly: 3.68 mg/L RSD 3.5 % (n=5)
Orange drink: 3.20 mg/L RSD 4.7 % (n=5)
Honey sweet: 0.19 mg/L RSD 1.8 % (n=5)
Colourant: 845.0 mg/L RSD 2.5 % (n=5)
Fruit jelly: 0.66 mg/L RSD 7.6 % (n=5)
Melon drink: 23.60 mg/L RSD 6.3 % (n=5)
IP-HPLC Commercial Performance of method Calibration graph linear from 2–10 mg/L SD 0.071 mg/L 8
products established with standards RSD 4.22 % Detection limit 1.4 ng Recovery 99.1 % (n=5)
(n=9) and validated with Real samples: Bitter: 16.7±0.3 mg/L
commercial food products Grenadine: 29.5±0.3 mg/L
Gelatine: 160.0±0.4 mg/kg
HPIC Drinks Performance of method Linear range 2.0–40µg/mL Recoveries of spiked samples
established and validated 94.7–109 % (n=4) RSD 2.01 % at 20µg/mL (n=7)
with 3 real samples Detection limit 2.0µg/mL
Real samples: 42.5±1.0µg/mL, 7
67.0±1.4µg/mL,
E110: Sunset yellow
11
Square wave Refreshing Performance of method Calibration graph linear in the range 5–90µg/L 21
adsorptive drinks established and applied to RSD = 2.2 % for a solution of 30µg/L (n=10) in the same day.
voltammetry 3 real samples (n=5) The determination limit was 5µg/L
Tof (lemon) 192±4µg/L (n=5)
Gatorade (lemon) 5790±116µg/L (n=5)
Refreshing drink (orange) 2142±42µg/L (n=5)
CZE cf Non-alcoholic Performance of method Calibration graph linear up to 4–200 mg/L Detection limit 0.38 mg/L 16
HPLC3 beverages and established and applied Recoveries were 92.3–111.3 % for 4–60 mg/L dyes from synthetic mixtures
flavoured to real samples Real samples: Ice lolly: 11.0±0.2 mg/L by
syrups CZE (n=3)
10.7±0.2 mg/L by
HPLC (n=3)
Spectro- Soft drinks Performance of method Linear range 0–60µg/mL Recovery 99 % (n=6) 11
photometric established and applied to RSD 1.9 % for 8µg/mL (n=10)
real samples Sparkling orange drink: 9.32µg/mL (n=3) {9.6} RSD 0.1 %
Results agree with manufacturers’ values {}
Integrated Drinks Performance of method Concentration range 0.5–20 mg/L Detection limit 0.2 mg/L 22
solid phase established and applied to RSD = 1.6 %
spectrophoto- a real sample Mango liqueur 39.44±1.334µg/L (n=3)
metric-FIA Results for sample compare with HPLC data for this sample
Derivative Commercial Performance of method Calibration graph linear up to 40 mg/L SD 0.8 % at 8 mg/L 15
spectrophoto- products established and applied Recovery 94–105 %
metric ratio to real samples Results for samples compare with HPLC data for these samples
spectrum-zero crossing
SP spectro- Soft drinks, Performance of method Linear range 15–500 ng/mL Detection limit 3.5 ng/mL 10
photometry liqueurs, established and applied RSD 2.8 % for 150 ng/mL
Analytical methods for food additives
Table 1.2 cont’d
Method Matrix Extent of validation Statistical parameters Reference
Spectro- Commercial Performance of method Recovery 93.81–106.1 % SD 4.03 mg/L 9
photometric dyes established on standards RSD 4.0 % for 100 mg/L
CZE Beverages Performance of method Calibration graph linear Recoveries 95–103 % 17
established and applied RSD 2.2–5.8 %
to a soft drink sample
First derivative Confectionery Method applied to 2 real Recovery 92.1–107.9 % 13
spectro- products samples (n=5) Real samples: Sugar candy: 122.0±1.8µg/g (n=5)
photometry Jelly: 3.2±0.2µg/g (n=5)
Ratio Soft drinks Method applied to 3 Calibration graph linear (r = 0.9997) Recoveries 88–110 %
derivative commercial products Orange juice 32.4µg/mL SD = 0.8 (n=3) 20
voltammetry (n=3) Fruit juice 8.9µg/mL SD = 0.5 (n=3)
Merida orangeade 49.9µg/mL SD = 1.5 (n=3)
Simultaneous Candy and Method applied to 2 real Real samples: Soft drink: 13.71 mg/L (n=3) {14.00} 14
spectro- carbonated samples (n=3) Candy: 8.45 mg/kg (n=3) {8.51}
E110: Sunset yellow
13
HPCE Ice-cream bars Method applied to a real Calibration graph linear RSD of migration time 0.49 % (n=7) 18
and soda sample (n=3) Commercial soda drink: 9.34µg/mL RSD 3.81 % (n=3)
drinks
MECC Cordials and Method applied to Calibration graph linear up to 100µg/mL RSD 1.9–4.3 % 19
confectionery commercial products Reporting limit 5 mg/kg
Results for samples compare with HPLC data for these samples
IP-RP-HPLC Fruit juice, Method applied to soy Recoveries 91–113 % CV 0.4–3.7 % 4
soy sauce sauce
HPLC Beverages Method applied to Recoveries 96.7–101 % 5
and foods commercial products
HPLC Beverages Method applied to Recoveries 92–108 % CV 0.4–4.0 % 6
Table 1.3 Performance characteristics for sunset yellow in lemonade (pre-trial
samples)2
Sample Lemonade
Analyte Sunset yellow
No. of laboratories 10
Units mg/kg
Mean value 23.9 34.4
Sr 1.67
RSDr 5.7 %
r 4.69
SR 3.57
RSDR 12.2 %
R 10.0
HoR 1.3
Key
Mean The observed mean. The mean obtained from the collaborative trial data.
r Repeatability (within laboratory variation). The value below which the absolute difference between two single test results obtained with the same method on identical test material under the same conditions may be expected to lie with 95 % probability.
Sr The standard deviation of the repeatability.
RSDr The relative standard deviation of the repeatability (Sr × 100/mean).
R Reproducibility (between-lab variation). The value below which the absolute difference between two single test results obtained with the same method on the identical test material under different conditions may be expected to lie with 95 % probability.
SR The standard deviation of the reproducibility.
RSDR The relative standard deviation of the reproducibility (SR × 100/mean).
HoR The HORRAT value for the reproducibility is the observed RSDR value divided by the RSDR
value calculated from the Horwitz equation.
Table 1.4 Performance characteristics for sunset yellow in bitter samples3
Sample Bitter kalty
Analyte Sunset yellow
Quantification method Direct measurement Standard addition
Number of determinations 2 2
Units mg/L mg/L
Mean value 7.8±0.2 7.3±0.3
Statistical parameters for assay
Number of determinations 9
Calculated by Peak height Peak area
Units mg/L
SD 0.056 0.046
RSD ±3.72 ±2.85
2
E122: Azorubine (carmoisine)
2.1
Introduction
The major food groups contributing to dietary intake of azorubine are chocolate products, confectionery, emulsified sauces and soft drinks with the maximum permitted level of 500 mg/kg being allowed in the same matrices as for sunset yellow i.e. sauces, seasonings, pickles, relishes, chutney and piccalilli; decorations and coatings; salmon substitutes; surimi. The ADI for azorubine is 4 mg/kg body weight/day.
2.2
Methods of analysis
Azorubine is also a coal-tar dye and the general scheme for identifying these dyes present in foods is the same as for sunset yellow.1
There are many methods published for the determination of azorubine in foodstuffs. The majority of these are for the determination of various water-soluble dyes, including azorubine, in foodstuffs and some of these methods are the same as for sunset yellow. The early workers on the development of methods for food colours used paper chromatography and TLC but over the last 20 years HPLC,2–4,6,7
spectrophotometric8–11 and more recently capillary zone electrophoresis5 methods
have been developed and a summary of these is given in Table 2.1, together with the matrices to which they apply. If statistical parameters for these methods were available these have been summarised in Table 2.2. The majority of published methods are for the determination of azorubine in liquid matrices i.e. drinks, therefore further development of extraction procedures would be necessary to adapt methods for other food matrices i.e. chocolate products.
A suitable method for the analysis of azorubine in soft drinks and flour-based products was collaboratively trialled.2
. The method consisted of a quantitative
n-butanol. The azorubine was analysed using reversed phase, ion pair gradient elution HPLC with diode array detection. A summary of the procedure for this method is given in the Appendix for this chapter and the performance characteristics are given in Table 2.3. The method was also used for skimmed milk using the sample preparation and extraction procedure as for soft drinks. If the extraction procedure had been followed for flour-based products the performance characteristics would probably have been improved.
A reverse phase HPLC method for the analysis of six dyes including azorubine (carmoisine) was applied to a number of food samples (three beverages, gelatin dessert and a strawberry-flavoured syrup and found to be suitable.3 Separation was
performed on a Nova-Pak C18 column using methanol–NaH2PO4/Na2HPO4, pH 7, buffer solution (0.1 M) as mobile phase with an elution gradient system and UV– vis detection at 520 nm. Under optimum conditions (details given in the Appendix) dyes were eluted in 4 min. The procedure for this method is given in the Appendix with a summary of the statistical parameters being given in Table 2.4. This method has also been used to compare the results for the simultaneous determination of dyes in foodstuffs when new methods have been developed i.e. by capillary zone electrophoresis.5
2.3
Recommendations
For azorubine, analytical methods using extraction followed by spectoroscopy1 are
in place for a full range of beverages, sauces and starchy and fatty foods. There are no recent publications for azorubine in chocolate products, therefore this is an area that requires method development.
2.4
References
1 Pearson’s Composition and Analysis of Foods, 9 ed. Kirk R and Sawyer R, Longman Scientific, Harlow (1989).
2 ‘Determination of synthetic coal-tar dyes in soft drinks, skimmed milks and cakes: collaborative trial’, Dennis J, Chapman S, Brereton P, Turnbull J, Wood R. J. Assoc. Publ. Analysts (1997) 33, 161–202.
3 ‘A reverse phase HPLC method to determine six food dyes using buffered mobile phase’, BerzasNevado J J, GuiberteauCabanillas C, ContentoSalcedo A M. Analytical Letters
(1998) 31(14), 2513–2535.
4 ‘Separation and determination of dyes by ion-pair chromatography’, BerzasNevado J J, GuiberteauCabanillas C, ContentoSalcedo A M. Journal of Liquid Chromatography & Related Technologies (1997) 20(18), 3073–3088.
5 ‘Method development and validation for the simultaneous determination of dyes in food stuffs by capillary zone electrophoresis’, BerzasNevado J J, GuiberteauCabanillas C,
ContentoSalcedo A M. Analytica Chimica Acta (1999) 378(1–3), 63–71.
6 ‘Extraction of organic acids by ion-pair formation with tri-n-octylamine. VII. Compari-son of methods for extraction of synthetic dyes from yogurt’, Puttermans M L, DeVoogt
E122: Azorubine 17
7 ‘Identification and determination of red dyes in confectionery by ion-interaction high-performance liquid chromatography’, Gennaro M C, Gioannini E, Angelino S, Aigotti
R, Giacosa D. Journal of Chromatography A (1997) 767(1–2), 87–92.
8 ‘Spectrophotometric resolution of ternary mixtures of Amaranth, Carmoisine and Ponceau 4R by derivative ratio spectrum-zero crossing method’, BerzasNevado J J, GuiberteauCabanillas C, ContentoSalcedo A. M. Fresenius’ Journal of Analytical Chemistry (1994) 350(10–11), 606–609.
9 ‘Determination of Carmoisine and its unsulfonated product in mixtures by solid-phase spectrophotometry’, CapitanVallvey L F, FernandezRamos M D, deOrbePaya I,
AvidadCastenada R. Quimica Analitica (Barcelona) (1998) 17(1), 29–34.
10 ‘AOAC Official Method 988.13. FD&C Color additives in foods, rapid cleanup for spectrophotometric and thin-layer chromatographic identification’, AOAC Official Method of Analysis (2000) 46.1.05 p 3.
11 ‘Spectrophotometric determination of single synthetic food colour in soft drinks using ion-pair formation and extraction’, Lau O W, Poon M M K, Mok S C, Wong F M Y, Luk
S F. International Journal of Food Science and Technology (1995) 30(6), 793–798.
2.5
Appendix: method procedure summaries
For the analysis of soft drinks the method is the same as for sunset yellow but sample preparation and extraction are modified for flour-based products.
Analysis of flour-based products2
Sample preparation
Accurately weigh 5 g of sample into a 50 mL beaker. De-fat the sample by stirring and decanting with 3 × 50 mL portions of petroleum spirit 40–60 at a temperature no greater than 40 ºC. Discard petroleum spirit and air-dry the sample at ambient temperature under a fume hood with occasional stirring.
Extraction
Transfer the air-dried de-fatted sample to centrifuge tube. Add 10 mL 0.05 mol/L phosphate buffer pH 7.0. Add 100 mg α-amylase and incubate at 40 ºC for 2 h in a shaking water bath or by regular manual shaking. Add 5 mL 0.1 mol/L cetylpy-ridinium chloride in water, mix and add 10 mL of water-saturated n-butanol. Shake vigorously for 10 min on mechanical shaker. Centrifuge at 1000 g for 10 min. If a gel forms in the upper organic layer, add 2 mL water-saturated
Quantitative determination: HPLC
Load 20µL of sample extract onto column and use gradient (linear) elution to achieve optimum separation. The same HPLC conditions were used as for sunset yellow in soft drinks but the detector was set at 520 nm for azorubine.
Analysis of beverages3
E122: Azorubine
[image:35.663.68.615.82.380.2]19
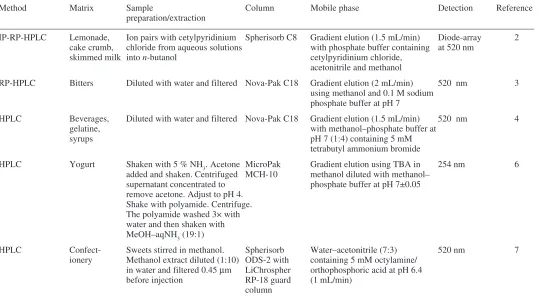
Table 2.1 Summary of methods for azorubine in foods (a)
Method Matrix Sample Column Mobile phase Detection Reference
preparation/extraction
IP-RP-HPLC Lemonade, Ion pairs with cetylpyridinium Spherisorb C8 Gradient elution (1.5 mL/min) Diode-array 2
cake crumb, chloride from aqueous solutions with phosphate buffer containing at 520 nm
skimmed milk into n-butanol cetylpyridinium chloride,
acetonitrile and methanol
RP-HPLC Bitters Diluted with water and filtered Nova-Pak C18 Gradient elution (2 mL/min) 520 nm 3
using methanol and 0.1 M sodium phosphate buffer at pH 7
HPLC Beverages, Diluted with water and filtered Nova-Pak C18 Gradient elution (1.5 mL/min) 520 nm 4
gelatine, with methanol–phosphate buffer at
syrups pH 7 (1:4) containing 5 mM
tetrabutyl ammonium bromide
HPLC Yogurt Shaken with 5 % NH3. Acetone MicroPak Gradient elution using TBA in 254 nm 6
added and shaken. Centrifuged MCH-10 methanol diluted with methanol–
supernatant concentrated to phosphate buffer at pH 7±0.05
remove acetone. Adjust to pH 4. Shake with polyamide. Centrifuge. The polyamide washed 3× with water and then shaken with
MeOH–aqNH3 (19:1)
HPLC Confect- Sweets stirred in methanol. Spherisorb Water–acetonitrile (7:3) 520 nm 7
ionery Methanol extract diluted (1:10) ODS-2 with containing 5 mM octylamine/
in water and filtered 0.45µm LiChrospher orthophosphoric acid at pH 6.4
before injection RP-18 guard (1 mL/min)
Analytical methods for food additives Table 2.1 cont’d
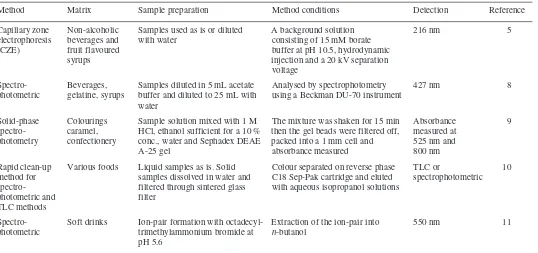
(b)
Method Matrix Sample preparation Method conditions Detection Reference
Capillary zone Non-alcoholic Samples used as is or diluted A background solution 216 nm 5
electrophoresis beverages and with water consisting of 15 mM borate
(CZE) fruit flavoured buffer at pH 10.5, hydrodynamic
syrups injection and a 20 kV separation
voltage
Spectro- Beverages, Samples diluted in 5 mL acetate Analysed by spectrophotometry 427 nm 8
photometric gelatine, syrups buffer and diluted to 25 mL with using a Beckman DU-70 instrument
water
Solid-phase Colourings Sample solution mixed with 1 M The mixture was shaken for 15 min Absorbance 9
spectro- caramel, HCl, ethanol sufficient for a 10 % then the gel beads were filtered off, measured at
photometry confectionery conc., water and Sephadex DEAE packed into a 1 mm cell and 525 nm and
A-25 gel absorbance measured 800 nm
Rapid clean-up Various foods Liquid samples as is. Solid Colour separated on reverse phase TLC or 10
method for samples dissolved in water and C18 Sep-Pak cartridge and eluted spectrophotometric
spectro- filtered through sintered glass with aqueous isopropanol solutions
photometric and filter
TLC methods
Spectro- Soft drinks Ion-pair formation with octadecyl- Extraction of the ion-pair into 550 nm 11
photometric trimethylammonium bromide at n-butanol
E122: Azorubine
[image:37.663.68.622.113.340.2]21
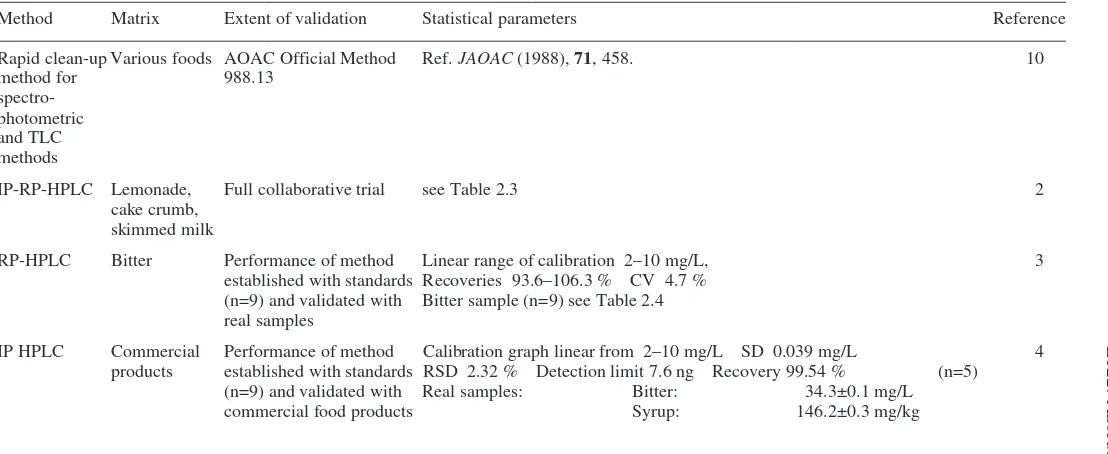
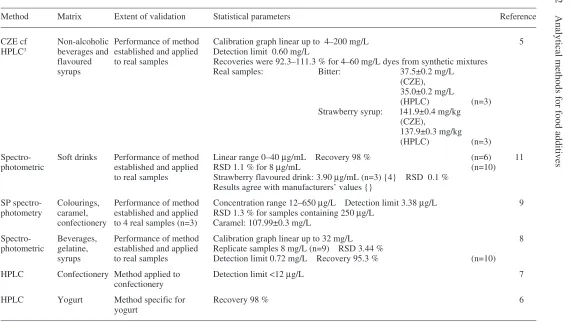
Table 2.2 Summary of statistical parameters for azorubine in foods
Method Matrix Extent of validation Statistical parameters Reference
Rapid clean-up Various foods AOAC Official Method Ref. JAOAC (1988), 71, 458. 10
method for 988.13
spectro-photometric and TLC methods
IP-RP-HPLC Lemonade, Full collaborative trial see Table 2.3 2
cake crumb, skimmed milk
RP-HPLC Bitter Performance of method Linear range of calibration 2–10 mg/L, 3
established with standards Recoveries 93.6–106.3 % CV 4.7 %
(n=9) and validated with Bitter sample (n=9) see Table 2.4
real samples
IP HPLC Commercial Performance of method Calibration graph linear from 2–10 mg/L SD 0.039 mg/L 4
products established with standards RSD 2.32 % Detection limit 7.6 ng Recovery 99.54 % (n=5)
(n=9) and validated with Real samples: Bitter: 34.3±0.1 mg/L
Analytical methods for food additives
Method Matrix Extent of validation Statistical parameters Reference
CZE cf Non-alcoholic Performance of method Calibration graph linear up to 4–200 mg/L 5
HPLC3 beverages and established and applied Detection limit 0.60 mg/L
flavoured to real samples Recoveries were 92.3–111.3 % for 4–60 mg/L dyes from synthetic mixtures
syrups Real samples: Bitter: 37.5±0.2 mg/L
(CZE), 35.0±0.2 mg/L
(HPLC) (n=3)
Strawberry syrup: 141.9±0.4 mg/kg (CZE),
137.9±0.3 mg/kg
(HPLC) (n=3)
Spectro- Soft drinks Performance of method Linear range 0–40µg/mL Recovery 98 % (n=6) 11
photometric established and applied RSD 1.1 % for 8µg/mL (n=10)
to real samples Strawberry flavoured drink: 3.90µg/mL (n=3) {4} RSD 0.1 %
Results agree with manufacturers’ values {}
SP spectro- Colourings, Performance of method Concentration range 12–650µg/L Detection limit 3.38µg/L 9
photometry caramel, established and applied RSD 1.3 % for samples containing 250µg/L
confectionery to 4 real samples (n=3) Caramel: 107.99±0.3 mg/L
Spectro- Beverages, Performance of method Calibration graph linear up to 32 mg/L 8
photometric gelatine, established and applied Replicate samples 8 mg/L (n=9) RSD 3.44 %
syrups to real samples Detection limit 0.72 mg/L Recovery 95.3 % (n=10)
HPLC Confectionery Method applied to Detection limit <12µg/L 7
confectionery
HPLC Yogurt Method specific for Recovery 98 % 6
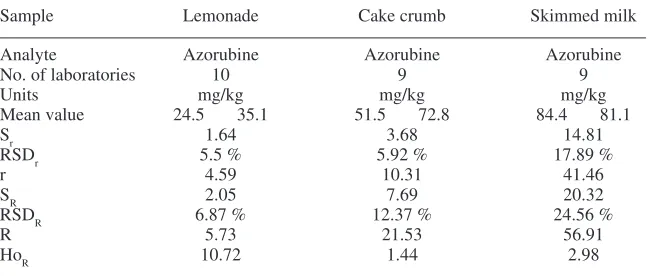
[image:38.663.66.637.72.394.2]E122: Azorubine 23
Table 2.3 Performance characteristics for azorubine in collaborative trial samples2
Sample Lemonade Cake crumb Skimmed milk
Analyte Azorubine Azorubine Azorubine
No. of laboratories 10 9 9
Units mg/kg mg/kg mg/kg
Mean value 24.5 35.1 51.5 72.8 84.4 81.1
Sr 1.64 3.68 14.81
RSDr 5.5 % 5.92 % 17.89 %
r 4.59 10.31 41.46
SR 2.05 7.69 20.32
RSDR 6.87 % 12.37 % 24.56 %
R 5.73 21.53 56.91
HoR 10.72 1.44 2.98
Key
Mean The observed mean. The mean obtained from the collaborative trial data.
r Repeatability (within laboratory variation). The value below which the absolute difference between two single test results obtained with the same method on identical test material under the same conditions may be expected to lie with 95 % probability.
Sr The standard deviation of the repeatability.
RSDr The relative standard deviation of the repeatability (Sr × 100/Mean).
R Reproducibility (between-lab variation). The value below which the absolute difference between two single test results obtained with the same method on the identical test material under different conditions may be expected to lie with 95 % probability.
SR The standard deviation of the reproducibility.
RSDR The relative standard deviation of the reproducibility (SR × 100/mean).
HoR The HORRAT value for the reproducibility is the observed RSDR value divided by the RSDR
[image:39.442.54.379.76.214.2]value calculated from the Horwitz equation.
Table 2.4 Performance characteristics for azorubine in bitter samples3
Sample Bitter kas Bitter kalty
Analyte Azorubine Azorubine
Quantification method Direct Standard Direct Standard
measurement addition measurement addition
Number of
determinations 2 2 2 2
Units mg/L mg/L
Mean value 33.3±0.1 32.8±0.2 18.5±0.1 17.5±0.3
Statistical parameters for assay Number of
determinations 9
Calculated by Peak height Peak area
Units mg/L
SD 0.041 0.040
RSD ±2.40 ±2.44
E141: Copper complexes of chlorophylls
and chlorophyllins
3.1
Introduction
The major food groups contributing to dietary intake of copper complexes of chlorophylls and chlorophyllins are sugar confectionery, desserts, sauces and condiments, cheese and soups and soft drinks. The ADI for copper complexes of chlorophylls and chlorophyllins is 15 mg/kg body weight/day.
Sodium copper chlorophyllin (Cu-Chl-Na) is not a single substance but a mixture mainly consisting of copper chlorin e6 and copper chlorin e4. Copper chlorin e6 is less stable and in some cases disappears as a result of pH and heat treatment during the manufacturing process of foods, whereas copper chlorin e4 is relatively stable under these conditions and can be used as an indicator substance for the analysis of Cu-Chl-Na.1
3.2
Methods of analysis
The only references that could be found for copper complexes of chlorophylls and chlorophyllins were in Japanese1, 2 and both are HPLC methods. A summary of
E141: Copper complexes of chlorophylls and chlorophyllins 25
3.3
Recommendations
There are no recent methods published for copper complexes of chlorophylls and chlorophyllins in foods; therefore these need to be developed and validated by collaborative trial.
3.4
References
1 ‘Investigation to find an indicator substance for the analysis of sodium copper chlorophyllin
in foods’, Yasuda K, Tadano K, Ushiyama H, Ogawa H, Kawai Y, Nishima T. Journal of the Food Hygienic Society of Japan (1995) 36(6), 710–716. [Japanese]
2 ‘Determination of sodium copper chlorophyllin in foods’, Amakawa E, Ogiwara T,
Analytical methods for food additives
Method Matrix Sample preparation/extraction Method conditions Detection Reference
HPLC Boiled bracken, agar-agar, Sample homogenised after pH adjustment Inertsil ODS-2 column with Photodiode array 1
chewing gum to 3–4 with 0.1 M HCl and extracted with MeOH–H2O (97:3) mobile at 405 nm
ethyl ether, concentrated to dryness. phase containing 1 % acetic
Residue dissolved in MeOH acid
HPLC Chewing gum, candies, Sample was suspended in citrate buffer Chemcosorb 5-ODS-UH Photodiode array at 2
processed seaweeds, (pH 2.6), homogenised after adding ethyl column with MeOH–H2O– 625 nm
processed edible wild plants, acetate–acetone (5:1). Extracted with 1 % acetic acid (100:2:0.5) mobile
chocolate aq ammonia solution. Ethanol added to phase
aqueous layer
Table 3.2 Summary of statistical parameters for Cu complexes of chlorophylls and chlorophyllins in foods
Method Matrix Extent of validation Statistical parameters Reference
HPLC Chewing gum, candies, processed Requires further validation Determination limit 5 ng/g 2
seaweeds, processed edible wild Recoveries in spiked food samples
plants, chocolate 90.7–102.5 %
4
E150c: Caramel class III
4.1
Introduction
The major food groups containing caramel (Class III) are sauces and condiments, soft and carbonated drinks, pies and pastries, desserts, soup and cakes. The ADI for ammonia caramel is 200 mg/kg body weight/day. There are four classes of caramel colours used as food additives and they are defined by the reactant added to the carbohydrate during production. The reactant used in the production of Class III caramels is ammonia and so the product is sometimes called ammonia caramel.1
4.2
Methods of analysis
No references could be found for the analysis of caramel colour (Class III) in foods. The only reference that could be found was for the analysis of caramel colour (Class III) in general. This was an ion-pair HPLC and capillary electrophoresis method, developed to distinguish Class III caramels from Classes I and IV.1 A
summary of this method is given in Table 4.1.
4.3
Recommendations
This method produced a fingerprint peak that was present in only Class III samples and the observation of this fingerprint peak in foods could be used to indicate the presence of Class III caramel and permit a semi-quantitative estimation of the level of caramel in the foods. Therefore this method1 needs to be further developed and
4.4
References
1 ‘Analysis for caramel colour (Class III)’, Coffey J S, Castle L. Food Chemistry (1994)
E150c: Caramel class III
29
Table 4.1 Summary of methods for caramel (class III)
Method Matrix Sample preparation/extraction Method conditions Detection Reference
IP-HPLC Caramels Sample dissolved in distilled water used HPLC: ODS-2 column with Photodiode 1
followed as is for HPLC method. gradient of 5 mM pentane- array at
by CE For CE filtered through 2 µm syringe sulphonic acid in MeOH–H2O 275 nm
filter before analysis. (5:95) [A] and MeOH [B]
mobile phases at 1 mL/min,
20µL injection
E160b: Annatto extracts
5.1
Introduction
The major food groups contributing to dietary intake of annatto extracts are such items as various cheeses, and snacks. The maximum permitted level of 50 mg/kg is allowed in Red Leicester cheese, 10–25 mg/kg in snacks and 10 mg/kg in liqueurs. The acceptable daily intake (ADI) for annatto extracts (as bixin) is 0.065 mg/kg body weight.
5.2
Methods of analysis
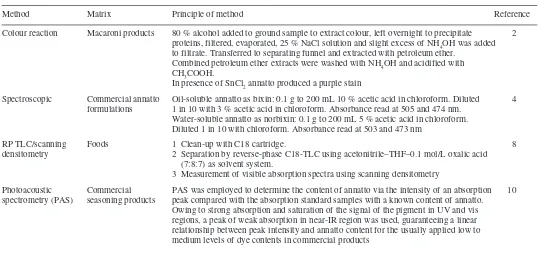
Annatto is a natural food colour and can be identified by characteristic colour reactions. In ‘flavoured’ milk it can be detected by pouring a few millilitres of milk into a flat dish, adding sodium bicarbonate solution and then inserting a strip of filter paper. After a few hours the paper is stained brown in the presence of annatto and turns pink on the addition of a drop of stannous chloride solution. In butter, annatto can be detected by the following method: divide an ethereal solution of isolated butterfat into two tubes. To one tube (A) is added 1–2 mL hydrochloric acid (1+1) and to (B) 1–2 mL 10 % sodium hydroxide solution. If annatto or other vegetable colour is present there is no colour in A, but a yellow colour appear in B.1
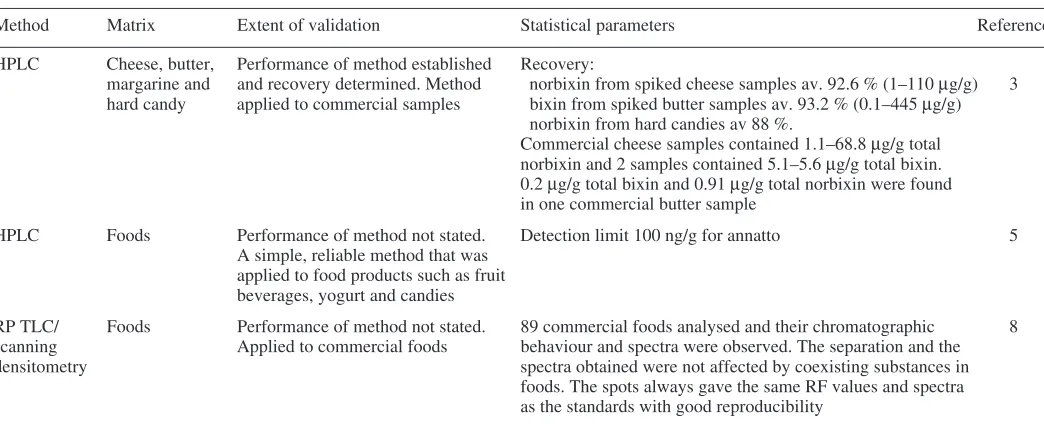
There are several methods published for the determination of annatto in foodstuffs. The traditional methods developed for annatto depend on its character-istic colour reactions.1,2 More recently HPLC,2–7 TLC8,9 and photoacoustic
spectrometry (PAS)10 methods have been developed. A summary of these methods
E160b: Annatto extracts 31
5.3
Recommendations
Colorimetric methods and various HPLC methods have been developed for specific foods but these methods require validation and further development to adapt them for use with all relevant foodstuffs where annatto is permitted.
5.4
References
1 Pearson’s Composition and Analysis of Foods, 9ed. Kirk R and Sawyer R, Longman Scientific, Harlow (1989).
2 ‘AOAC Official Method 925.13. Coloring matter in macaroni products’, AOAC Official Method of Analysis (2000) 32.5.15 p 55.
3 ‘Determination of annatto in high-fat dairy products, margarine and hard candy by solvent extraction followed by high-performance liquid chromatography’, Lancaster
F E, Lawrence J F. Food Additives and Contaminants (1995) 12(1), 9–19.
4 ‘Analysis of annatto (Bixa orellana) food coloring formulations. 1. Determination of coloring components and colored degradation products by high-performance liquid chromatography with photodiode array detection’, Scotter M J, Wilson L A, Appleton
G P, Castle L. Journal of Agricultural and Food Chemistry. (1998) 46(3), 1031–1038.
5 ‘High-performance liquid chromatographic separation of carminic acid, alpha- and beta-bixin and alpha- and beta-norbeta-bixin, and the determination of carminic acid in foods’,
Lancaster F E, Lawrence J F. Journal of Chromatography A. (1996) 732(2), 394–398.
6 ‘Identification of natural dyes added to food products’, Tricard C, Cazabeil J M, Medina
B. Sciences Des Aliments (1998) 18(1), 25–40. [French]
7 ‘Supercritical fluid carbon dioxide extraction of annatto seeds and quantification of trans-bixin by high pressure liquid chromatography’, Anderson S G, Nair M G, Chandra
A, Morrison E. Phytochemical Analysis (1997) 8(5), 247–249.
8 ‘Analysis of turmeric oleoresin, gardenia yellow and annatto extract in foods using reversed-phase thin layer chromatography/scanning densitometry’, Ozeki L, Ueno E, Ito Y, Hayashi T, Itakura Y, Yamada S, Matsumoto H, Ito T, Maruyama T, Tsuruta M,
Miyazawa T. Journal of the Food Hygienic Society of Japan (2000) 41(6), 347–352.
[Japanese]
9 Validation of Enforcement Methods Service (VEMS) Method 0240: TLC method for colours, annatto and curcumin in foods, general.
10 ‘Qualitative and semiquantitative analysis of annatto and its content in food additives by
Analytical methods for food additives
Table 5.1 Summary of methods for annatto extracts in foods (a)
Method Matrix Principle of method Reference
Colour reaction Macaroni products 80 % alcohol added to ground sample to extract colour, left overnight to precipitate 2
proteins, filtered, evaporated, 25 % NaCl solution and slight excess of NH4OH was added
to filtrate. Transferred to separating funnel and extracted with petroleum ether.
Combined petroleum ether extracts were washed with NH4OH and acidified with
CH3COOH.
In presence of SnCl2 annatto produced a purple stain
Spectroscopic Commercial annatto Oil-soluble annatto as bixin: 0.1 g to 200 mL 10 % acetic acid in chloroform. Diluted 4
formulations 1 in 10 with 3 % acetic acid in chloroform. Absorbance read at 505 and 474 nm.
Water-soluble annatto as norbixin: 0.1 g to 200 mL 5 % acetic acid in chloroform. Diluted 1 in 10 with chloroform. Absorbance read at 503 and 473 nm
RP TLC/scanning Foods 1 Clean-up with C18 cartridge. 8
densitometry 2 Separation by reverse-phase C18-TLC using acetonitrile–THF–0.1 mol/L oxalic acid
(7:8:7) as solvent system.
3 Measurement of visible absorption spectra using scanning densitom