Full Terms & Conditions of access and use can be found at
http://www.tandfonline.com/action/journalInformation?journalCode=vjeb20
Download by: [Universitas Maritim Raja Ali Haji], [UNIVERSITAS MARITIM RAJA ALI HAJI Date: 13 January 2016, At: 17:48
Journal of Education for Business
ISSN: 0883-2323 (Print) 1940-3356 (Online) Journal homepage: http://www.tandfonline.com/loi/vjeb20
Race, Hispanic Ethnicity, and the Future of the
College Business Major in the United States
Karen Leppel
To cite this article: Karen Leppel (2001) Race, Hispanic Ethnicity, and the Future of the College Business Major in the United States, Journal of Education for Business, 76:4, 209-215, DOI: 10.1080/08832320109601312
To link to this article: http://dx.doi.org/10.1080/08832320109601312
Published online: 31 Mar 2010.
Submit your article to this journal
Article views: 22
View related articles
Race, Hispanic Ethnicity, and the
Future
of
the College Business
Major
in the United States
KAREN LEPPEL
zyxwvutsrqponmlkjihgfedcbaZYXWVUTSRQPONMLKJIHGFEDCBA
Widener University Chester, Pennsylvania uring the 1970s and 1980s, under-
D
graduate business education expe- rienced great growth. While the total number of undergraduate degrees in all majors increased by 25% from 1970-71 to 1989-90, the number of business majors more than doubled. Between 1970-71 and 1987-88, bache- lor’s degrees in business rose from 13.7% to 24.4%. After peaking in 1992-93, the number of business majors started to decline, and by 1996-97 the number had fallen by almost 12%. Business as a percentage of bachelor’s degrees had declined to 19.3% in 1996-97 (U.S. Department of Education, 1999b, Table 255).Green (1992) attributed the business major boom to several factors. First, there was a shift in student values to more materialistic goals. That shift was probably due at least in part to job-mar- ket concerns triggered by the flood of baby-boomer college graduates in the early 1970s. Second, the increase in the number of older students with focused occupational concerns contributed to the rising number of business majors. Third, the number of minority students earning undergraduate degrees in- creased at a faster rate than the overall number of all students earning under- graduate degrees, and a disproportion- ate number of minority students received business degrees. That phe-
ABSTRACT.
zyxwvutsrqponmlkjihgfedcbaZYXWVUTSRQPONMLKJIHGFEDCBA
This article explores theimpact of race and Hispanic ethnicity
on the business major. Results of a sur- vey show that, when other characteris- tics are held constant, Asians and non-
Hispanic Blacks are less likely and Hispanics more likely to major in busi- ness than non-Hispanic Whites are. If,
for each demographic group, the high
school graduation rate, the percentage
of high school graduates attending
zyxwvutsrqponmlkjihgfedcbaZYXWVUTSRQPONMLKJIHGFEDCBA
4-year institutions, and the percentage of
students majoring in business remain constant, an increase in the number of
business majors can be expected. However, if Hispanics and non-His- panic Blacks make socioeconomic advances, the number of business majors is likely to increase to a lesser degree and may even decrease.
nomenon was probably partly the con- sequence of the improved business opportunities promoted by civil rights activism in the 1960s. Fourth, the num- ber of undergraduate degrees earned by foreign students grew considerably; a large percentage of those degrees were in business. Last, the movement of women out of traditional female careers, such as education, and into business was another major contributor to the boom.
Green (1 992) suggested that the sub- sequent decline in the number of busi- ness majors was precipitated by several
circumstances. First,
zyxwvutsrqponmlkjihgfedcbaZYXWVUTSRQPONMLKJIHGFEDCBA
an improvement in career opportunities and status forteachers resulted in rising numbers of
education majors between 1986-87 and 1990-91. Second, a large proportion of the potential population of older stu- dents already had attended college. Third, the excesses of United States businesses in the 1980s-including the Savings and Loan bailout, junk bonds, and jailing of insider traders-had probably sullied the image of business for students.
Numerous factors influence the probability that students will choose a
business major. Among these factors are race and Hispanic ethnicity. Conse- quently, the growing representation of Asians, Blacks, and Hispanics in the United States population will have an impact on the number and proportion of college students who choose a busi- ness major. In this article, I present research estimating the relationship between demographic characteristics and choice of major. Then, using the estimation results and projections of the future demographic composition of the United States population, I offer some speculations on the future of the business major.
Method
zyxwvutsrqponmlkjihgfedcbaZYXWVUTSRQPONMLKJIHGFEDCBA
Model
To predict a student’s probability of choosing a particular field of study, I
MarcWApril2001 209
compared the utility level expected from that field to the expected utilities associated with other fields. Linear functions were used as approximations for indirect utility functions. For person “a,” indirect utility associated with field
J was U,
zyxwvutsrqponmlkjihgfedcbaZYXWVUTSRQPONMLKJIHGFEDCBA
= XazyxwvutsrqponmlkjihgfedcbaZYXWVUTSRQPONMLKJIHGFEDCBA
Pj
+
E,~, wherezyxwvutsrqponmlkjihgfedcbaZYXWVUTSRQPONMLKJIHGFEDCBA
Xa wasa vector of characteristics of the student,
pj
was a set of vectors of parameters, and E~~ was a set of unobservable ran-dom error terms. To use maximum like- lihood logit analysis, the random error terms were assumed to be independent with density function f(e) = exp(- Among the influential characteristics were parents’ occupations. Having a parent with the prestige associated with a professional or executive occupation may influence a student’s choice of major. According to previous literature, women are more likely to choose male- dominated careers if their fathers have high occupation levels than if their fathers have low occupation levels (Betz
& Fitzgerald, 1987). Further, the moth- er’s influence as a role model is posi- tively related to the nontraditionality of the daughter’s college major choice (Hackett, Esposito, & O’Halloran, 1989), and women whose mothers work outside the home are more likely to “aspire to higher-skill innovative and prestigious jobs” than women whose mothers are full-time homemakers (Douvan, 1976).
Parents’ education can also affect choice of major. Women are more likely to choose male-dominated careers if their fathers have high education levels than if their fathers have low education levels (Betz & Fitzgerald, 1987). In addition, having highly educated parents increases the probability of women majoring in science, although it decreas- es the probability of men majoring in science (Ware, Steckler, & Leserman, 1985). Further, students who are in their family’s first generation of college atten- ders “are, in general, drawn to majors that have explicit links to careers” (Green, 1992).
How important a student thinks it is to be very well off financially may also affect choice of major. Students who think financial status is very important may be more likely to choose fields such as business, which students per-
21 0
zyxwvutsrqponmlkjihgfedcbaZYXWVUTSRQPONMLKJIHGFEDCBA
“ . 3 9
~){exp[-exp(-~)I
1.
zyxwvutsrqponmlkjihgfedcbaZYXWVUTSRQPONMLKJIHGFEDCBA
zyxwvutsrqponmlkjihgfedcbaZYXWVUTSRQPONMLKJIHGFEDCBA
Journal of Education for Business
ceive as more lucrative. Making money is very important to the business major (Daymont & Andrisani, 1984).
If a student grew up in a household with lower socioeconomic status and less financial security, then, ceteris
paribus, that student may feel more compelled to choose a field that is expected to result in better job opportu- nities. This effect may be based both on the student’s emotional need for finan- cial security and on pressure from par- ents. Other researchers have found that students from households with lower socioeconomic status are more likely to choose more lucrative fields of study (Davies & Guppy, 1997).
In addition, general scholastic ability may influence choice of major by deter- mining how difficult, stressful, or tedious the student finds the area. For example, students with majors in sci- ence and engineering tend to have high- er scores on quantitative standardized tests (Paglin & Rufolo, 1990). In addi- tion, brighter students have been found to be more likely to enter more lucrative fields (Davies & Guppy, 1997). Age may have an impact on choice of major as well. Older students are less likely to enter more lucrative fields (Davies &
Guppy, 1997).
Society has traditionally encouraged men and women to enter different fields. Though social pressures in this area are not as great as they have been in the past, there is still evidence of con- siderable gender-related stereotyping in job choice (Meier, 1991).
Race and Hispanic ethnicity may also influence the student’s utility by affecting his or her perception of the social acceptability of the field and the likelihood of succeeding in it. The types of occupations chosen by Black and White college men have been found to differ (Slaney & Brown, 1983). Sim- ilarly, differences may occur in the choice of college major based on race and Hispanic ethnicity. There may also be differences in choice of major based on whether a student was born in the United States. The high school dropout rate for Hispanics is lower for those born in the United States (National Center for Education Statistics, 1999), and such differences may extend to choice of college major.
Data
The data used in this study were based on the 1990 survey of Beginning Postsecondary Students (BPS). The sur- vey was conducted by the National Cen- ter for Education Statistics (NCES) of the U.S. Department of Education. The survey followed a group of students who began their postsecondary educa- tional careers during academic year 1989-90. This research included only students who were enrolled in courses leading to the bachelor’s degree. Of these students, 4,541 had complete information on the variables examined. For the major field of study, the aca- demic disciplines were grouped into four areas: (a) business, (b) humanities and social sciences, (c) science and engineering (which included mathemat- ics and computer science), and (d) “other majors.” Because of small cells for the minorities, it was necessary to group together as “other majors” the following fields: education, health, vocationalhechnical, and other techni- cal/professional.
Variables used to capture the effects of racial and ethnic differences were BLKNHSP (non-Hispanic Black), HIS- PANIC, and ASIAN. (American Indian and Alaska Native were omitted because of small numbers.) To capture the effects of not being a United States citizen, the dummy variable FOREIGN was included. Other variables included were gender (FEMALE), age as of 31 December 1989 (AGE), high academic ability (HIGHACAD), whether the stu- dent believed that being very well off financially was very important (WELLVI), socioeconomic status per- centile (SES), whether the student’s father’s occupation was categorized as professional or executive (DOCC), whether the student’s mother’s occupa- tion was categorized as professional or executive (MOCC), and whether the student had a parent who had attended college (PARCOLL). The variable HIGHACAD indicated whether the stu- dent perceived him- or herself as above average in academic ability. This vari- able was used instead of Scholastic Aptitude Test scores because SAT scores were available for only 29% of the respondents.
To understand the impact of race/eth- nicity on choice of major, while control- ling for variation in other variables, I performed logit analysis using the CAT- MOD procedure of SAS. Based on the CATMOD specification, the values of the categorical variable FEMALE were 1 and -1 for females and males, respec- tively. The values of the other categori- cal variables were defined similarly. The direction and statistical significance are interpreted analogously to the typi- cal 1,0 dummy variable classification.
The dependent variable was the log of the odds of choosing one field of study over another. In this particular context, the dependent variable [ln(Pa/Pb)] is the logarithm of the ratio of the probability of selecting college field “a” to the probability of selecting the field of business. Letting CHOICE represent that log, the empirical specifi- cation becomes Males Full sample Non-Hispanic Whites Non-Hispanic Blacks Asians Hispanics Full sample Non-Hispanic Whites Non-Hispanic Blacks Asians
Females
zyxwvutsrqponmlkjihgfedcbaZYXWVUTSRQPONMLKJIHGFEDCBA
~ Hispanics(1) CHOICE = b,
+
b, FEMALE+
b, PANIC+
b, FOREIGN+
b, AGE+
b, HIGHACAD
+
b, WELLVI+
b,zyxwvutsrqponmlkjihgfedcbaZYXWVUTSRQPONMLKJIHGFEDCBA
SES
+
b,, PARCOLL+
b,, DOCC+
b,, MOCC.BLKNHSP
+
b, ASIAN+
b, HIS-Resu
I tszyxwvutsrqponmlkjihgfedcbaZYXWVUTSRQPONMLKJIHGFEDCBA
An examination of the percentage distribution of major fields by raciayeth- nic groups showed differences among demographic groups (see Table 1). In particular, compared with non-Hispanic Whites, Asians were less likely to major in business, whereas nowHispanic Blacks and Hispanics were more likely to major in business. In addition, non- Hispanic Blacks were less likely than non-Hispanic Whites to major in the humanities and social sciences. Further, Asians and non-Hispanic Blacks were more likely than non-Hispanic Whites to major in science and engineering.
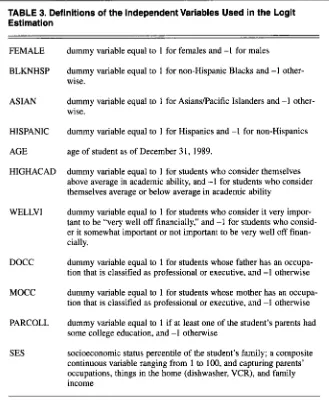
In Table 2, I provide the means of the independent variables for the full sam- ple and for the four race/ethnicity sub- groups. For ease of interpretation, the categorical variables in Table 2 were assigned values of ones and zeroes. (Note that this specification is different from SAS’s CATMOD specification, which is described in Table 3.) For the
non-Hispanic Black group, compared
with the three other groups, I found that (a) the percentage of females was high- er, (b) the percentage of students who considered themselves above average academically was lower, (c) the per- centage of students who considered financial success to be very important was higher, and (d) the percentage of students whose fathers had professional or executive occupations was lower. For the Hispanics, compared with the other three groups, (a) the percentage of stu- dents whose mothers had professional
or executive occupations was lower, and (b) the percentage of students with at least one parent with some college was lower.
[image:4.612.228.564.464.691.2]The logit estimation results presented in Table 4 are interpretable as follows. The three parameters listed for each variable represent the estimated coeffi- cient of that variable-(the b in equa- tion (1))-for the log of the odds of choosing the humanities and social sci- ences relative to business, the sciences and engineering relative to business,
TABLE 1. Percentage Distribution of Major Fields by Racial/Ethnic Groups
Humanities and Science and “Other Business social sciences engineering majors”
21.9 21.8 23.2 13.8 31.0 18.9 18.6 19.4 18.1 25.3 30.2 29.6 22.2 45.9 32.2 37.0 38.1 29.7 31.4 34.5
30.6 17.4
30.6 18.0
32.3 22.2
32.1 8.3
27.6 9.2
14.3 29.7
12.9 30.4
19.4 31.5
31.4 19.1
16.1 24.1
TABLE 2. Means of Independent Variables, by RaciallEthnic Group
Full Non-Hispanic Non-Hispanic
Variable sample Whites Blacks Asians Hispanics
FEMALE AGE FOREIGN HIGHACAD WELLVI PARCOLL DOCC MOCC SES 0.5006 18.367 0.0 167 0.55 12 0.4321 0.7472 0.5457 0.4490 77.893 0.4920 18.370 0.0062 0.5632 0.4094 0.7509 0.5593 0.4579 79.233 ~~ 0.6250 18.333 0.0341 0.3636 0.6629 0.6970 0.3485 0.3826 66.1 17 0.4907 18.238 0.1449 0.5561 0.5374 0.8178
0.598 1
0.4626
76.383
zyxwvutsrqponmlkjihgfedcbaZYXWVUTSRQPONMLKJIHGFEDCBA
0.5000 18.506 0.0690 0.5575 0.4483 0.6437 0.4598 0.3333
67.316
zyxwvutsrqponmlkjihgfedcbaZYXWVUTSRQPONMLKJIHGFEDCBA
Nore. For ease of interpretation, categorical variables were assigned values of zero and one. (Thus,
the mean of 0.5006 for the full sample for FEMALE implies that 50.06% of the observations in the sample were female.) The specification differs from S A S S CATMOD specification (see Table
3), which is used in the remainder of the article.
MarcWApril2001 21 1
TABLE 3. Definitions of the Independent Variables Used in the Logit
Estimation
zyxwvutsrqponmlkjihgfedcbaZYXWVUTSRQPONMLKJIHGFEDCBA
FEMALE BLKNHSP ASIAN HISPANIC AGE HIGHACAD WELLVI DOCC
MOCC
PARCOLL SES
dummy variable equal to 1 for females and -1 for males
dummy variable equal to I for non-Hispanic Blacks and -1 other- wise.
dummy variable equal to
zyxwvutsrqponmlkjihgfedcbaZYXWVUTSRQPONMLKJIHGFEDCBA
1 for AsiansPacific Islanders and -1 other-wise.
dummy variable equal to 1 for Hispanics and -1 for non-Hispanics age of student as of December 31, 1989.
dummy variable equal to 1 for students who consider themselves above average in academic ability, and -1 for students who consider themselves average or below average in academic ability
dummy variable equal to 1 for students who consider it very impor-
tant to be “very well off financially,” and -1 for students who consid-
er it somewhat important or not important to be very well off finan- cially.
dummy variable equal to 1 for students whose father has an occupa-
tion that is classified as professional or executive, and -1 otherwise
dummy variable equal to 1 for students whose mother has an occupa-
tion that is classified as professional or executive, and -1 otherwise dummy variable equal to 1 if at least one of the student’s parents had some college education, and -I otherwise
socioeconomic status percentile of the student’s family; a composite
continuous variable ranging from 1 to 100, and capturing parents’ occupations, things in the home (dishwasher, VCR), and family
income
zyxwvutsrqponmlkjihgfedcbaZYXWVUTSRQPONMLKJIHGFEDCBA
Nore. The definitions of the categorical variables given here are based on
zyxwvutsrqponmlkjihgfedcbaZYXWVUTSRQPONMLKJIHGFEDCBA
SAS’s CATMOD speci-fication and differ from those used in Table 2.
and “other majors” relative to business, respectively. The results for the race and ethnicity variables are examined after the results for the other variables.
The estimation results showed that foreign students were less likely to choose humanities and social sciences or science and engineering over busi- ness, and more likely to choose “other majors” over business. Students from families with higher socioeconomic sta- tus were more likely to choose humani- ties and social sciences over business, and less likely to choose science and engineering or “other majors” over business. A “first-generation college attended’ effect was seen; students who had a parent who had attended college were more likely to choose to major in humanities and social sciences rather than business. Students who had a par-
21 2
zyxwvutsrqponmlkjihgfedcbaZYXWVUTSRQPONMLKJIHGFEDCBA
Journal of Education for Businessent who had attended college were less likely to choose science and engineering over business. Students with fathers in professional and executive occupations were more likely to choose to major in fields other than business. Students with mothers in professional and executive occupations were less likely to choose science and engineering or “other majors” over business.
Students who considered it very important to do very well financially were more likely to choose business over any other category of major. The same held for older students. Women were more likely to choose humanities and social sciences or “other majors” over business and less likely to choose science and engineering over business. Students who considered themselves above average in academic ability were
more likely to choose humanities and social sciences or science and engineer- ing over business and less likely to choose “other majors” over business.
The logit estimation coefficients of the Asian and non-Hispanic Black vari- ables indicated that, when other vari- ables were held constant, Asians and non-Hispanic Blacks were less likely than non-Hispanic Whites to choose a business major over other fields. Hispan- ics, on the other hand, were more likely than non-Hispanic Whites to choose a business major over other fields.
The percentage of students with a business major was slightly greater for non-Hispanic Blacks than for non-His- panic Whites (see Table 1). The logit analysis indicated, however, that non- Hispanic Blacks were less likely to choose business majors. This apparent paradox can be explained by the fact that other characteristics related to choice of major differed for the two groups. More Whites than Blacks had fathers with professional or executive occupations, and more Whites per- ceived themselves as being above aver- age in academic ability. Both of these factors reduced the probability of choosing a business major over either a humanities/social sciences or science/engineering major. In addition, fewer Whites considered doing very well financially to be very important, an attitude that was directly related to the odds of choosing a business major. Also, Whites tended to have higher socioeconomic status and a greater ten- dency to have a parent who had attend- ed college than Blacks. These factors reduced the probability of choosing business over humanities/social sci- ences, but increased the odds of choos- ing business over science/engineering. These findings imply that if Blacks make socioeconomic and educational advances, fewer of them would be expected to major in business. The trend is also evident in the data provided in
Table
zyxwvutsrqponmlkjihgfedcbaZYXWVUTSRQPONMLKJIHGFEDCBA
5 . The probability of majoring in business was higher for non-HispanicBlacks than for non-Hispanic Whites, when those probabilities were evaluated at the median characteristics for those two groups. However, when both proba- bilities were evaluated at the median characteristics for non-Hispanic Whites,
[image:5.612.52.381.43.443.2]the predicted probability of majoring in Hispanics (see Table 1). When socioeco- business was lower for non-Hispanic nomic status, parents’ education, Blacks than for non-Hispanic Whites. father’s occupation, and self-perceived Compared with non-Hispanic Whites, academic ability were examined, the the percentage of students with a busi- same conclusions held for Hispanics as
ness major was considerably higher for for non-Hispanic Blacks in comparison
zyxwvutsrqponmlkjihgfedcbaZYXWVUTSRQPONMLKJIHGFEDCBA
TABLE 4. Multinomial Logit Estimation Results-Dependent Variable:
In[prob(field l)/prob(BUS)]
zyxwvutsrqponmlkjihgfedcbaZYXWVUTSRQPONMLKJIHGFEDCBA
Fieldb
(1) (2) (3)
Humanities &
zyxwvutsrqponmlkjihgfedcbaZYXWVUTSRQPONMLKJIHGFEDCBA
Science &Variable social sciences engineering “Other majors” CONSTANT 0.0643 (0.1558) 2.6742 (0.1922)** 1.4876 (0.1544)**
FEMALE 0.2245 (0.0136)** -0.3095 (0.0154)** 0.3458 (0.0149)**
BLKNHSP 0.2580 (0.0291)** 0.3683 (0.0310)** 0.1229 (0.0303)**
ASIAN 0.3978 (0.0347)** 0.5748 (0.0357)** 0.1823 (0.0379)**
HISPANIC -0.1606 (0.0357)** -0.1305 (0.0370)** -0.4454 (0.0422)**
FOREIGN -0.4062 (0.0572)** -0.2805 (0.0552)** 0.3182 (0.0491)**
AGE -0.0142 (0.0054)** -0.0907 (0.0079)** -0.0538 (0.0056)**
HIGHACAD 0.1479 (0.0137)** 0.3010 (0.0154)** -0.1610 (0.0149)**
SES 0.0082 (0.0010 )** -0.0081 (0.0010)** -0.0032 (0.0010)**
DOCC 0.0842 (0.0164)** 0.2220 (0.0183)** 0.0913 (0.0178)**
MOCC 0.0148 (0.0144) -0.1064 (0.0159)** -0.0614 (0.0158)** “he standard errors are in parentheses. ’There were 926 students with fields in business; 1,526 in the humanities and social sciences; 1,019 in the sciences and engineering; and 1,070 in “other majors.’’
*Statistically significant at the 5.00% level.
**Statistically significant at the 1 .OO%
zyxwvutsrqponmlkjihgfedcbaZYXWVUTSRQPONMLKJIHGFEDCBA
level.WELLVI -0.4222 (0.0139)** -0.4347 (0.0153)** -0.2537 (0.0150)**
PARCOLL 0.0881 (0.0179)** -0.0416 (0.0191)* -0.0740 (0.0184)**
with non-Hispanic Whites. Thus, if His- panics make socioeconomic and educa- tional advances, they too would become less likely to major in business. Howev- er, the negative logit estimation coeffi- cients indicated that they would remain more likely than non-Hispanic Whites to major in business. Again these ideas can
be seen as well by examining Table
zyxwvutsrqponmlkjihgfedcbaZYXWVUTSRQPONMLKJIHGFEDCBA
5 .The probability of majoring in business was higher for Hispanics than for non- Hispanic Whites, when those probabili- ties were evaluated at the median char- acteristics for those two groups. When both probabilities were evaluated at the median characteristics for non-Hispanic Whites, the predicted probability of majoring in business remained higher for Hispanics than for non-Hispanic Whites, but the gap was much smaller.
Relative to non-Hispanic Whites, a lower percentage of Asian students had a business major (see Table 1). The characteristics of Asian students were more similar to those of non-Hispanic White students than were the character- istics of non-Hispanic Blacks and His- panics. The most noteworthy discrepan- cy was in the percentage considering it very important to do very well finan- cially (53.7% for Asians versus 40.9%
[image:6.612.50.383.127.369.2]for non-Hispanic Whites). ~~~ ~~ ~~ ~
TABLE 5. Predicted Absolute Probabilities
Humanities and Science and
Business social sciences engineering “Other majors”
Males Females Males Females Males Females Males Females
zyxwvutsrqponmlkjihgfedcbaZYXWVUTSRQPONMLKJIHGFEDCBA
Based on median characteristics
zyxwvutsrqponmlkjihgfedcbaZYXWVUTSRQPONMLKJIHGFEDCBA
ofzyxwvutsrqponmlkjihgfedcbaZYXWVUTSRQPONMLKJIHGFEDCBA
own raciavethnic group”Non-Hispanic Whites 0.1322 0.1182 0.3373 0.4723 0.4122 0.1984 0.1183 0.2111
Non-Hispanic Blacks 0.253 1 0.2072 0.2480 0.3 180 0.2854 0.1258 0.2136 0.3491
Asians 0.1201 0.1166 0.2916 0.4438 0.4952 0.2590 0.093 1 0.1806
Hispanics 0.2255 0.2101 0.3 168 0.4625 0.3858 0.1936 0.07 19 0.1337
Based on median characteristics of non-Hispanic Whites
Non-Hispanic Whites 0.1322 0.1182 0.3373 0.4723 0.4122 0.1984 0.1183 0.21 1 1
Non-Hispanic Blacks 0.0774 0.0742 0.3305 0.4965 0.5036 0.2600 0.0885 0.1694
Asians 0.0562 0.0564 0.3 179 0.4995 0.5535 0.2989 0.0724 0.1451
Hispanics 0.1780 0.1688 0.3293 0.4892 0.4274 0.2 182 0.0653 0.1237 “For all raciakthnic groups, predicted absolute probabilities were based on an individual who was 18 years old, was a US. citizen, had at least one par- ent with some college education, and had a mother who did not have a professionaUexecutive occupation. For all groups except the non-Hispanic Blacks, the individual perceived himherself as being above average academically. For Asians and non-Hispanic Whites, the father had a professionaVexecutive occupation; for Hispanics and non-Hispanic Blacks, the father did not. For Asians and non-Hispanic Blacks, the student considered it very important to do very well financially; for Hispanics and non-Hispanic Whites, the student did not. For Asians and non-Hispanic Whites, the family’s socioeconomic status was ranked at the 87th percentile; for non-Hispanic Blacks and Hispanics, the family’s socioeconomic status was at the 67th and 74th percentiles, respectively.
MarcWApril2001 21 3
[image:6.612.52.565.437.664.2]Speculations for the Future
zyxwvutsrqponmlkjihgfedcbaZYXWVUTSRQPONMLKJIHGFEDCBA
The Hispanic, Asian, and non-His- panic Black populations in the United States are all growing more rapidly than the non-Hispanic White population. As indicated, the probability of majoring in different fields varies with race and eth- nicity, as well as with other important characteristics. Consequently, changes in the racial and ethnic composition of the United States can be expected to have ramifications for the distribution of majors in higher education.
To explore some possible future trends, I performed some calculations.
The number
zyxwvutsrqponmlkjihgfedcbaZYXWVUTSRQPONMLKJIHGFEDCBA
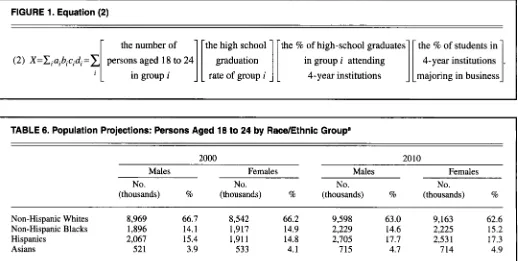
X of persons that are tradi-tionally-aged (1 8 to 24) college busi- ness majors in 4-year institutions can be estimated as follows: For each demo- graphic group i, let ai equal the number of persons aged 18 to 24, bi equal the high school graduation rate, ci equal the percentage of high school graduates attending 4-year institutions, and di equal the percentage of students major- ing in business in 4-year institutions. Then, the number of college business majors is estimated as the sum of the products of the four terms as shown in equation (2) (see Figure 1).
The total number Y of persons who
are traditionally-aged college students
(all majors) in 4-year institutions can be
estimated as Y
zyxwvutsrqponmlkjihgfedcbaZYXWVUTSRQPONMLKJIHGFEDCBA
= Ci ai bi ci. To estimatethe percentage of students in 4-year institutions who are business majors, X
was divided by Y. The demographic groups used in the calculations were males and females from the four racelethnic groups discussed in previous sections of this article: non-Hispanic Whites, non-Hispanic Blacks, Hispan- ics, and Asians. (The category American Indian, Eskimo, and Aleut, which com- prises less than 1% of the United States population, was not included.)
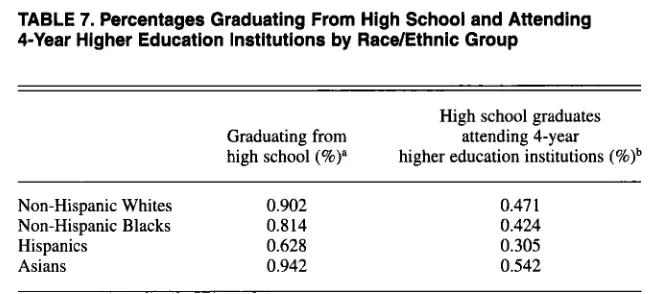
The numbers of persons aged 18 to 24 (the ai terms) were obtained from the
U.S. Census Bureau (see Table
zyxwvutsrqponmlkjihgfedcbaZYXWVUTSRQPONMLKJIHGFEDCBA
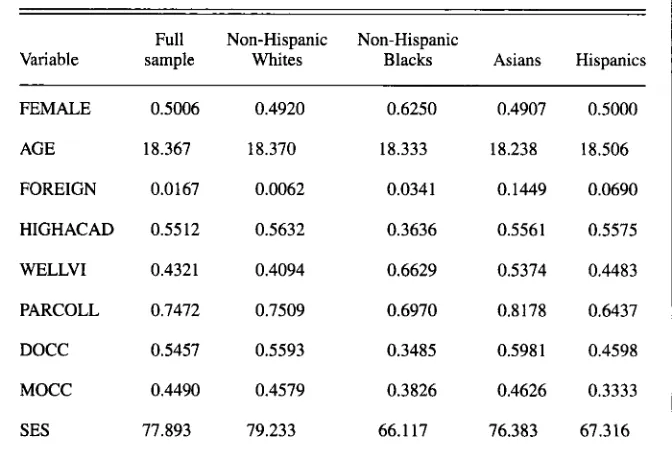
6 ) . Thehigh school graduation rates (bi) and the percentage of high school graduates attending 4-year institutions (ci) were obtained from the U.S. Department of Education (see Table 7). The percentage
of students in 4-year institutions major- ing in business (di) was estimated from the data set used in the current study (see Table 1). For ai and di, gender-specific figures were available. For bi and ci, sep- arate figures for males and females were not available; hence, the overall figures for both genders combined were used.
Projections for the future of the busi- ness major were made based on the
assumptions that the patterns regarding high school graduation rates, attendance rates at 4-year institutions, and rates of choosing business as a major for the various demographic groups are stable. The estimated percentage of students in 4-year institutions majoring in business was expected to increase from 20.76% in 2000 to 20.83% in 2010. The number of business majors in 4-year institutions was expected to increase by 253,000 from 2,088,000 in 2000 to 2,341,000 in 2010, a 12.1% increase. The increase is a result of growing numbers of Blacks and Hispanics in the United States and the higher incidence of business majors in those two groups.
[image:7.612.49.567.448.709.2]The aforementioned figures were based on constant rates used to compute the products. However, if Hispanics and non-Hispanic Blacks make socioeco- nomic advances, the total number of students majoring in business is likely to increase less, because the proportions of Hispanics and non-Hispanic Blacks majoring in business are expected to fall. Further, the total number of stu- dents majoring in business may actually drop because, holding other characteris- tics constant, non-Hispanic Blacks (and Asians) are less likely to major in busi- ness than are non-Hispanic Whites.
FIGURE 1. Equation (2)
the % of students in majoring in business the number of
(2) X = C , a i b i c i d i = ~
4-year institutions
zyxwvutsrqponmlkjihgfedcbaZYXWVUTSRQPONMLKJIHGFEDCBA
i
TABLE 6. Population Projections: Persons Aged 18 to 24 by RacelEthnic Groupa
2000 2010
Females Males Females Males
No. No. No. No.
(thousands) % (thousands) % (thousands) % (thousands)
zyxwvutsrqponmlkjihgfedcbaZYXWVUTSRQPONMLKJIHGFEDCBA
YONon-Hispanic Whites 8,969 66.7 8,542 66.2 9,598 63.0 9,163 62.6 Non-Hispanic Blacks 1,896 14.1 1,917 14.9 2,229 14.6 2,225 15.2 Hispanics 2,067 15.4 1,911 14.8 2,705 17.7 233 1 17.3 Asians 521 3.9 533 4.1 715 4.7 7 14 4.9
~~~
"U.S. Census Bureau. (2000). (NP-Dl-A) Projections
zyxwvutsrqponmlkjihgfedcbaZYXWVUTSRQPONMLKJIHGFEDCBA
of the Resident Population by Age, Sex, Race, and Hispanic Origin: 1999-2100 (Middle Series).Issued January 13, 2000.
21 4 Journal of Education for Business
TABLE 7. Percentages Graduating From High School and Attending
4-Year Higher Education Institutions by Race/Ethnic Group
zyxwvutsrqponmlkjihgfedcbaZYXWVUTSRQPONMLKJIHGFEDCBA
High school graduates
higher education institutions
zyxwvutsrqponmlkjihgfedcbaZYXWVUTSRQPONMLKJIHGFEDCBA
(%)bGraduating from attending 4-year
high school
zyxwvutsrqponmlkjihgfedcbaZYXWVUTSRQPONMLKJIHGFEDCBA
(%)”Non-Hispanic Whites 0.902 Non-Hispanic Blacks 0.814
Hispanics 0.628
Asians 0.942
0.47 1 0.424 0.305 0.542
aUu.S. Department of Education, National Center for Education Statistics. (1999, November).
zyxwvutsrqponmlkjihgfedcbaZYXWVUTSRQPONMLKJIHGFEDCBA
Dropout Rates in the United States: 1998, Table A. bU.S. Department of Education, National Cen- ter for Education Statistics. (1997, October). Access to Postsecondary Education for the 1992 High School Graduates, Table 2.
Summary and Conclusions
This research has used a national level data set and logit analysis to explore the impact of race and Hispanic ethnicity on the probability of majoring in business. It was found that though non-Hispanic Blacks have a higher rate of majoring in business than non-His- panic Whites do, when other character- istics are held constant, non-Hispanic Blacks are actually less likely to major in business. Hispanics are more likely to major in business than non-Hispanic Whites are, and Asians are less likely to major in business than non-Hispanic Whites are.
Those demographic differences in major choice, coupled with increasing representation of non-Hispanic Blacks, Hispanics, and Asians in the U.S. popu-
lation, have implications for the future growth of the business major. If, for each demographic group between 2000 and 2010, the high school graduation rate, the percentage of high school grad- uates attending 4-year institutions, and the percentage of students in 4-year institutions majoring in business remain the same as in the 1990s, an increase in the number of busines majors can be expected. However, if Hispanics and non-Hispanic Blacks make socioeco- nomic advances, the number of business majors is likely to increase less and may even decrease.
REFERENCES
Betz, N., & Fitzgerald, L. F. (1987). The career
psychology of women. Orlando,
zyxwvutsrqponmlkjihgfedcbaZYXWVUTSRQPONMLKJIHGFEDCBA
FL: AcademicPress.
Davies, S., & Guppy, N. (1997). Fields of study, college selectivity, and student inequalities in
higher education. Social
zyxwvutsrqponmlkjihgfedcbaZYXWVUTSRQPONMLKJIHGFEDCBA
Forces, 75, 1417-1438.Daymont. T. N., & Andrisani, P. J. (1984). Job preferences, college major, and the gender gap in earnings. Journal of Human Resources. 19, 408428.
Douvan, E. (1976). The role of models in women’s professional development Psycholo- gy of Women Quarterly, I , 5-15.
Green, K. C. (1992). After the boom: Management majors in the 1990s. New York: McGraw-Hill.
Hackett, G., Esposito, D., & O’Halloran, M.
zyxwvutsrqponmlkjihgfedcbaZYXWVUTSRQPONMLKJIHGFEDCBA
S .(1989). The relationship of role model influ- ences to the career salience and educational and career plans of college women. Journal of Vocational Behavior, 35, 164-180.
Meier, S. T. (1991). Vocational behavior, 1988- 1990: Vocational choice, decision-making, career development interventions, and assess- ment. Journal of Vocational Behavior, 39,
Paglin, M., & Rufolo, A. M. (1990). Heteroge- neous human capital, occupational choice, and male-female earnings differences. Journal of Labor Economics, 8, 123-144.
Slaney, R. B., & Brown, M. T. (1983). Effects of
race and socioeconomic status on career choice variables among college men. Journal of Voca- tional Behavior; 23, 257-269.
U.S. Census Bureau. (2000). (NP-DI-A) Pmjec- tions of the resident population by age,sex, race, and Hispanic origin: 1999-2100 (Middle Series). Issued January 13, 2000. Washington, DC: Author.
U.S. Department of Education, National Center for Education Statistics. (1997). Access to post- secondary education for the 1992 high school graduates (Table 2). Washington, DC: Author. U.S. Department of Education, National Center
for Education Statistics. (1998). Dropout rates in the United States: 1998. Washington, DC: Author.
U S . Department of Education, National Center for Education Statistics. (1999a). Digest of edu- cation statistics. Washington, DC: Author. U.S. Department of Education, National Center
for Education Statistics. (1999b). Dropout rates in the United States: 1998 (Table A). Washing- ton, DC: Author
Ware, N. C., Steckler, N. A., & Leserman, J. (1985). Undergraduate women: Who chooses a science major? Journal of Higher Education, 131-181.
56. 73-84.
![TABLE 4. zyxwvutsrqponmlkjihgfedcbaZYXWVUTSRQPONMLKJIHGFEDCBAMultinomial Logit Estimation Results-Dependent In[prob(field l)/prob(BUS)] zyxwvutsrqponmlkjihgfedcbaZYXWVUTSRQPONMLKJIHGFEDCBA](https://thumb-ap.123doks.com/thumbv2/123dok/1206927.777515/6.612.52.565.437.664/table-zyxwvutsrqponmlkjihgfedcbazyxwvutsrqponmlkjihgfedcbamultinomial-logit-estimation-results-dependent-field-zyxwvutsrqponmlkjihgfedcbazyxwvutsrqponmlkjihgfedcba.webp)