and Student Achievement
Andrew J. Houtenville
Karen Smith Conway
a b s t r a c t
This article investigates an important factor in student achievement—parental involvement. Using data from the National Education Longitudinal Study (NELS), we estimate a value-added education production function that includes parental effort as an input. Parental effort equations are also estimated as a function of child, parent, household, and school characteristics. Our results suggest that parental effort has a strong positive effect on achievement that is large relative to the effect of school resources and is not captured by family background variables. Parents appear to reduce their effort in response to increased school resources, suggesting potential ‘‘crowding out’’ of school resources.
I. Introduction
There is a long-standing debate whether improving school financial resources will improve student achievement. Some have found positive effects (Hedges and Greenwald 1996; Krueger 1999) while others have found negligible or even neg-ative effects (see Hanushek 1996). Researchers have focused on specific factors such as teacher characteristics (for example, Rivkin, Hanushek, and Kain 2005), peer effects (Hanushek et al. 2003), class size (Angrist and Lavy 1999; Hoxby 2000), or birth order and family size (Hanushek 1992).
In this paper, we investigate another important factor in student achievement— parental involvement—and the role it plays in student achievement. We also examine
Andrew J. Houtenville is a senior research associate at Cornell University, School of Industrial and Labor Relations, Employment and Disability Institute. Karen Smith Conway is a professor of economics at the University of New Hampshire. Earlier versions of this research were presented at the meetings of the American Economic Association, Econometric Society, and Southern Economic Association Meetings, and seminars at Butler University, University of Connecticut, IUPUI, the University of New Hampshire and Syracuse University. This paper has benefited tremendously from the comments of those present at these presentations. The authors are especially indebted to Paul Carlin, Thomas Downes, David Figlio, Thomas Nechyba, Robert Sandy, Stanley Sedo, and Randy Walsh for their helpful suggestions. Researchers may obtain this data by application to the National Center for Education Statistics. The authors of this article will be happy to advise other researchers about the application process.
½Submitted June 2003; accepted May 2007
ISSN 022-166X E-ISSN 1548-8004Ó2008 by the Board of Regents of the University of Wisconsin System
the factors associated with parental effort, including school resources, and whether parents magnify or diminish the effects of school resources. It is our central premise that parental time allocation may respond to changes in school resources and other factors, and therefore may not be well captured by time-invariant variables that at-tempt to capture family-specific factors such as parental education or family fixed effects. For example, Murnane and Levy (1996) found that of fifteen Austin, Texas schools that were given $300,000 a year as part of a settlement, thirteen saw little improvement, while the two schools that did see an improvement had invested heavily in getting parents involved. In theory, parents could scale back involvement in their children’s education, thus attenuating any positive effects of increased finan-cial support for education.
We use the National Education Longitudinal Study (NELS) to estimate a tradi-tional education production function and then include parental effort measures to in-vestigate the effect of parental effort and its potential interaction with other inputs. We then look into the association of parental effort with other child, parent, house-hold, and school characteristics. Our results suggest that parental effort has a strong positive direct effect on student achievement that is large relative to the effect of school resources. Our analyses also show that parents may respond to an increase in school resources by reducing their effort. Taken together, these findings suggest that parents offset or ‘‘crowd out’’ the effects of improved school resources. In our data, however, we do not find evidence of substantial crowd out, mostly because of the small magnitude of the estimated parents’ responses to school resources.
II. Brief Discussion of the Literature
A. Education Production Literature
Since the landmark 1966 Coleman Report—which found evidence that poor black children did perform better in integrated middle-class schools—researchers from a number of disciplines have sought empirical evidence of which inputs influence stu-dent achievement. This literature spawned a debate around whether financial resour-ces influence student achievement; notably summarized by Hanushek (1996), who finds a negligible, and perhaps even negative effect, and Hedges and Greenwald (1996) and Krueger (1999) who find positive effects. As the literature has progressed, the specificity of the production function has increased as data sources become richer, allowing researchers to focus on the role of specific characteristics, for in-stance, teacher characteristics (for example, Rivkin, Hanushek, and Kain 2005), peer effects (Hanushek et al. 2003), class size (Angrist and Lavy 1999 and Hoxby 2000), and birth order and family size (Hanushek 1992).
unobserved family variables (for example, Hanushek et al. 2003), whereby the fam-ily is captured by a fixed effect.
B. Going Beyond Family Background
The literature on household production and time-allocation models parental effort as a matter of constrained choice. That literature focuses on housework, childcare, and fe-male labor supply issues (for example, Leibowitz 1974, 1977; Hill and Stafford 1977, 1980; Kooreman and Kapteyn 1987, and Kim 2001). Mother’s education plays a central role, for it was found to have the most impact on time spent with children. In this paper, we delve deeper into the role that direct parental effort plays in the production of aca-demic achievement and factors associated with parental time allocation.1
III. Theoretical Framework
To guide our empirical specification, we draw upon the household production and time-allocation theory (Becker 1965 and Becker and Tomes 1976). Our framework is similar to that put forward by Todd and Wolpin (2003) but is sim-plified to focus on the role of parental effort. We assume that parents maximize util-ity derived from their child’s achievement (A), a composite good (C), and leisure (L),
maxUðA;C;LÞ; ð1Þ
subject to (i) an achievement production function that mixes parental effort (E) with available schooling resources (So),
A¼fðE;SoÞ; ð2Þ
(ii) a time constraint, where total time (T) is the sum of hours worked (H), leisure (L), and parental effort (E),
T¼H+L+E; ð3Þ
and (iii) a budget constraint,
pSSo+pCC¼wH+Y; ð4Þ
wherepSandpCare prices;wis a market wage, and Yis nonlabor income. After some simplifying assumptions, this model yields effort supply and leisure demand functions.2 The amount of achievement demanded is determined by the
1. The dynamic of family inputs has implications that extend to other areas in education research. For ex-ample, the education literature acknowledges that parents choose their neighborhood based on the quality of local public schools or choose to send their children to private schools. Witte (1996) summarizes knowledge on factors determining choice (for example, what makes parents decide to send their children to private schools) and the effects that those choices (magnet schools, private schools, etc.) have on student achieve-ment. Nechyba (2000) models the effect of vouchers in the presence of mobile households.
amount of effort supplied and the production function. Comparative static results (available upon request) reveal that the response of parents to a change in school resources (@E=@So) is theoretically ambiguous, owing to a negative income effect, a negative achievement effect, and an ambiguous productivity effect. The negative income effect stems from the fact that a change in school resources changes the household’s disposable full income assuming that parents must pay for the change.3 The negative achievement effect reflects the fact that an increase in school resources allows parents to lower their effort while maintaining the chosen level of academic achievement. The ambiguous productivity effect hinges on whether school resources and parental effort are substitutes or complements in production. For instance, a small class size may facilitate greater teacher attention so that parental tutoring is not as necessary (substitutes). Or, more resources may mean more challenging home-work and other activities for parental involvement (complements).
The total effect of school resources on achievement is the sum of an indirect effect (@A=@E3@E=@So) and a direct effect (@A=@So). Presumably, effort has a nonnega-tive effect on achievement (@A=@E$0). So, if parental effort decreases with an increase in school resources (@E=@So
,0), then the indirect effect of school resour-ces is negative, which may help explain the weak results for school resourresour-ces some-times found in the literature.
School production function and achievement studies often include an extensive list of household variables to proxy for parental effort and other household resources, or eliminate the effects of such variables using panel data or natural experiments. An implication of this model is that household inputs such as parental effort may not be static in the face of changing school resources.
IV. Empirical Analysis
To pursue the implications of this model, we estimate two sets of de-scriptive regressions. In the first set, we examine (a) the association between parental effort and student achievement, (b) whether different types of parental effort have differing effects, and (c) whether the usual household variables are sufficient to cap-ture parental effort. In the second set, we look at the factors related to the supply of parental effort, including school resources. In additional analyses, we examine the interactions of parental effort and school resources in the production of achievement and whether treating parental effort as endogenous affects our general conclusions.
A. Data Source
We utilize data from the NELS, which is a comprehensive longitudinal national sur-vey of 24,599 eighth grade students (from 815 public schools and 237 private schools), their parents, teachers, and school administrators. Along with the survey, each student took standardized tests in reading, mathematics, science, and social
studies. The NELS follows and retests the same students from eighth grade to tenth grade to twelfth grade and surveys them every two years thereafter. Specifically, we use data from the eighth and tenth grade student surveys and examinations, the eighth grade parent survey (there is no parental survey in tenth grade), and the tenth grade administrator survey. We focus on the earlier years of the NELS because we believe that parental effort is likely to be most influential the younger the child. Panel data techniques are not feasible due to inconsistencies in the way parental effort is measured.
B. Variables
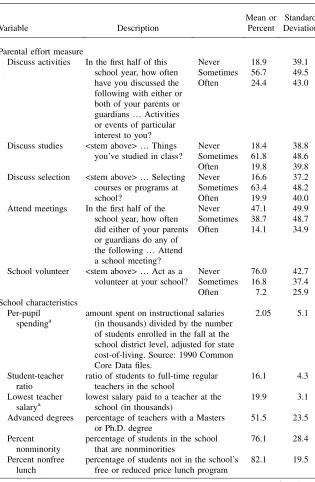
Table 1 provides definitions and descriptive statistics for parental effort, student achievement, school characteristics, and other variables used to estimate achieve-ment production functions and parental effort supply equations.4 We explore five variables from the tenth grade student survey that reflect parental effort (E): how frequently parents (1) discuss activities or events of particular interest to the child, (2) discuss things the child studied in class, (3) discuss selecting courses or pro-grams at school, (4) attend a school meeting, and (5) volunteer at the child’s school.5 The response categories for all five survey items are never, sometimes, or often. The first two variables have been used in the education literature as measures of home-based parent involvement in the education process (for example, Muller and Kerbow 1993). We prefer these two variables also, believing they are closest in spirit to the effort envisioned in our theoretical framework, and we call them (plus the third discuss measure) ‘‘dinnertime’’ measures of parental effort. In con-trast, we view ‘‘meetings’’ and ‘‘volunteer’’ as more ‘‘school-related’’ effort mea-sures because the child is farther removed. The latter three meamea-sures also may suffer from reverse causality, whereby poor school systems actively recruit parent volunteers and wealthy systems put on more events and hold more meetings and provide more course choices.
We use two approaches to represent school resources (S): (1) a summary meas-ure—per-pupil expenditures on instructional salaries, and (2) a set of five school characteristics—the student-teacher ratio, the lowest salary received by a teacher, the percentage of teachers with a master’s or a doctoral degree, the percentage of the student bodynotin the school’s subsidized lunch program, and the percent-age of nonminority students in the student body. Lowering the student-teacher ra-tio, raising teachers’ salaries, and increasing teachers’ credentials are often cited as ways to improve the quality of schools and the performance of students. A child’s school experience is also greatly influenced by the students with whom he or she associates. The latter two characteristics reflect the extent to which a child’s peers come from income constrained families (who in turn may provide fewer educa-tional opportunities).
4. Means and standard deviations are reported for continuous variables, while frequencies and relative frequencies are reported for dummy variables.
Table 1
Variable Definitions and Descriptive Statistics
Variable Description
Discuss activities In the first half of this school year, how often have you discussed the following with either or both of your parents or guardians.Activities
Discuss studies <stem above>.Things you’ve studied in class?
Never 18.4 38.8
Sometimes 61.8 48.6
Often 19.8 39.8
Discuss selection <stem above>.Selecting courses or programs at school?
Never 16.6 37.2
Sometimes 63.4 48.2
Often 19.9 40.0
Attend meetings In the first half of the school year, how often did either of your parents or guardians do any of the following.Attend a school meeting?
Never 47.1 49.9
Sometimes 38.7 48.7
Often 14.1 34.9
School volunteer <stem above>.Act as a volunteer at your school?
amount spent on instructional salaries (in thousands) divided by the number of students enrolled in the fall at the school district level, adjusted for state cost-of-living. Source: 1990 Common Core Data files.
2.05 5.1
Student-teacher ratio
ratio of students to full-time regular teachers in the school
16.1 4.3
Lowest teacher
salarya lowest salary paid to a teacher at theschool (in thousands) 19.9 3.1
Advanced degrees percentage of teachers with a Masters or Ph.D. degree
51.5 23.5
Percent nonminority
percentage of students in the school that are nonminorities
76.1 28.4
Percent nonfree lunch
percentage of students not in the school’s free or reduced price lunch program
82.1 19.5
Using five school characteristics in an achievement production function may be problematic, given the potential for multicollinearity and the loss of sample due to missing data, leading to possible attrition bias.6 In contrast, using per-pupil
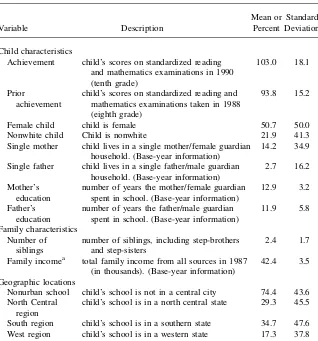
Table 1 (continued)
Variable Description
Achievement child’s scores on standardized reading and mathematics examinations in 1990 (tenth grade)
103.0 18.1
Prior
achievement
child’s scores on standardized reading and mathematics examinations taken in 1988 (eighth grade)
93.8 15.2
Female child child is female 50.7 50.0
Nonwhite child Child is nonwhite 21.9 41.3
Single mother child lives in a single mother/female guardian household. (Base-year information)
14.2 34.9
Single father child lives in a single father/male guardian household. (Base-year information)
2.7 16.2
Mother’s education
number of years the mother/female guardian spent in school. (Base-year information)
12.9 3.2
Father’s education
number of years the father/male guardian spent in school. (Base-year information)
11.9 5.8
Family characteristics Number of
siblings
number of siblings, including step-brothers and step-sisters
2.4 1.7
Family incomea total family income from all sources in 1987 (in thousands). (Base-year information)
42.4 3.5
Geographic locations
Nonurban school child’s school is not in a central city 74.4 43.6 North Central
region
child’s school is in a north central state 29.3 45.5
South region child’s school is in a southern state 34.7 47.6 West region child’s school is in a western state 17.3 37.8
Source: AuthorsÕcalculations using the National Education Longitudinal Study, 1988 and 1990. Notes: Means and standard deviations are reported for continuous variables, while frequencies and relative frequencies are reported for dummy variables.
a. All dollar figures are in thousands and adjusted for cost-of-living take into consideration variations across states. McMahon (1991) is the source of adjustment factors.
expenditures provides a summary measure of school resources and our largest sam-ple. Although it is an incomplete measure of school resources, we believe it is cor-related with the overall level of resources devoted to instruction at the school.7 In addition, many past studies use per-pupil expenditures, and a distinction is made between instructional and other expenditures (for example, Hanushek 1996). We utilize standardized math and reading test scores to capture student achieve-ment (A). The questions used to derive the scores are ‘‘consistent’’ across the eighth grade examination and tenth grade examination. Following the education production function literature, we estimate value-added achievement equations by including the eighth grade scores on the right-hand side; it captures past school and household inputs as well as the unobserved child/household endowment.8 There is no ‘‘consistent’’ measure of achievement prior to the eighth grade scores, which is what leads us to estimate effort and achievement equations for tenth graders.
The remaining explanatory variables include child and family characteristics that likely affect effort through preferences or resource constraints and affect achieve-ment as an input or a variable that affects the ability to coordinate production. In addition to past achievement, child characteristics include gender and race. Our set of family characteristics captures opportunity costs, preferences, and resources: parents’ education, the number of siblings, family income, and single parenthood. Finally, to control for other exogenous influences, we include a nonurban dummy variable, as well as regional dummy variables.
C. Sample Restrictions
In preparing the NELS data set for estimation, we restrict the sample to those with complete information for the relevant variables and to public school children. Of the 17,310 public school students that took the base-year exam, 1,775 students are dropped because they did not complete first follow-up examinations. Of the remaining 15,535 students, 5,153 students are dropped because they lacked infor-mation on child, parent, and household variables. We use the remaining 10,382 stu-dents to estimate various specifications of achievement and parental effort equations. To deal with missing values for individual parental effort and school resources variables without greatly compromising sample size, we use the maxi-mum number of observations for each regression and report its sample size.9
7. They are strongly correlated in our data. When these five school characteristics are regressed on per-pupil expenditure, the adjustedR-squared is 0.38.
8. While a value-added specification is common, it is not without its limitations (for example, see Hanushek and Taylor 1990; Todd and Wolpin 2003).
III. Findings
A. Student Achievement
Table 2 contains ordinary least squares estimates of the achievement production function excluding parental effort and five alternative specifications of parental ef-fort.10The first column of Table 2 contains a typical value-added education produc-tion funcproduc-tion. Consistent with the findings of the producproduc-tion funcproduc-tion literature, prior achievement, and parental education are positively related to achievement and the number of siblings is negatively related to achievement. Per-pupil expenditures are positively related to achievement.
With regard to parental effort, all three dinnertime parental effort measures are positively related to student achievement. Of the two school-related effort measures, only attending meetings has a positive and statistically significant relationship with student achievement. The estimated magnitudes of the effects are also meaningful. For instance, changing from ‘‘never’’ to ‘‘sometimes’’ discuss is estimated to in-crease achievement by more than four (six) additional years of education for the mother (father) or $1,000 in additional per-pupil expenditures. The positive impact of parental effort also grows with the intensity of effort; in other words, the estimated effect of ‘‘always’’ discuss is larger than ‘‘sometimes,’’ although the difference is not statistically significant. Adding parental effort to the production function does not substantially diminish other relationships, however. This suggests that our parental effort measures are bringing new, independent information to the production func-tion. At the same time, their omission does not seem to strongly bias the coefficients of the usual variables of interest, which is a reassuring result for researchers using data without such measures.
We also estimate the model using the school characteristics discussed above rather than our summary measure. (Results are available upon request.) None of the five school characteristics have a statistically significant relationship with student achievement, whether entered singly or together, although the signs are generally in the expected direction with the exception of the percent nonminority students. Nonetheless, the estimated effects of parental effort are very similar to those reported in Table 2.
Also in regressions not reported here, we allow the production relationship to be more complicated by including interactions between parental effort and school resources. In general, very few statistically significant coefficients emerge and those few that are significant almost always act to negate the primary (beneficial) effects. In the five expenditure regressions, for example, only one interaction term is signif-icant (discuss course selection sometimes) and its sign and magnitude acts to elim-inate the positive primary effects of effort and expenditures. This pattern is also evident in the five regressions that include the school characteristics except that even fewer coefficients are statistically significant.11Our analysis therefore provides little
10. Since there is more than one student per school, we adjust all standard errors for clustering at the school level throughout this article.
Table 2
Achievement Production Function with Alternative Measures of Parental Effort
Including Effort
Variables
Excluding Effort
Discuss Activities
Discuss Studies
Discuss Selection
Attend Meetings
School Volunteer
Intercept 4.339*** 4.158*** 4.082*** 3.820*** 4.805*** 4.711***
(3.24) (3.03) (2.93) (2.78) (3.51) (3.41)
Effort (sometimes) — 1.008*** 0.910*** 1.234*** 0.907*** 0.117
(—) (3.15) (2.67) (3.53) (3.09) (0.34)
Effort(often) — 1.491*** 1.058** 1.731*** 1.301*** 0.102
(—) (3.59) (2.56) (3.64) (3.75) (0.15)
Per2pupil spending 0.638** 0.675** 0.638** 0.663** 0.591* 0.631*
(2.02) (2.11) (1.98) (2.07) (1.85) (1.95)
Prior achievement 1.004*** 0.999*** 1.001*** 1.000*** 1.000*** 1.001***
(111.3) (106.2) (107.6) (106.8) (106.8) (105.9)
Female child 20.174 20.269 20.276 20.298 20.258 20.216
(20.7) (21.07) (21.10) (21.20) (21.01) (20.84)
The
Journal
of
Human
Single mother 1.407* 1.159 1.084 1.136 1.218 1.295*
(1.88) (1.54) (1.44) (1.50) (1.59) (1.69)
Single father 2.259 2.659 2.677 2.698 2.452 2.823*
(1.39) (1.59) (1.62) (1.63) (1.47) (1.70)
Mother’s education 0.192*** 0.202*** 0.206*** 0.203*** 0.192*** 0.212***
(3.59) (3.67) (3.77) (3.72) (3.53) (3.77)
Father’s education 0.184*** 0.157*** 0.156*** 0.157*** 0.159*** 0.164***
(3.74) (3.19) (3.19) (3.19) (3.18) (3.30)
Number of siblings 20.182** 20.161** 20.165** 20.156* 20.165** 20.186** (22.33) (22.03) (22.08) (21.95) (22.09) (22.35)
Family income 0.003 0.002 0.002 0.002 0.0011 0.0027
(0.67) (0.45) (0.55) (0.43) (0.27) (0.65)
Nonurban school 20.794** 20.896** 20.842** 20.903** 20.833** 20.833**
(22.17) (22.38) (22.23) (22.42) (22.22) (22.19)
Sample size 8,607 8,351 8,345 8,362 8,212 8,184
Source: AuthorsÕcalculations using the National Education Longitudinal Study (NELS).
Notes: Ordinary least squares coefficients. Statistical significant coefficients at the 1, 5, and 10 percent levels are indicated with ***, **, and *, respectively, andt-statistics are in parentheses. The underlying standard errors are adjusted for clustering at the school/classroom level, and Huber/White/sandwich standard errors are estimated. Three regional dummy variables were also included.
Houten
ville
and
Smith
Conway
evidence that a more complicated production relationship exists. Furthermore, if one does exist, the evidence points to effort and school characteristics being substitutes; in other words, the positive effect of school resources is diminished as the level of parental effort grows. In the context of our theoretical framework, this suggests that the ‘‘productivity effect’’ is either zero or negative, leading to an unambiguously negative effect of school resources on parental effort (@E=@So). We turn to our pa-rental effort regressions to explore this further.
B. Parental Effort
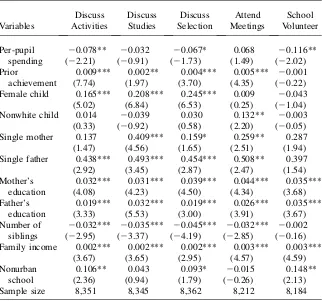
Table 3 contains ordered probit estimates of the parental effort equations for the five measures.12As in Table 2, there is substantial consistency in the results across the five measures. The signs of the coefficients, when statistically significant, are consis-tent across the five measures; for instance, mother’s education is positively associated with all five measures of parental effort. The differences that do exist suggest that volunteer and perhaps meetings are the most different from the rest, which confirms our priors about the similarities of our three dinnertime measures. Consistent with the findings of the time-allocation literature, mother’s and father’s education and family income is positively related to parental effort for all five measures. Number of siblings is negatively associated with parental effort (except for school volunteer), which may reflect parental time constraints. Interestingly, single parenthood is pos-itively related to parental effort—perhaps, like an additional sibling, being married represents a constraint on the time spent with a child.
With regard to the characteristics of the child, nonwhite status appears to have lit-tle association on parental effort, with one exception—it is positively associated with the frequency of attending meetings. Daughters receive significantly more dinner-time effort—a higher frequency of discussing activities, studies, and course selec-tion. Prior achievement, which is used in the achievement production function literature to capture past school and household inputs, is positively associated with parental effort (except for the school volunteer variable). This suggests that parental effort builds upon prior effort and inputs.
Do school resources diminish parental effort as suggested by theory and our achievement production results? Table 3 reports our results when using per-pupil expenditures, and estimates using school characteristics are available upon request. In both instances the coefficients on school resources, when statistically significant, overwhelmingly suggest a negative relationship with parental effort. Per-pupil expenditures have a negative and frequently statistically significant relationship with all three dinnertime measures and the volunteer variable. In the unreported school characteristic regressions, teacher salary diminishes all five parental effort measures and is statistically significant in all but course selection. Student/teacher ratio is also of the expected sign and occasionally significant in all three dinnertime measures. Two exceptions emerge from this exercise. First, the frequency of attending meetings decreases as class size grows (school resources decrease). This finding hints at our earlier concern that the number of meetings available to parents may be driven by school resources; the larger the class size, the less available the teachers may be
for parent meetings. Second, the peer-related measures of school resources do not affect parental effort the same way that school-related measures do. Rather, parental effort is either unaffected or increases as the economic circumstances of the child’s student body improves.
C. Issues of Endogeneity
Thus far, we have used descriptive regressions to explore the relationships among parental effort, school quality, and student achievement. However, our theoretical framework (as well as the entire time-allocation literature) suggests that such effort
Table 3
Parental Effort Equation using Alternative Measures of Parental Effort
Variables
0.009*** 0.002** 0.004*** 0.005*** 20.001
(7.74) (1.97) (3.70) (4.35) (20.22)
Female child 0.165*** 0.208*** 0.245*** 0.009 20.043
(5.02) (6.84) (6.53) (0.25) (21.04)
Nonwhite child 0.014 20.039 0.030 0.132** 20.003
(0.33) (20.92) (0.58) (2.20) (20.05)
Single mother 0.137 0.409*** 0.159* 0.259** 0.287
(1.47) (4.56) (1.65) (2.51) (1.94)
Single father 0.438*** 0.493*** 0.454*** 0.508** 0.397
(2.92) (3.45) (2.87) (2.47) (1.54)
Mother’s education
0.032*** 0.031*** 0.039*** 0.044*** 0.035***
(4.08) (4.23) (4.50) (4.34) (3.68)
Father’s education
0.019*** 0.032*** 0.019*** 0.026*** 0.035***
(3.33) (5.53) (3.00) (3.91) (3.67)
Number of siblings
20.032*** 20.035*** 20.045*** 20.032*** 20.002 (22.95) (23.37) (24.19) (22.85) (20.16) Family income 0.002*** 0.002*** 0.002*** 0.003*** 0.003***
(3.67) (3.65) (2.95) (4.57) (4.59)
Nonurban school
0.106** 0.043 0.093* 20.015 0.148**
(2.36) (0.94) (1.79) (20.26) (2.13)
Sample size 8,351 8,345 8,362 8,212 8,184
Source: AuthorsÕcalculations using the National Education Longitudinal Study (NELS).
is a matter of choice and is therefore potentially endogenous.13 As a robustness check, we estimate a two-stage process that treats parental effort as a choice, using predicted parental effort in the achievement equation. We use whether the family had rules on chores as an instrument for parental effort since they may capture how organized the household is with respect to time allocation and how involved parents are with their children in nonacademic matters. As such, they may be strongly cor-related with parental effort yet not with student achievement.14The effect of parental effort remains positive across all specifications and is always statistically significant except for whether the parents volunteer.
V. Concluding Remarks
This paper explores the theoretical and empirical role that parental effort plays in the production of student achievement. Our simple theoretical frame-work reveals that parental effort is affected by the level of school resources and, al-though the effect is theoretically ambiguous, it appears likely to be negative. This suggests that parents may either magnify or diminish the effects of improved school resources on student achievement. It also suggests that parental effort may not be well captured by simply including time-invariant variables such as parental charac-teristics or family fixed effects, as is the typical practice when estimating student achievement equations.
Our empirical analysis employs data from the NELS to shed light on these issues and also to answer the more basic question of ‘‘does parental effort improve student achievement?’’ The value-added, student-achievement production functions we esti-mate provide a resounding ‘‘yes’’; parental effort is consistently associated with higher levels of achievement. The magnitude of the effect of parental effort is also substantial—along the order of an additional four to six years of parental education or more than $1,000 in per-pupil spending. Our parental effort measures also bring new information to these models. Their inclusion has surprisingly little impact on the estimated effect of the usual family background characteristics (parental education and age, number of siblings, and income), and different types of parental effort (for example, dinnertime discussions versus volunteering) exert different impacts on achievement.
What factors are associated with parental effort, and do school resources play an important role? The parental effort equations we estimate reveal that, as expected, parental education and measures of time constraints (for example, number of chil-dren) are important, yet not all parental effort measures behave identically.
13. One could argue that school resources are potentially endogenous as well inasmuch that parents choose the schools their children attend via their residential location. In results available upon request, we also model per-pupil expenditures as endogenous, employing both school district and state demographic and policy (for example, choice) characteristics as instruments. The results are quite robust and, if anything, provide even stronger evidence that effort increases achievement (@A=@E.0) and that school resources diminish effort (@E=@S°,0).
Daughters, for example, appear to receive higher levels of dinnertime discussion but their parents are no more likely to volunteer or attend school meetings. Likewise, the role of school resources differs. The scenario that most closely matches our time-al-location model—dinnertime effort measures and school-specific resources—strongly suggests a negative relationship between the two. In contrast, as we move toward our other effort measures or to measures of the student body rather than the school, the relationship becomes less clear.
For researchers estimating student achievement equations, our results have mixed implications. Parental effort appears to have a strong effect on student achievement that is not adequately captured by the usual family background characteristics researchers include. There is also evidence that parents may react in such a way as to diminish the effect of school resources on achievement. Both results suggest that omitting parental effort from student achievement equations could cause a serious bias. Yet, we find no evidence of such bias—omitting parental effort appears to have little effect on our esti-mates of the effects of either family or school variables on student achievement.
While we attempt to deal with the possible endogeneity of both parental effort and school resources—and find little change in our results—satisfactorily modeling and identifying these relationships remains a challenge, requiring still richer data. The ideal data to study these questions also would contain more detailed parental effort information on much younger children over a long period of time. Nonetheless, our results strongly point to the potentially critical role that parental effort plays in the production of student achievement. Parental effort is important to consider both be-cause it is a relatively productive input and bebe-cause it has thepotentialto offset any increased financial support, although the crowd-out estimated for our data is incon-sequential. Both findings support the anecdotal evidence provided by Murnane and Levy (1996), in which schools that invested heavily in getting parents involved were the only ones to show improvement. Congress also recognized the importance of pa-rental effort when it passed the Goals 2000: Educate America Act by adding an eighth goal that ‘‘calls on schools to adopt policies and practices that actively engage parents and families in partnerships to support the academic work of children at home and shared educational decision-making at school’’ (p. 1, U.S. Department of Education 1998). Our research indicates that such an emphasis is a promising av-enue to improved student achievement.
References
Angrist, Joshua, and Victor Lavy. 1999. ‘‘Using Maimonides’ Rule to estimate the Effect
of Class Size on Scholastic Achievement.’’Quarterly Journal of Economics64(2):533–76.
Becker, Gary. 1965. ‘‘A Theory of the Allocation of Time.’’Economic Journal75(299):493–
517.
Becker, Gary, and Nigel Tomes. 1976. ‘‘Child Endowments and the Quantity and Quality of
Children.’’Journal of Political Economy84(4):S143–S162.
Ehrenberg, Ronald, and Dominic Brewer. 1994. ‘‘Do School and Teacher Characteristics
Matter? Evidence from High School and Beyond.’’Economics of Education Review
13(1):1–17.
Ferguson, Ronald, and Helen Ladd. 1996. ‘‘How and Why Money Matters: An Analysis
in Education,ed. Helen Ladd, 265–98. Washington, D.C.: The Brookings Institution Press.
Goldhaber, Dan, and Dominic Brewer. 1996. ‘‘Why Don’t Schools and Teachers Seem to
Matter? Assessing the Impact of Unobservables on Educational Productivity.’’Journal of
Human Resources32(3):505–21.
Hanushek, Eric. 1992. ‘‘The Trade-off between Child Quantity and Quality.’’Journal of
Political Economy100(1):84–117.
———. 1996. ‘‘School Resources and Student Performance.’’ InDoes Money Matter? The
Effect of School Resources on Student Achievement and Adult Success, ed. Gary Burtless, 43–73. Washington, D.C.: Brookings Institution Press.
Hanushek, Eric, John Kain, Jacob Markman, and Steven Rivkin. 2003. ‘‘Does Peer Ability
Affect Student Achievement?’’Journal of Applied Econometrics18(5):527–44.
Hanushek, Eric, and Lori Taylor. 1990. ‘‘Alternative Assessments of the Performance of
Schools—Measurement of State Variations in Achievement.’’Journal of Human Resources
25(2):179–201.
Hedges, Larry, and Rob Greenwald. 1996. ‘‘Have Times Changed? The Relationship between
School Resources and Student Performance.’’ InDoes Money Matter? The Effect of School
Resources on Student Achievement and Adult Success, ed. Gary Burtless, 74–92. Washington, D.C.: Brookings Institution Press.
Hill, Martha, and Frank Stafford. 1977. ‘‘Family Background and Lifetime Earnings.’’ InThe Distribution of Well-Being,ed. Thomas Juster, 511–55. Cambridge, Mass: NBER, Inc.
———. 1980. ‘‘Parental Care of Children: Time Diary Estimates of Quantity, Predictability,
and Variety.’’Journal of Human Resources15(2):219–39.
Hoxby, Caroline. 2000. ‘‘The Effects of Class Size and Composition on Student
Achievement: New Evidence from Natural Population Variation.’’Quarterly Journal of
Economics115(4):1239–85.
Kim, Hong-Kyun. 2001. ‘‘Is There a Crowding-Out Effect Between School Expenditure and
Mother’s Childcare Time?’’Economics of Education Review20(1):71–80.
Kooreman, Peter, and Arie Kapteyn. 1987. ‘‘A Disaggregated Analysis of the Allocation of
Time within the Household.’’Journal of Political Economy95(2):223–49.
Krueger, Alan. 1999. ‘‘Experimental Estimates of Education Production Functions.’’ Quarterly Journal of Economics64(2): 497–532.
Leibowitz, Arleen. 1974. ‘‘Education and Home Production.’’American Economic Review
64(2):243–50.
———. 1977. ‘‘Parental Inputs and Children’s Achievement.’’Journal of Human Resources
12(2):242–51.
McMahon, Walter. 1991. ‘‘Geographic Cost of Living Differences: An update.’’AREUEA
Journal19:426–50.
Muller, Chandra, and David Kerbow. 1993. ‘‘Parent Involvement in Home, School and
Community.’’ InParents, Their Children and Schools, eds. Barbara Schneider and James
Coleman, 13-42. Boulder, Colo.: Westview Press.
Murnane, Richard, Rebecca Maynard, and James Ohls. 1981 ‘‘Home Resources and
Children’s Achievement.’’Review of Economics and Statistics63(3):369–77.
Murnane, Richard, and Frank Levy. (1996). ‘‘Evidence from Fifteen Schools in Austin,
Texas.’’ in Burtless, Gary ed.Does Money Matter? The Effect of School Resources on
Student Achievement and Adult Success.Washington, D.C.: Brookings Institution Press.
Nechyba, Thomas. 2000. ‘‘Mobility, Targeting, and Private School Vouchers.’’American
Economic Review90(1):130–46.
Rivkin, Steven, Eric Hanushek, and John Kain. 2005. ‘‘Teachers, Schools, and Academic
Todd, Petra, and Kenneth Wolpin. 2003. ‘‘On the Specification and Estimation of the
Production Function for Cognitive Achievement.’’Economic Journal113: F3–F33.
U.S. Department of Education. National Center for Education Statistics. 1998.Parent
Involvement in Children’s Education: Efforts by Public Elementary Schools,(NCES 98– 032). Washington, D.C.: 1998.
Witte, John. 1996. ‘‘School Choice and Student Performance.’’ InHolding Schools