Child Health and School Enrollment
A Replication
Sudhanshu Handa
Amber Peterman
a b s t r a c t
This study uses longitudinal data from South Africa to estimate the relationship between early childhood nutritional status and schooling outcomes five years later. Preferred estimates from the full sample aged zero to five, which treat prior nutritional status as endogenous, show no impact of past nutritional status on current schooling, in contrast to a recent article in this journal using data from Pakistan. However, we find significant estimates for children who were malnourished, as well as among children younger than three years of age in the base year. These results suggest that the relationship between health and cognitive achievement is complex, and the effects may be sensitive to time between measurements and the timing of malnutrition itself.
I. Introduction
Infant and child health is an important policy issue in low-income countries because of the wide ranging impact that early childhood health is thought to have on the subsequent development potential of the individual.1As a result, sev-eral studies have attempted to estimate the relationship between early childhood nu-tritional status and schooling (Jamison 1986; Moock and Leslie 1986; Behrman and Lavy 1994; Glewwe, Jacoby, and King 2001). In a recent article in theJournal of Human Resources, Alderman, Behrman, Lavy, and Menon (2001) (henceforth ABLM) argue that much of this existing literature does not establish a causal relationship be-tween infant health and schooling because it fails to recognize and adequately con-trol for the fact that child health and schooling are both the result of human resource
Sudhanshu Handa is an associate professor of public policy at the University of North Carolina at Chapel Hill. Amber Peterman is a doctoral student in the department of public policy at the University of North Carolina at Chapel Hill. The data in this article can be obtained May 2008 through April 2011 from Sudhanshu Handa, Department of Public Policy, University of North Carolina, CB#3435, Chapel Hill, NC 27599-3435. Tel: 919.843.0350. shanda@email.unc.edu.
[Submitted February 2006; accepted November 2006]
ISSN 022-166X E-ISSN 1548-8004Ó2007 by the Board of Regents of the University of Wisconsin System
investment decisions by households. Moreover, ABLM argue that existing evidence on the relationship between child health and schooling is quite sensitive to the under-lying behavioral assumptions used to estimate the relationship. For example, esti-mates based on cross-sectional data that account for unobserved heterogeneity with respect to household and community variables lead to parameter estimates sig-nificantly lowerthan those that do not account for these variables (their so-called ‘‘naı¨ve’’ estimates). This suggests that the impact of child nutritional status on school-ing is muchsmallerthan otherwise believed (Behrman and Lavy 1998; Glewwe and Jacoby 1995). Unfortunately, cross-sectional studies must use current prices to iden-tify child health, and these are likely to be correlated with unobserved variables influ-encing both child health and schooling, thus rendering questionable the results based on these specifications.
Longitudinal data, on the other hand, permits the estimation of this relationship in a manner that is consistent with a dynamic model of human resource investment. Specifically, such data can be used to construct prior period price shocks to use as identifying instruments for early childhood health; these shocks are uncorrelated with subsequent period price shocks that influence schooling decisions in that (later) period, and thus permit consistent identification of the causal impact of child health on schooling. Using this preferred approach with longitudinal data from Pakistan, ABLM report that the relationship between child health and subsequent schooling is actually muchlarger than those implied by naı¨ve estimates that do not account for behavioral choices.2In addition, they show that alternative specifications which use current price levels as instruments, as is commonly used in the literature, lead to small and insignificant parameter estimates of the relationship between child nutri-tional status and schooling in their Pakistan data.
In this paper, we assess the stability of the results in ABLM by replicating their estimation strategy using longitudinal data on children from South Africa for the years 1993 and 1998. Specifically, we investigate: (1) whether the identification strat-egy proposed by ABLM results in a larger positive relationship between nutritional status and schooling relative to naı¨ve estimates as they report for Pakistan, and; (2) whether alternative (ad hoc) identification strategies that use current price levels as instruments (as is common in the cross-sectional literature) lead to smaller estimates of this relationship, as they also report for Pakistan. The data we have at hand, though longitudinal in nature and with adequate information to support the ABLM estima-tion strategy, is set up differently from that study. Specifically, ABLM report the im-pact of lagged height at age five on schooling two years later. Our data measure the height of a sample of children aged zero to five and schooling five years later, a dif-ference that is noteworthy for at least three reasons: (1) the five-year lag between measured health and schooling may weaken the estimated empirical relationship be-tween the two because of the increased possibility of catch-up growth; (2) the large age range in our sample relative to ABLM implies a larger variation in exposure to nutritional insults that might attenuate the estimated relationship between height and schooling if length of exposure to such insults is not adequately controlled,
2. Glewwe, Jacoby, and King (2001) use the same approach as ABLM with data from the Philippines and report similar results—an increase in the estimated impact of early childhood nutrition on child cognitive development.
and; (3) school enrollment in our sample is almost universal by age nine, thus mak-ing it difficult to estimate the relationship for older children in the panel. Because of these differences in the data, we investigate whether the preferred estimates of ABLM are robust to several alternative specifications and/or samples by: (1) limiting the sample to children under age three in 1993 based on the hypothesis that early child-hood nutritional status is the critical determinant of later life outcomes; and (2) es-timating the relationship at different parts of the height distribution.
A replication of ABLM is of value because of the significant difference in the ap-proach and results reported by that study relative to the previous literature. In addi-tion, the relationship between health and cognitive development is sufficiently complex (involving behavioral, environmental and biological influences) that it is important to assess whether results from Pakistan can be generalized to other parts of the world, and whether they are stable to small differences in study design. Finally, the data re-quirements to support the estimation strategy in ABLM are quite stringent, so that the existence of such data from another region presents a unique opportunity for researchers to learn about the relationship between early childhood nutrition and schooling.
II. Estimation strategy
ABLM’s paper presents the theoretical framework guiding their esti-mation strategy and we do not discuss it in detail here. Their empirical approach relates child nutritional status (H) in the previous time period (Period 1) to current schooling (in Period 2) and is framed around Equations 1 and 2 below, whereSiis schooling in periodi,His health,Ais assets or wealth,Eis child endowment,Tis a preference parameter, andUis a within-period shock:
S2¼a11P2+a12P+a13H1+a14A1+U2+E+T ð1Þ
H2¼a21P2+a22P+a23H1+a24A1+U2+E+T ð2Þ
In this framework, price shocks are defined as the deviation of current price levels (Pi) from long-run expected prices (P*) and are orthogonal across periods, unlike current prices which will contain a permanent long-run component. The parameter of interest isa13, the coefficient of previous period health status on current period
schooling, but sinceHwas determined in the previous period byEandT, naı¨ve esti-mates ofa13that ignore this will lead to biased estimates of this parameter. The
pre-ferred estimation strategy is an instrumental variables approach where H1 is first
estimated using contemporaneous price shocks (P1-P*) as identifying instruments
and thenS2is estimated usingHˆ1from the first stage. The empirical implementation
captures price shocks by including in the regression equation current prices (as mea-sured contemporaneously at the village level in the survey) and regional dummies to control for long-run differences in expected prices.
III. The Data
The data are a panel from the KwaZulu-Natal Income Dynamics Study (KIDS), a survey of approximately 1,550 households in the KwaZulu-Natal province of South Africa conducted in 1993 and 1998. The survey was commissioned by the South African Government as part of the effort to understand the dynamics of poverty and inequity of apartheid and the changes that took place after the abolish-ment of apartheid in 1994, and was jointly directed by the International Food Policy Research Institute, University of Wisconsin, and the University of Natal. The sample is a two-stage self-weighting design. In the first stage, clusters or villages were cho-sen proportional to population and percentage of the population ethnically African from census enumerator subdistricts, and in the second stage, all households in each chosen cluster were randomly selected on an interval which allowed on average 25 households or 125 individuals per village. See Carter et al. (2003) for further details on the survey methods and sample design.
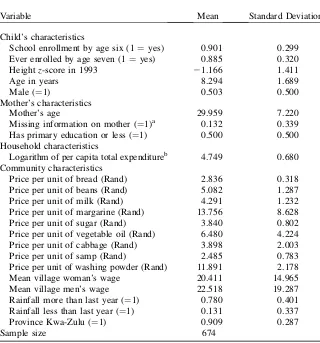
Following ABLM, we use height-for-agez-score to capture first-period child nu-tritional status and current enrollment for second period schooling outcome.3We also have repeated our analysis for an alternative schooling outcome, whether the child had ever been enrolled in school, and find similar results. We do not present these results here but they are available from the authors upon request. Table 1 presents summary statistics of the main variables from the 1998 round of the survey. Current school enrollment in 1998 is 90 percent and the percent ever enrolled by age seven is 88 percent. Meanz-score in 1993 is -1.16, with 25 percent of children moderately or severely malnourished (under minus two z-scores) and another 30 percent mildly malnourished (between minus one and minus two z-scores). Among malnourished children (under minus one z-score), mean per capita expenditure is significantly lower in 1993 (by 20 Rand) relative to other children, and mother’s education is also lower (57 percent with less than complete primary school among malnourished in comparison to 52 percent among other children). This suggests that adverse family background factors may affect both schooling and nutrition. Recall that the Pakistan data used in ABLM covers a two-year period from ages five to seven. In contrast, the South African data cover a much longer period and a wider age range of children (zero to five in 1993 and six to eleven in 1998). These differences in research design may influence the results and will be discussed below.
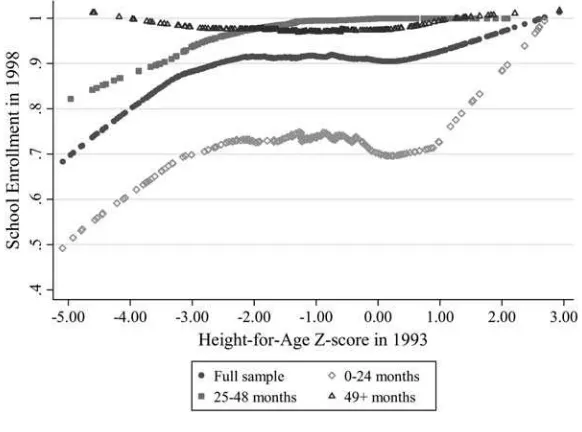
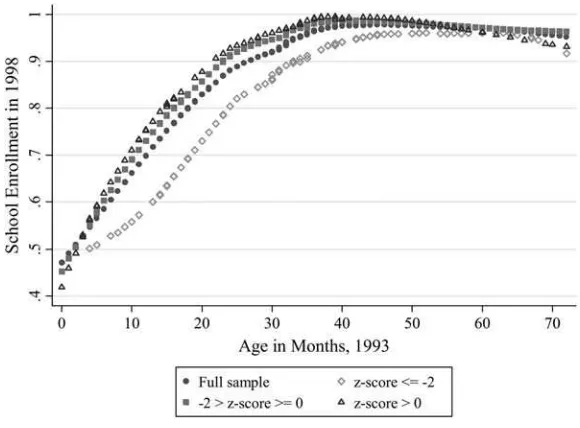
Figures 1 and 2 show the nonparametric relationships between past height-for-age and current enrollment by age (Figure 1), and age and current school enrollment by initial nutritional status (Figure 2). These relationships are estimated using local lin-ear regressions with a bandwidth of 0.8. The relationship between health and school enrollment (Figure 1) for the full sample appears to be strong at the extremes of the distribution of height but flat in the middle, with az-score of negative two appearing to be the critical cutoff at the lower end of the distribution. The empirical relationship is weakest for the oldest age group (49+ months) and strongest for the youngest age group. Figure 2 shows that by age 42 months in 1993 (eight and a half years of age in 1998) school enrollment is virtually universal except for children who were severely
3. Following the recommendation of WHO (1995), we exclude observations of children with height-for-agez-scores less than fivez-scores below and greater than threez-scores above the sample mean.
malnourished in 1993 (minus twoz-scores and under). These graphs suggest that the relationship between health and schooling might differ along the age and (lagged) height distributions.
IV. Results
A. First-stage regressions
For both our first and second stage regressions, we try to mimic the specifications presented in ABLM as much as possible to ensure that any differences we find are
Table 1
Summary Statistics for Principal Variables used in Estimation
Variable Mean Standard Deviation
Child’s characteristics
School enrollment by age six (1¼yes) 0.901 0.299
Ever enrolled by age seven (1¼yes) 0.885 0.320
Heightz-score in 1993 21.166 1.411
Age in years 8.294 1.689
Male (¼1) 0.503 0.500
Mother’s characteristics
Mother’s age 29.959 7.220
Missing information on mother (¼1)a 0.132 0.339
Has primary education or less (¼1) 0.500 0.500
Household characteristics
Logarithm of per capita total expenditureb 4.749 0.680
Community characteristics
Price per unit of bread (Rand) 2.836 0.318
Price per unit of beans (Rand) 5.082 1.287
Price per unit of milk (Rand) 4.291 1.232
Price per unit of margarine (Rand) 13.756 8.628
Price per unit of sugar (Rand) 3.840 0.802
Price per unit of vegetable oil (Rand) 6.480 4.224
Price per unit of cabbage (Rand) 3.898 2.003
Price per unit of samp (Rand) 2.485 0.783
Price per unit of washing powder (Rand) 11.891 2.178
Mean village woman’s wage 20.411 14.965
Mean village men’s wage 22.518 19.287
Rainfall more than last year (¼1) 0.780 0.401
Rainfall less than last year (¼1) 0.131 0.337
Province Kwa-Zulu (¼1) 0.909 0.287
Sample size 674
a. Missing if the child was orphaned, abandoned, not living with the biological mother.
b. All expenditure and prices are deflated to 1993 Rand. All variables are from 1998 unless stated otherwise.
not simply due to functional form. That study uses three key prices and their inter-actions with mother’s schooling and child sex as the identifying instruments. We es-timate the first-stage regressions, predicting height-for-agez-scores in 1993, via OLS and report them in Table 2. Column 1 uses three key prices (bread, maize, and for-mula) and their interactions for identification, and is thus most similar to the first-stage regression in ABLM. As can be seen from theF-statistics at the bottom of that column, these three prices are not jointly significant in the regression, nor are the price/sex interactions. Clearly, this set of instruments is too weak to provide suffi-cient identification of the relationship we are investigating. Consequently, Column 2 expands the instrument set to include 12 commodity prices (plus rainfall) and inter-actions. The set of 12 prices is now jointly significant but the price/sex interactions continue to be insignificant so we exclude this set of interactions from our final spec-ification, which we show in Column 3 of Table 2. This specification has anR-squared of 15 percent.4
B. School enrollment regressions
The school outcomes are binary and are estimated with a probit. We follow ABLM and use the method suggested by Murphy and Topel (1985) to correct the standard
Figure 1
Lowess Estimates of Enrollment and Height-for-AgeZ-score by Age
4. Our results are not sensitive to variations in the instrument set reported in Column 3 of Table 2 which (1) exclude the price/education interactions; (2) exclude the rainfall variables. Both these reduced set of instru-ments have sufficient power to identify height (details available from the authors).
errors to account for the fact that lagged height is a predicted regressor. As in ABLM, we use contemporaneous prices in 1998 and a regional dummy (Kwa-Zulu region) to capture price shocks, and these are jointly significant in the schooling regressions.
1. Base results
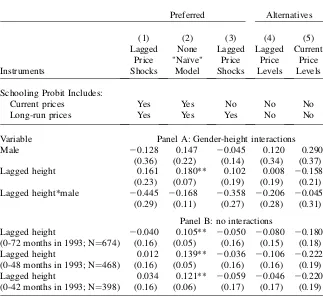
The top panel of Table 3 is similar to that reported in ABLM and presents the coef-ficient (and standard error) estimates for the height variable from the schooling probit along with the interaction of height and gender (male¼1). ABLM find significant dif-ferences by gender in the impact of lagged height on current schooling, as is typically found in Southeast Asian human resource outcomes (Rahman and Da Vanzo 1993; Hill and Upchurch 1995; Leone, Matthews, and Della Zuanna 2003), but this result does not hold in the South African data. Neither the gender dummy nor the height/ gender interaction is statistically significant in Table 3, a result consistent with the literature on gender differentials in human resource outcomes in sub-Saharan Africa (Svedburg 1990; Svedberg 1996). Given these results, we drop the height/gender interactions in subsequent analyses and focus solely on the impact of lagged height on current school enrollment.
The first row of Panel B in Table 3 presents our replication of ABLM using the full sample of children in the KIDS data. The naı¨ve specification in Column 2, which assumes that past height is not a choice variable and treats it as exogenous, show a positive and significant impact of lagged height on school enrollment. However, results based on the preferred estimation strategy (Column 1), which use price shocks
Figure 2
Lowess Estimates of Enrollment and Age in Months by Height-for-AgeZ-score
Table 2
First-stage Regressions for Height-for-Age Z-score in 1993 (N¼674)
Coefficient Standard Error Coefficient Standard Error Coefficient Standard Error
Child characteristics 0–6 months (omitted)
6–12 months in 1993 (¼1) 20.003 (0.31) 20.051 (0.30) 20.013 (0.29)
12–24 months in 1993 (¼1) 20.963 (0.29) 20.941 (0.29) 20.923 (0.28)
24–48 months in 1993 (¼1) 20.702 (0.22) 20.716 (0.21) 20.677 (0.22)
48–72 months in 1993 (¼1) 20.631 (0.23) 20.660 (0.22) 20.636 (0.22)
Male (¼1) 21.093 (1.12) 22.614 (2.02) 20.053 (0.12)
Mother’s characteristics
Mother’s age 20.014 (0.05) 20.022 (0.06) 20.023 (0.05)
Mother’s age squared (x 100) 0.000 (0.00) 0.000 (0.00) 0.000 (0.00)
Missing information on mother (¼1) 20.050 (0.22) 20.004 (0.22) 20.042 (0.22) Has primary education
or less (¼1)
20.253 (1.27) 0.766 (2.48) 0.458 (2.44)
Household characteristics
Logarithm of per capita total expenditure 0.402 (0.14) 0.404 (0.15) 0.400 (0.15)
Community characteristics
Price per unit formula (Rand) 20.014 (0.02) 0.010 (0.03) 20.005 (0.02)
Price per unit milk (Rand) 0.097 (0.17) 0.265 (0.14)
Price per unit rice (Rand) 0.162 (0.26) 0.229 (0.21)
Price per unit cereal (Rand) 0.031 (0.06) 0.059 (0.05)
Price per unit apple (Rand) 0.257 (0.27) 0.083 (0.23)
Price per unit flour (Rand) 21.630 (0.45) 21.502 (0.42)
Price per unit bread (Rand) 0.399 (0.35) 1.046 (0.52) 0.885 (0.44)
Price per unit sugar (Rand) 0.554 (0.32) 0.338 (0.25)
Price per unit eggs (Rand) 0.146 (0.13) 0.214 (0.09)
Price per unit soap (Rand) 20.256 (0.15) 20.185 (0.11)
870
The
Journal
of
Human
Price per unit maize (Rand) 20.012 (0.37) 0.368 (0.34) 0.729 (0.26)
Price per unit chicken (Rand) 20.078 (0.05) 20.095 (0.04)
Rainfall more than last year (¼1) 0.201 (0.55) 0.135 (0.52)
Rainfall less than last year (¼1) 20.031 (0.32) 20.099 (0.31)
Missing observations on Rainfall (¼1) 20.800 (0.28) 20.750 (0.23)
Mother’s education * price of formula 0.004 (0.03) 20.030 (0.02) 20.025 (0.02)
Mother’s education * price of milk 0.036 (0.14) 0.042 (0.14)
Mother’s education * price of rice 20.014 (0.27) 20.006 (0.26)
Mother’s education * price of cereal 20.060 (0.03) 20.063 (0.03)
Mother’s education * price of apples 20.041 (0.19) 0.003 (0.18)
Mother’s education * price of flour 0.151 (0.08) 0.147 (0.08)
Mother’s education * price of bread 0.047 (0.28) 0.254 (0.34) 0.264 (0.35)
Mother’s education * price of sugar 20.427 (0.29) 20.332 (0.31)
Mother’s education * price of eggs 20.075 (0.14) 20.089 (0.13)
Mother’s education * price of soap 0.140 (0.17) 0.133 (0.16)
Mother’s education * price of maize 20.017 (0.39) 20.229 (0.39) 20.276 (0.37)
Mother’s education * price of chicken 0.108 (0.04) 0.106 (0.04)
Significance of price coefficients (p-value) 0.61 (0.61) 9.26 (0.00) 15.64 (0.00) Significance of price * education coefficients
(p-value)
0.02 (0.99) 4.64 (0.00) 4.61 (0.00)
Significance of price * male coefficients (p-value)
0.97 (0.42) 1.66 (0.10)
Note: District dummy variables included but not reported. Price-gender interactions included in Columns 1 and 2 but not reported.R-squared for the regressions are about 0.15. The degrees of freedom for theF-statistics are (3, 52) in Column 1 and (12, 52) in Columns 2 and 3. Handa
and
Peterman
as identifying instruments, show no statistically significant relationship between the two outcomes of interest. This is in sharp contrast to the results reported in ABLM where the preferred estimates deliver a much stronger and statistically significant im-pact of past health on schooling. The alternative estimates in Table 3 are the same as those presented in ABLM and consist of the following: Column 3 excludes current prices from the schooling regression; Column 4 excludes all prices from the schooling regression and uses lagged price levels to identify prior health status; and Column 5 excludes all prices from the schooling equation and uses current price levels to iden-tify past health. These results show no relationship between health and schooling and are consistent with the results in ABLM and the previous literature, which uses these ad hoc identifying strategies. However, in the South African case, these alterna-tive ad hoc specifications actually do quite well in reproducing the preferred estimates in Column 1, which also show no relationship between health and schooling.
Table 3
Estimated Effect of Lagged Height on School Enrollment
Preferred Alternatives
Current prices Yes Yes No No No
Long-run prices Yes Yes Yes No No
Variable Panel A: Gender-height interactions
Lagged height 20.040 0.105** 20.050 20.080 20.180
(0-72 months in 1993; N¼674) (0.16) (0.05) (0.16) (0.15) (0.18)
Lagged height 0.012 0.139** 20.036 20.106 20.222
(0-48 months in 1993; N¼468) (0.16) (0.05) (0.16) (0.16) (0.19)
Lagged height 0.034 0.121** 20.059 20.046 20.220
(0-42 months in 1993; N¼398) (0.16) (0.06) (0.17) (0.17) (0.19)
Note: Probit coefficient estimates of lagged height variable with standard errors in parenthesis. * denotes significance at the 10 percent level ** denotes significance at 5 percent or better.
Figure 2 indicates that school enrollment is nearly universal for older children in our sample, a problem that ABLM do not have since their school enrollment sample is limited to children age seven. To make our school enrollment samples more com-parable to their study we present estimates in Table 3 based on samples that exclude the oldest children (age greater than eight and a half years, and age greater than nine years) from the schooling equation. These results, shown in the last two rows of Table 3, are identical to the full sample results; the naı¨ve estimates in Column 2 in-dicate a strong positive impact of earlier nutritional status on schooling while the pre-ferred estimates do not.
2. Extensions
We mentioned earlier that an important difference between the South African and Pakistani data sets is that the latter use height measured at a specific age (five years) while the former contain children between zero and five years. There tends to be a distinct relationship between stunting and age in low-income countries, with a steady increase in stunting from birth to just after the weaning period (24–36 months) and then flattening out. This pattern also exists in the South African data as shown by the age coefficients in the height regression in Table 2. Thus in the South African data the exposure to infection and other nutritional insults (the ‘‘treatment’’), and subse-quent nutritional status, varies widely among the sample relative to the Pakistani sample, which may confound the results of our replication exercise.5Moreover, some researchers have argued that the timing of early childhood nutritional status is impor-tant, and that it is nutritional status around age two that is the crucial predictor of subsequent cognitive development (Waber et al. 1981; Glewwe, Jacoby, and King 2001). A further difference in research design is the time lag between surveys—only two years in Pakistan compared to five years in South Africa. Poor health may affect immediate schooling outcomes, but the possibility of catch-up growth and/or sus-tained compensating behavior by parents could mitigate the adverse effects of poor health in the medium term, leading to a weaker estimated relationship between health and schooling as we report in Table 3.6
To address these possible explanations for the difference in results from those of ABLM, we repeat the estimation procedure using subsamples of children at younger age levels (younger than three years in 1993). This allows us both to control for the length of exposure to possible repeated nutritional insults as well as to test the hy-pothesis, advanced by Glewwe, Jacoby, and King (2001) and others that the timing of malnutrition matters for subsequent cognitive development. We also report esti-mates for children at different portions of the height distribution; recall that Figures 1 and 2 suggest that the health-schooling relationship appears to be stronger at lower levels of malnutrition. This approach also allows us to control for the intensity of the
5. The mean height-for-agez-score in the Pakistani sample used by ABLM is -1.86 compared to -1.16 in our data.
6. For example, Adair (1999) presents evidence that Filipino children do exhibit significant catch-up growth in the preadolescent years.
‘‘treatment,’’ which may be driving some of the differences between our results and those of ABLM.
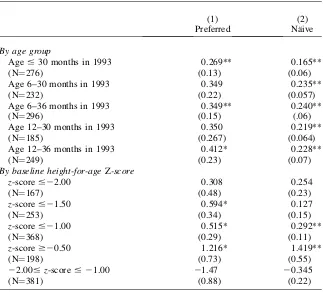
The top panel of Table 4 displays results based on several subsamples of children under age three.7The naı¨ve estimates in Column 2 deliver a positive and statistically significant coefficient for lagged height in each of these subsamples, and an even stron-ger relationship in Column 1 using the preferred estimation strategy. The probit coef-ficient now increase by 63 percent (to 0.269) for the zero to 30-month age group and by 45 percent (to 0.349) for the six- to 36-month age group; similar increases occur for the other age groups but the sample sizes are not big enough to render precise IV point estimates. These results are now consistent with the pattern of estimates reported in ABLM, suggesting that differences in research design may be responsible for the di-vergence in the full sample South African results and those reported in ABLM.
The bottom panel of Table 4 reports estimates for subsamples based on initial heightz-score. For children at the lower end of the distribution (minus onez-score and under), the pattern of estimates mimics those in the top panel of the table and those of ABLM. Specifically, the preferred estimates show larger positive point esti-mates of the impact of lagged height on subsequent schooling relative to the naı¨ve estimates, although the standard errors are somewhat larger and tend only to be sig-nificant at the 10 percent level if at all. At the middle of the distribution (z-score be-tween zero and minus two), the relationship bebe-tween lagged height and enrollment is negative and not significant. This reflects the nonparametric results in Figure 1. Meanwhile, at the upper end of the distribution (z-score greater than or equal to mi-nus half az-score), the relationship between infant health and subsequent schooling is an order of magnitude greater than the relationship in the full sample and in the lower table, though the preferred estimate (1.216) is slightly lower than the naive one (1.419) in Column 2.8
Though not reported in Table 4, we estimated the alternative specifications de-scribed in Columns 3 to 5 of Table 3 on the subsamples shown in Table 4. The ad hoc specifications of Column 4 and 5 all performed poorly in relationship to the pre-ferred estimates for these subsamples as to be expected a priori. On the other hand, the estimates that exclude current prices from the schooling regression (correspond-ing to Column 3 in Table 3) displayed much lower point estimates for lagged height relative to those in Column 1 of Table 4. This specification includes only long-run prices in the schooling regression, which in our case is a provincial dummy. When we use district dummies instead of the provincial dummy to capture long-run prices in the schooling equation the point estimates (and significance levels) are in line with those reported in Column 1 of Table 4,9leading us to conclude that once current pri-ces (measured at the village level) are excluded, the lone provincial dummy is not strong enough to fully capture long-run prices in the schooling equation.
7. First-stage regression results for all subsample estimates reported in Tables 3 and 4 are available from the authors.
8. Cutting the sample at az-score of zero or above is a better reflection of the data in figure 1, but this leaves a sample of 126 and the two-stage parameters cannot be estimated.
9. For example, in the six-to 36-month age group, this specification delivers a coefficient of 0.360 for lagged height and a standard error of 0.13, which is very similar to the estimate for this age group reported in Column 1 of Table 4.
V. Conclusions
Previous estimates of the relationship between child health and schooling have varied widely depending on the behavioral assumptions imposed on households. ABLM argue that some of these estimates are based on questionable identification assumptions that are not consistent with economic theories of house-hold decision-making. Using panel data from Pakistan they show that theoretically consistent estimation of this relationship leads tostrongereffects of health on school-ing than previously reported. The present article replicates the estimation strategy of ABLM using panel data from South Africa to see if in these data, the preferred ap-proach of ABLM also leads to stronger effects of health on schooling than that im-plied by theoretically less desirable approaches.
Our results from the full sample of South African children using the preferred ap-proach do not support the results from ABLM, and indicate no relationship between
Table 4
Estimated Effect of Lagged Height on School Enrollment by Sample
(1) Preferred
(2) Na¨ive
By age group
Age#30 months in 1993 0.269** 0.165**
(N¼276) (0.13) (0.06)
Age 6–30 months in 1993 0.349 0.235**
(N¼232) (0.22) (0.057)
Age 6–36 months in 1993 0.349** 0.240**
(N¼296) (0.15) (.06)
Age 12–30 months in 1993 0.350 0.219**
(N¼185) (0.267) (0.064)
Age 12–36 months in 1993 0.412* 0.228**
(N¼249) (0.23) (0.07)
By baseline height-for-ageZ-score
z-score#22.00 0.308 0.254
(N¼167) (0.48) (0.23)
z-score#21.50 0.594* 0.127
(N¼253) (0.34) (0.15)
z-score#21.00 0.515* 0.292**
(N¼368) (0.29) (0.11)
z-score$20.50 1.216* 1.419**
(N¼198) (0.73) (0.55)
22.00#z-score#21.00 21.47 20.345
(N¼381) (0.88) (0.22)
Note: The preferred estimator instruments lagged height with previous price shocks and includes current and long-run prices in the schooling regression. The naı¨ve estimator does not treat lagged height as endogenous.
past height and current schooling. This may be due to differences in research design. The ABLM study measures past height at a specific point in time (age five) and schooling two years later. The South African data contains data on children ranging from age zero to five and measures schooling five years later. These differences could affect the stability of the results because the impact of malnutrition on schooling may diminish over time, and because the pattern of malnutrition is highly correlated with age and thus varies more widely in the South African sample relative to the sample used by ABLM (due to different length of exposure to adverse health shocks). We attempt to control for these differences in design by restricting our sample to the mal-nourished only, and to those children who were under three years old in the base pe-riod. In these subsamples, our estimates are consistent with those reported in ABLM, and show stronger (and statistically significant in the case of younger age groups) effects of nutrition on schooling that those implied by a naı¨ve approach.
The long term effects of child health on cognitive development are determined by the complex interaction of biology, behavior and environment. Estimates of this re-lationship using prospective field surveys may vary widely, even when household be-havior is accounted for in a theoretically consistent way, due to subtle differences in research design and sample composition. Research in this area must pay close atten-tion to these details when specifying empirical relaatten-tionships, interpreting coeffi-cients, and generalizing results to other demographic groups and regions.
Table A1
School Enrollment Probits (full sample N¼674)
Preferred Alternatives
(1) (2) (3) (4) (5)
Constant 23.8 (3.4) 24.7 (3.2) 25.0 (2.8) 25.1 (2.9) 24.7 (2.8)
Predicted height z-score in 1993
20.040 (0.16) 0.105 (0.04) 20.050 (0.16) 20.080 (0.15) 20.180 (0.18)
Age in years 1.94 (0.50) 2.09 (0.44) 1.70 (0.50) 1.59 (0.52) 1.46 (0.50)
Age in years squared 20.084 (0.03) 20.093 (0.03) 20.072 (0.03) 20.066 (0.03) 20.058 (0.03)
Male (¼1) 0.36 (0.17) 0.37 (0.17) 0.35 (0.17) 0.34 (0.17) 0.34 (0.17)
Mother’s age 20.216 (0.07) 20.213 (0.07) 20.215 (0.07) 20.204 (0.07) 20.205 (0.07) Mother’s age squared
(x 100)
0.0036 (0.00) 0.0036 (0.00) 0.0035 (0.00) 0.0033 (0.00) 0.0033 (0.00)
Missing information on mother’s variables (¼1)
20.16 (0.27) 20.12 (0.26) 20.16 (0.26) 20.14 (0.26) 20.14 (0.25)
Mother has primary education or less (¼1)
20.21 (0.18) 20.19 (0.18) 20.22 (0.17) 20.21 (0.18) 20.23 (0.18)
Logarithm of per capita total expenditurea
0.17 (0.16) 0.16 (0.16) 0.22 (0.18) 0.23 (0.18) 0.24 (0.17)
Price per unit of bread (Rand)
20.16 (0.35) 20.12 (0.35)
Price per unit of beans (Rand)
20.20 (0.12) 20.19 (0.12)
Price per unit of milk (Rand)
0.099 (0.06) 0.093 (0.06)
(continued)
Handa
and
Peterman
Table A1(continued)
Preferred Alternatives
(1) (2) (3) (4) (5)
Price per unit of margarine (Rand)
0.014 (0.01) 0.018 (0.01)
Price per unit of sugar (Rand)
0.01 (0.20) 0.06 (0.19)
Price per unit of vegetable oil (Rand)
0.020 (0.02) 0.021 (0.02)
Price per unit of cabbage (Rand)
20.200 (0.06) 20.208 (0.06)
Price per unit of samp (Rand)
20.082 (0.09) 20.048 (0.09)
Price per unit of washing powder (Rand)
20.054 (0.05) 20.050 (0.05)
Mean cluster woman’s wage
0.004 (0.02) 0.002 (0.02)
Mean cluster men’s wage 20.005 (0.01) 20.006 (0.01) Rainfall more than as
last year (¼1)
0.41 (0.45) 0.37 (0.45)
Rainfall less than last year (¼1)
0.41 (0.47) 0.44 (0.47)
Province Kwa-Zulu (¼1) 20.43 (0.32) 20.33 (0.29) 20.36 (0.32)
Note: Probit coefficient estimates of lagged height variable with standard errors in parenthesis. a. All expenditure and prices are deflated to 1993 Rand.
878
The
Journal
of
Human
References
Adair, Linda. 1999. ‘‘Filipino Children Exhibit Catch-up Growth from Age 2 to 12 Years.’’
Journal of Nutrition129(6):1140–48.
Alderman, Harold, Jere R. Behrman, Victor Levy, and Rekha Menon. 2001. ‘‘Child Health and School Enrollment: A Longitudinal Analysis.’’The Journal of Human Resources
36(1):185–205.
Behrman, Jere R. 1996. ‘‘The Impact of Health and Nutrition on Education.’’The World Bank Research Observer11(1):23–37.
Behrman, Jere R., and Victory Lavy. 1998. ‘‘Child Health and Schooling Achievement: Association, Causality and Household Allocations.’’ University of Pennsylvania Center for Analytic Research and Economics in the Social Sciences: CARESS Working Papers number 97–23.
———. 1994. ‘‘Children’s Health and Achievement in School.’’ LSMS Working Paper 104. Washington, D.C.: World Bank.
Carter, Michael R., and Julian May. 2001. ‘‘One Kind of Freedom: Poverty Dynamics in Post-apartheid South Africa.’’World Development29(12):1987–2006.
Carter, Michael R., Lawrence Haddad, Julian May, and John A. Maluccio. 2003. ‘‘KwaZulu-Natal Income Dynamics Study (KIDS) 1993–1998, Overview and Description of Data Files.’’ International Food Policy Research Institute, University of Natal-Durban and University of Wisconsin-Madison.
Glewwe, Paul, and Hanan Jacoby. 1995. ‘‘An Economic Analysis of Delayed Primary School Enrollment and Childhood Malnutrition in a Low Income Country.’’Review of Economics and Statistics77(1):156–69.
Glewwe, Paul, Hanan Jacoby, and E. King. 2001. ‘‘Early Childhood Nutrition and Academic Achievement: A Longitudinal Analysis.’’Journal of Public Economics81(3):345–68. ———. 2001. ‘‘The Impact of Early Childhood Nutritional Status on Cognitive
Development: Does Timing of Malnutrition Matter?’’World Bank Economic Review
15(1):81–113.
Hardin, James W. 2002. ‘‘The Robust Variance Estimator for Two-step Models.’’The Stata Journal2(3):253–66.
Hill, Kenneth and Dawn M. Upchurch. 1995. ‘‘Gender Differences in Child Health: Evidence from the Demographic and Health Surveys.’’Population and Development Review
21(1):127–51.
Jamison, Dean T. 1986. ‘‘Child Malnutrition and School Performance in China.’’Journal of Development Economics20(2):299–310.
Leone, Tiziana, Zoe Matthews, and Gianpiero Della Zuanna. 2003. ‘‘Impact and Determinants of Sex Preference in Nepal.’’International Family Planning Perspectives
29(2):69–75.
Moock, Peter R., and Joanne Leslie. 1986. ‘‘Childhood Malnutrition and Schooling in the Terai Region of Nepal.’’Journal of Development Economics20(1):33–52.
Murphy K. M., and R. H. Topel. 1985. ‘‘Estimation and inference in two-step econometric models.’’Journal of Business and Economic Statistics3(4):370–79.
Rahman, Mizanur, and Julie Da Vanzo. 1993. ‘‘Gender Preference and Birth Spacing in Matlab, Bangladesh.’’Demography30(3):315–32.
Rivers, D., and Q. Vuong. 1988. ‘‘Limited Information Estimators and Exogeneity Tests for Simultaneous Probit Models.’’Journal of Econometrics39(1988):347–66.
Strauss, John, and Duncan Thomas. 1995. ‘‘Human Resources: Empirical Modeling of Household and Family Decisions.’’ InHandbook of Development Economics, ed. T.N. Srinivasan and Jere Behrman. Vol 3A, Amsterdam: North-Holland.
Svedburg, Peter. 1996. ‘‘Gender Biases in Sub-Saharan Africa: Reply and Further Evidence.’’
The Journal of Development Studies32(6):933–43.
———. 1990. ‘‘Undernutrition in Sub-Saharan Africa: Is There a Gender Bias?’’The Journal of Development Studies6(3):469–86.
Thomas, Duncan, J. Strauss, and M-H Henriques. 1991. ‘‘How Does Mother’s Education Affect Child Height?’’Journal of Human Resources26(2):183–211.
Waber, D.P., L. Vuori-Christiansen, N. Ortiz, J.R. Clement, N.E. Christiansen, J.O. Mora, R.B. Reed, and M.G. Herrera. 1981. ‘‘Nutritional Supplementation, Maternal Education and Cognitive Development of Infants at Risk of Malnutrition.’’American Journal of Clinical Nutrition34:807–13.
WHO (World Health Organization) 1995. ‘‘Physical Status: The Use and Interpretation of Anthropometry.’’ WHO Technical Report Series No. 854. Geneva.
Zemel, Babette S., Elizabeth M. Riley, and Virginia A Stallings. 1997. ‘‘Evaluation of Methodology for Nutritional Assessment in Children: Anthropometry, Body Composition and Energy Expenditure.’’Annual Review of Nutrition17:211–35.