Full Terms & Conditions of access and use can be found at
http://www.tandfonline.com/action/journalInformation?journalCode=vjeb20
Download by: [Universitas Maritim Raja Ali Haji], [UNIVERSITAS MARITIM RAJA ALI HAJI
TANJUNGPINANG, KEPULAUAN RIAU] Date: 13 January 2016, At: 17:50
Journal of Education for Business
ISSN: 0883-2323 (Print) 1940-3356 (Online) Journal homepage: http://www.tandfonline.com/loi/vjeb20
Peer Evaluation in the Classroom: A Check for Sex
and Race/Ethnicity Effects
Jai Ghorpade & James R. Lackritz
To cite this article: Jai Ghorpade & James R. Lackritz (2001) Peer Evaluation in the Classroom: A Check for Sex and Race/Ethnicity Effects, Journal of Education for Business, 76:5, 274-281, DOI: 10.1080/08832320109599648
To link to this article: http://dx.doi.org/10.1080/08832320109599648
Published online: 31 Mar 2010.
Submit your article to this journal
Article views: 22
View related articles
Peer Evaluation in the Classroom:
A
Check for Sex and
Race/Ethnicity Effects
JAI GHORPADE
JAMES R. LACKRITZ
zyxwvutsrqponmlkjihgfedcbaZYXWVUTSRQPONMLKJIHGFEDCBA
San Diego State University
San Diego, California
raditionally, college students’ per-
T
formance in the classroom has been assessed unilaterally by profes- sors. In recent years, however, there has been a move to include students in the appraisal process, as raters of their own and their peers’ performance. This move has been driven by the expectation thatit would provide more complete infor- mation on student performance and improve the process generally (Hender-
son, Rada,
zyxwvutsrqponmlkjihgfedcbaZYXWVUTSRQPONMLKJIHGFEDCBA
& Chen, 1998; Johnson &Smith, 1997). The scope of such involvement is extensive, with students being asked to participate in appraisal and learning facilitation activities involving a wide range of student per- formance dimensions. These areas include enhancement of writing perfor- mance of students in general (Topping, 1998) and of students with learning dis- abilities (Ammer, 1998), grading of term papers (Haaga, 1993), selection of candidates for Best Student Awards (Khoon, Abd-Shukor, Deraman, & Oth- man, 1994), and assessment of peer ability (Norton, 1992). So pervasive is this practice that one study has found that peer evaluations may replace some or all of the grading traditionally done by professors (Henderson, Rada, &
Chen, 1998).
The move to include students in this evaluation process inevitably raises questions about students’ ability to per-
274
zyxwvutsrqponmlkjihgfedcbaZYXWVUTSRQPONMLKJIHGFEDCBA
Journal of Education for BusinessABSTRACT. Using a sample of 221
undergraduate students enrolled in
human resource management courses
taught in a business school, this study checked for sex and race/ethnicity
effects in peer ratings
zyxwvutsrqponmlkjihgfedcbaZYXWVUTSRQPONMLKJIHGFEDCBA
of classroom presentations. Student age and studentpresenter frequency of participation in
the classroom were the control vari-
ables. Our primary goal was to find out whether peer ratings were suscep- tible to the same-group preference bias. Results showed no consistent
tendency by students to favor student
presenters from their own groups. Fre-
quency of participation by presenters in classroom discussions turned out to
be a better predictor of student ratings
of presentations by peers than any of the other factors studied.
form as raters. For example, can they be impartial when rating their peers? Do the demographics of student raters and ratees affect the ratings given and received (e.g., do females favor females when rating)? Are students more prone to rate peers of other races differently than members of their own race?
There is reason for concern about the behavior of students as raters because peer ratings have been known to be influenced by personal characteristics of raters and ratees, both at work and in university contexts. At work, a number of studies have claimed that race and sex have played a part in ratings given, and received, by coworkers serving as peer raters (Bass & Turner, 1973; Die,
Debbs, & Walker, 1990; Jordan, 1989; Kraiger & Ford, 1985; Pulakos, Oppler, White, & Borman, 1989; Sackett &
DuBois, 1991).
Research on peer ratings in the uni- versity classroom context is relatively sparse. But the little that is available suggests that student raters are not free from the influence of personal charac- teristics in assigning ratings to their peers. For example, Sherrard, Raafat, &
Weaver (1994) claimed that women in a class gave student groups higher ratings than the men did. With regard to race, Harber (1998) used a college sample to test the prediction that Whites would supply more lenient feedback to African Americans than to their fellow Whites. As predicted, the feedback was less crit- ical when the supposed feedback recip- ient was African American rather than White.
The need for understanding the behavior of students as raters is now urgent, as institutions of higher educa- tion in the United States are becoming more and more integrated by gender and race. Women now constitute a majority of the student body at the university level of education (Koerner, 1999; Som- mers, 2000), and the demographic com- position of the students is now mixed, particularly in the urbanized areas and on the West Coast. In California, for example, the majority of students at 10
of the 21 campuses of the California State University are now non-Whites (California State University, 1999). Thus, it is vitally important that student involvement in peer appraisal yield results that are not tainted, and that do not have the appearance of being taint- ed, by sex and race preferences.
The fact that ratings given and received by students serving as peer raters may be influenced by their per- sonal characteristics or those of the ratees raises a serious problem of inter- pretation. For example, suppose that for a given sample of men and women, it is found that women gave higher ratings to women than they gave to men in a con- test involving essay writing. Does this automatically mean that the women were biased in favor of women? An alternative explanation might be that the women writers were in fact better essay writers and judges of essays than men. Still another explanation might be that the women had better handwriting and thus presented more legible essays. In short, higher ratings received by peers of their own sex or race/ethnicity group might either reflect real differences or be the result of moderating variables. For example, Waldman and Aviolo (1991) reported that race effects in per- formance appraisal disappear when cognitive ability, education, and experi- ence are taken into account (see also
Borman, White,
zyxwvutsrqponmlkjihgfedcbaZYXWVUTSRQPONMLKJIHGFEDCBA
& Dorsey, 1995).We began our study by investigating whether ratings given and received by student raters were related to the sex and race/ethnicity of the raters and ratees. The study design consisted of having students in a classroom rate a dimension of classroom performance (verbal presentations of case analysis) of their peers, and then sorting the rat- ings (given and received) according to the sex and race/ethnicity of the partici- pants. Thus, we sought to investigate the following two primary questions:
1. Do men and women student raters favor members of their own sex in rat- ing classroom presentations given by peers?
2. Do members of different race/eth- nicity groups favor members of their own group in rating classroom presenta- tions by peers?
We then introduced two other vari- ables into the investigation: student age and frequency of student participation in classroom discussions and exercises. Age has been identified as a factor in performance ratings in the industrial arena (Rosen & Jerdee, 1979), as well as in the classroom (Crew, 1984). One might expect older presenters to get higher ratings because of a possible per- ceived maturity level.
Frequency of participation in the classroom refers to participation initiated by the student during lectures and dis- cussions. This typically consists of stu- dents raising their hands and asking questions of the professor and other speakers during class meetings and stu- dent presentations. To our knowledge, nobody yet has investigated the potential effect that a student’s level of participa- tion in classroom discussions has on the ratings that he or she receives from peers for class presentations. We suspected that there might be a connection for two rea- sons. First, students who participate fre- quently in general class discussions can be expected to be more at ease when making individual presentations to the class. Second, the “halo effect” (Cascio, 1998) can occur, whereby the raters’ knowledge of the ratee’s achievement on one dimension (in this case, general classroom participation) might lead some raters to assign higher ratings on another dimension (in this case, the pre- sentation). The halo effect might also work to reduce or enhance the role of sex and race in the ratings assigned.
Those two variables, age and fre- quency of participation, served as con- trol variables in our study. We investi- gated whether those two variables play a part in this issue, and what their rela- tive importance is compared with sex and racelethnicity. Thus, our third ques- tion was
3. Do the ages and frequency of class participation of student presenters con- tribute to the ratings assigned to them by their peers, and if so, how large is their effect relative to those of sex and race/etfinicity ?
Before proceeding further, we should acknowledge that our study did not deal directly with the validity of student rat- ings in the classical sense (Johnson &
Smith, 1997). In particular, we did not seek to correlate student peer ratings of classroom presentations with objective indices of learning. First, the type of assignment rated (classroom presenta- tions) does not lend itself readily to objective assessment. Research has shown that control of the peer rating process through structuring reduces subjectivity but does not eliminate it (Johnson & Smith, 1997). Second, this study was done in a natural setting (actual classes taught in a university context) that did not allow for elaborate scientific controls. The current study should thus be viewed as an exploration of the consequences of allowing stu- dents of both sexes and multiple race/ethnicity groups to participate in the peer rating process in a relatively unstructured situation that allowed for
the expression of rater preferences.
zyxwvutsrqponmlkjihgfedcbaZYXWVUTSRQPONMLKJIHGFEDCBA
Method
zyxwvutsrqponmlkjihgfedcbaZYXWVUTSRQPONMLKJIHGFEDCBA
Subjects
The subjects in this study were 221 undergraduate students enrolled in six sections of a course in human resource management taught in a business school of a state university located on the West Coast. All the sections were taught by the same professor over 3 semesters.
The average number of students per
class was
zyxwvutsrqponmlkjihgfedcbaZYXWVUTSRQPONMLKJIHGFEDCBA
36.8, with a range of 24 to 48.Personal characteristics of students were obtained through biographical information sheets administered during the semester. Approximately 56% were males. The majority (63.55%) was White (Euro-Americans), and the rest were Mexican Americans ( 1 1.68%), African Americans (4.21 %), Asian
Americans ( I 3.55%), and
zyxwvutsrqponmlkjihgfedcbaZYXWVUTSRQPONMLKJIHGFEDCBA
Other(7.01 %). The Asian American category consisted of students of East Asian ori- gin, including Filipinos. The Other cat- egory consisted of international students from the Middle East and other regions, students of mixed-race backgrounds, and others who did not fit into any of the four race categories. (Note that the terms race and ethnicity are used inter- changeably in discussions of population subgroups in the United States. In this study, they were combined with the use of a slash [e.g., race/ethnicity]).
May/June 2001 275
Almost 69% of the students were under 25 years in age, and an additional
23% were between
zyxwvutsrqponmlkjihgfedcbaZYXWVUTSRQPONMLKJIHGFEDCBA
25 to 29. Three stu-dents were over 40 years old, and the mean age of the entire sample was 24.57
years.
zyxwvutsrqponmlkjihgfedcbaZYXWVUTSRQPONMLKJIHGFEDCBA
Assignment Rated
The rated assignment was a portion of a classroom presentation required of all students as members of teams con- sisting of three to five members. The presentation consisted of analysis of cases from a casebook on human resource management (Nkomo, Fottler,
& McAffee, 1996). The time allotted to the group was 20 to 25 minutes per pre- sentation, and the duration of the pre- sentations ranged from 5 to 10 minutes, with each student presenting different aspects of the case (e.g., introduction, analysis, conclusions, and recommen- dations). Before commencing the pre- sentations, all students identified them- selves by writing their names on the chalkboard.
Rating Procedure
All students were expected to partici- pate as raters of presentations and were provided with a rating sheet containing three provisions:
1. a rating scale that ranged from 1
(poor) to 10 (excellent);
2. two rating criteria: (a) content of the presentation, including level and scope of knowledge displayed, reason- ing, and supporting details provided, and (b) delivery, covering clarity, orga- nization and flow, coordination, time allocation, and stimulation of discus- sion; and
3. spaces for recording the group identification numbers and the names of the presenters.
Students serving as raters were asked to provide two ratings per presentation: group and individual. In assigning the group ratings, they were asked to quali- tatively combine the two criteria given above. In assigning ratings to individu- als, they were to provide an overall assessment of the individual presenters by taking into account the quality of
their contributions to the presentation,
zyxwvutsrqponmlkjihgfedcbaZYXWVUTSRQPONMLKJIHGFEDCBA
276 Journal
zyxwvutsrqponmlkjihgfedcbaZYXWVUTSRQPONMLKJIHGFEDCBA
of Education for Businessincluding facilitation of coordination and discussion. It is this portion of the presentation that provides the data for our study.
All students were provided with copies of the rating form at the begin- ning of the class. Unfortunately, a num- ber of students either failed to bring rat- ing forms to the class or gave a very small number of ratings. The ratings of those who gave five or fewer ratings were dropped from the analysis. The overall return rate of usable forms was about 85%.
Directions for Raters
As the purpose of this research was to study whether sex and race/ethnicity play a part in student peer appraisals, the question of what directions to give the participants was considered before the initiation of the study. Research sug- gests that rater training in sex and race/ethnicity issues can control distrib- utional errors (halo, leniency, and cen- tral tendency) as well as sex and race/ethnicity effects in performance appraisal (for a summary, see Latham &
Wexley, 1994, pp. 137-167). We con- sidered whether such rater training was necessary, and decided not to make an issue of sex and racelethnicity in the directions, but rather to exhort the raters in general terms to minimize distribu- tional errors by being impartial, consci- entious, timely, and detailed in the com- pletion of their ratings. The data presented in our study are thus a relative- ly raw expression of rater preferences.
Frequency of Class Participation
These data were acquired by asking students at the end of the semester to rate the frequency of their own partici- pation in class on a 5-point scale rang-
ing from
zyxwvutsrqponmlkjihgfedcbaZYXWVUTSRQPONMLKJIHGFEDCBA
1 (almost never) to 5 (almostalways). The scale and results attained
are given in Table 1. The self-ratings given by the students were compared with those assigned by the professor. Differences in the two rating sets were found in about 15% of the cases. How- ever, in most of those cases, the differ- ences were within plus or minus 1 point on the 5-point scale. Differences greater than 2 points were obtained in only five
cases; in two of these, the difference was 3 points. In those two cases, the
professor’s ratings were entered because all the objective data (atten- dance records, ratings by peers in group discussion participation, and observa- tion by the professor) indicated that these self-ratings were inflated. All the other cases were left unchanged. Note that the results given in Table 2 appear to be reasonably free from leniency, a major problem facing self-ratings (Har- ris & Schaubroeck, 1988).
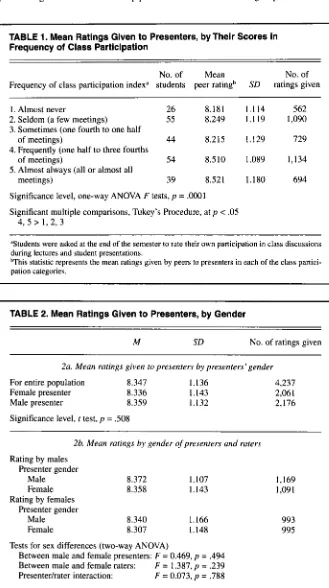
The column titled “Mean peer ratings” gives the mean of the ratings given by peers to presenters in each of the fre- quency-of-class-participation categories. The data show that students who partici- pated frequently or always (scale points
4 and 5) received significantly higher mean ratings on their presentations than did students who participated sometimes, seldom, or never (points 1, 2, and 3).
Peer ratings on presentations given in class by students are thus at least partial- ly influenced by how frequently the pre- senters participate in regular class activi- ties. These data were combined with the other three factors-sex, race/ethnicity, and age-later in our study to test for combined effects among the factors.
Results
Four variables were included in the statistical analysis: sex, race/ethnicity, age, and frequency of participation of presenters in class discussions. The results are given in Tables 2 to 5.
In Tables 2 to 4, we provide mean peer ratings of the presentations by sex and race/ethnicity in various combina- tions. We calculated three types of sig-
nificance results: (a)
zyxwvutsrqponmlkjihgfedcbaZYXWVUTSRQPONMLKJIHGFEDCBA
I tests for compar-ing mean scores of men and women, (b) ANOVA F tests for differences in mean
rating scores among race/ethnicity cate- gories, and (c) Tukey’s Multiple Com- parkon Procedure for identifying sig- nificant group differences in instances where the F test yielded significant results (referred to hereafter as Tukey’s MC Test.) We also provide the total number of ratings given by all the raters who rated individual presenters.
In Table 5, we give the results of regression analysis, using ratings assigned by students to their peer pre-
senters as the dependent variable, and raterhatee sex, race/ethnicity, age, and presenter frequency of participation as the independent variables.
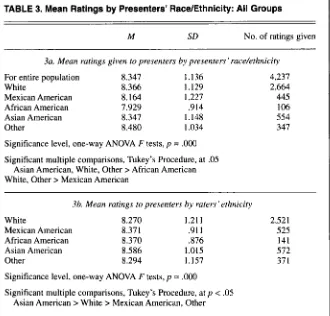
of the table (2a) shows the results of rat- ings given to the presenters according to the sex of the presenter. The mean rat- ings received by men and women were
not significantly different.
zyxwvutsrqponmlkjihgfedcbaZYXWVUTSRQPONMLKJIHGFEDCBA
Sex Differences Table 2b contains the mean ratings
given to presenters by rater sex groups. The data relating to peer ratings by
gender are given in Table 2. The top part
Ratings assigned by student raters did
[image:5.612.51.380.149.737.2].not follow the sex group of the raters.
zyxwvutsrqponmlkjihgfedcbaZYXWVUTSRQPONMLKJIHGFEDCBA
TABLE 1. Mean Ratings Given to Presenters, by Their Scores in Frequency of Class Participation
No. of Mean No. of Frequency of class participation indexa students peer ratingb SD ratings given
1. Almost never 26 8.181 1.114 562
2. Seldom (a few meetings)
zyxwvutsrqponmlkjihgfedcbaZYXWVUTSRQPONMLKJIHGFEDCBA
55 8.249 1.119 1,090 3. Sometimes (one fourth to one halfof meetings) 44 8.215 1.129 729 4. Frequently (one half to three fourths
of meetings) 54 8.510 1.089 1,134
5. Almost always (all or almost all
meetings) 39 8.521 1.180 694
Significance level, one-way ANOVA F tests, p
zyxwvutsrqponmlkjihgfedcbaZYXWVUTSRQPONMLKJIHGFEDCBA
= .0001 Significant multiple comparisons, Tukey’s Procedure, at p < .054, 5 > 1, 2, 3
aStudents were asked at the end of the semester to rate their own participation in class discussions
zyxwvutsrqponmlkjihgfedcbaZYXWVUTSRQPONMLKJIHGFEDCBA
during lectures and student presentations. [image:5.612.50.386.170.423.2]q h i s statistic represents the mean ratings given by peers to presenters in each of the class partici- pation categories.
TABLE 2. Mean Ratings Given to Presenters, by Gender
M SD No. of ratings given
2a. Mean ratings given to presenters by presenters’ gender
For entire population 8.347 1.136 4,237
Female presenter 8.336 1.143 2,061
Male presenter 8.359 1.132 2,176
Significance level, t test, p = SO8
2b. Mean ratings by gender
zyxwvutsrqponmlkjihgfedcbaZYXWVUTSRQPONMLKJIHGFEDCBA
of presenters and ratersRating by males Presenter gender
Male 8.372 1.107 1,169
Female 8.358 1.143 1,09 1
Rating by females Presenter gender
Male 8.340 1.166 993
Female 8.307 1.148 995
Tests for sex differences (two-way ANOVA)
Between male and female presenters:
zyxwvutsrqponmlkjihgfedcbaZYXWVUTSRQPONMLKJIHGFEDCBA
k’ = 0.469, p = .494Between male and female raters: F = 1.387, p = .239
Presenterhater interaction: F = 0.073, p = .788
The ratings that men gave to men were not statistically significantly different from those that they gave to women. Similarly, the ratings that women raters gave to women presenters were not sta- tistically significantly different from those that they gave to the male presen- ters. Viewed by itself, sex was not a sig- nificant factor in peer ratings, either given or received, in the current study.
Race/Ethnicity Differences
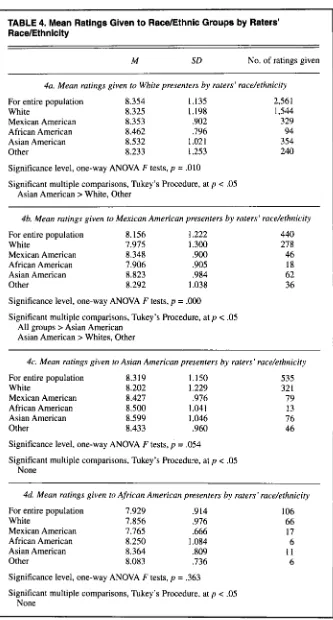
In Tables 3a and 3b, we provide the mean ratings received, by presenter’s race/ethnicity and rater’s race/ethnicity, for all groups. As can be seen in Table 3a, the differences in the mean ratings broken down by presenter’s ethnic background were highly significant (p <
.OOO). The presenting group that received the highest rating was the Other category, and the lowest score was assigned to African Americans. The results of Tukey’s MC Test showed that the Asian American, White, and Other categories received significantly higher ratings than did African Americans, and that the White and Other presenters scored significantly higher than did Mexican Americans.
On the face of it, it thus appears that race/ethnicity of the presenter does mat- ter in peer ratings given in the class- room, with Mexican Americans and African Americans receiving signifi- cantly lower ratings than two or more of the other groups. But before accepting this as bias, it is essential also to look at the rater behavior data in Tables 3b and 5. The data in Table 3b shows that, for the sample as a whole, there were high- ly significant differences among the mean ratings given by the different groups (p < .OOO). The Asian American group gave significantly higher ratings than did Whites, Mexican Americans, and the Other category. This raises the possibility of differences in rating ten- dencies, rather than rating bias, among rater groups, working independently or alongside same-group preferences.
To investigate this further, we extend- ed the analysis in Table 3b to provide the mean peer ratings given to presen- ters broken down by rater race/ethnicity (see Table 4). In Table 4a, we give the ratings received by Whites according to
May/June 2001
zyxwvutsrqponmlkjihgfedcbaZYXWVUTSRQPONMLKJIHGFEDCBA
277 [image:5.612.48.386.443.735.2]TABLE 3. Mean Ratings by Presenters’ Race/Ethnicity: All Groups
zyxwvutsrqponmlkjihgfedcbaZYXWVUTSRQPONMLKJIHGFEDCBA
M SD
zyxwvutsrqponmlkjihgfedcbaZYXWVUTSRQPONMLKJIHGFEDCBA
No. of ratings given3a. Mean ratings given to presenters by presenters’ race/ethnicity
For entire population 8.347 1.136 4,237
White 8.366 1.129 2,664
Mexican American 8.164 1.227 445
African American 7.929 .914 106
Asian American 8.347 1.148 554
Other 8.480 1.034 347
Significance level, one-way ANOVA F tests,
zyxwvutsrqponmlkjihgfedcbaZYXWVUTSRQPONMLKJIHGFEDCBA
pzyxwvutsrqponmlkjihgfedcbaZYXWVUTSRQPONMLKJIHGFEDCBA
=zyxwvutsrqponmlkjihgfedcbaZYXWVUTSRQPONMLKJIHGFEDCBA
,000Significant multiple comparisons, Tukey’s Procedure, at .05 Asian American, White, Other > African American White, Other > Mexican American
3b. Mean ratings to presenters by raters’ ethnicity
White 8.270 1.21 1 2,521
Mexican American 8.37 1 ,911 525
African American 8.370 376 141
Asian American 8.586 1.015 572
Other 8.294 1.157
zyxwvutsrqponmlkjihgfedcbaZYXWVUTSRQPONMLKJIHGFEDCBA
37 1Significance level, one-way ANOVA F tests, p = .OOO
Significant multiple comparisons, Tukey’s Procedure, at p < .05
Asian American > White > Mexican American, Other rater race/ethnicity. Note that the differ-
ences in these mean ratings are statisti- cally significant (p = .010). The highest ratings given to Whites were not by Whites, as would be expected if a same- race/ethnicity preference existed within this group, but by Asian Americans and African Americans. The relatively high score received by Whites as presenters from the whole sample (Table 3a) thus cannot be attributed significantly to their fellow Whites (Table 4a).
In Table 4b, we provide the mean rat- ings received by Mexican American presenters by raters’ ethnicity. Again, the differences among the means were highly significant. The lowest score given to Mexican Americans was given by African American raters; the highest by Asian American raters.
In Table 4c, we provide the mean rat- ings received by Asian American pre- senters by rater race/ethnicity. The dif- ferences among the mean ratings were marginally statistically significant (p =
.0540). The highest ratings given to Asian American presenters were assigned by Asian Americans. But in
interpreting this result for bias, it is
zyxwvutsrqponmlkjihgfedcbaZYXWVUTSRQPONMLKJIHGFEDCBA
278 Journal
zyxwvutsrqponmlkjihgfedcbaZYXWVUTSRQPONMLKJIHGFEDCBA
of Education for Businessimportant to note that the rating assigned by the Asian American raters to their own race/ethnicity group was lower than that assigned by them to the Mexican American group (Table 4b). The underlying force here may be a group rating tendency rather than a same-race/ethnicity preference.
In Table 4d, we provide the mean rat- ings received by African American pre- senters by rater race/ethnicity. Unfortu- nately, because of the small sample size of this group, the results of tests of sig- nificance are not meaningful. It is inter- esting to note, however, that the mean rating given by the African American raters to peers from their own ethnic group (8.25, Table 4d) was lower than that given by them to Asian Americans (8.5, Table 4c) and to Whites (8.46, Table 4a).
Regression Analysis Results
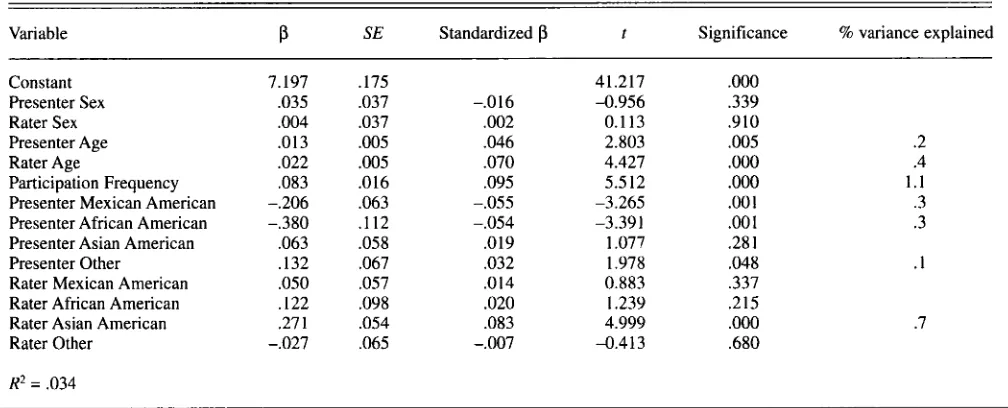
The results of a standard linear regression analysis are presented in Table 5. In this model, the dependent variable was ratings assigned to the pre- senters by the raters, and the indepen-
dent factors were rater and presenter sex, race/ethnicity, age, and presenter frequency of participation. For race/eth- nicity, dummy variables were created to represent the groups, and the model was based on a White presenter and a White rater. It is important to begin this analy- sis by noting that all factors together explained only 3.4% of the rating varia- tion. There are, however, some interest- ing variations in the results. Sex, of both presenters and raters, was an insignifi- cant influence in the rating process. Of the total variance in the rating process explained by these factors (3.4%), pre- senter and rater age contributed 6% and 12%, respectively. Age was thus a play- er in the peer rating process, with increasing age contributing positively to the ratings given and received. The increase in ratings received by age is understandable, as experience and self- confidence increase with age. However, we were puzzled by the finding that older raters gave higher ratings, which needs to be further researched.
Presenter race/ethnicity, when viewed in combination with the other factors, emerges as a significant player in the rating process. Being African American and Mexican American resulted in lower ratings, with both of these factors jointly accounting for 18% of the explained variance. Asian Ameri- can raters gave mean ratings that were almost .3 higher than the other raters, accounting for 21% of the explained variation of the ratings.
The single most significant influence behind the ratings process was frequen- cy of participation in classroom discus- sions by the presenters. That factor accounted for 32% of the explained variance, with higher general participa- tion scores being associated with high peer ratings of presentations. We also tested for potential interaction effects, under the notion that people would give higher ratings to presenters of their own race/ethnic group. However, none of the interaction terms were statistically sig- nificant.
Discussion
Using a sample of senior-level col- lege students, in this study we sought to investigate whether sex and race/eth-
[image:6.612.56.386.49.365.2]TABLE 4. Mean Ratings Given to Race/Ethnic Groups by
zyxwvutsrqponmlkjihgfedcbaZYXWVUTSRQPONMLKJIHGFEDCBA
Raters’ RacelEthnicityzyxwvutsrqponmlkjihgfedcbaZYXWVUTSRQPONMLKJIHGFEDCBA
M SD
zyxwvutsrqponmlkjihgfedcbaZYXWVUTSRQPONMLKJIHGFEDCBA
No. of ratings given4a. Mean ratings given to White presenters by raters’ race/ethnicity
For entire population 8.354 1.135 2,561 White 8.325 1.198 1,544 Mexican American 8.353 .902 329 African American 8.462 .796 94 Asian American 8.532 1.021 354 Other 8.233 1.253 240
Significance level, one-way ANOVA F tests, p
zyxwvutsrqponmlkjihgfedcbaZYXWVUTSRQPONMLKJIHGFEDCBA
= .010Significant multiple comparisons, Tukey’s Procedure, at p < .05
zyxwvutsrqponmlkjihgfedcbaZYXWVUTSRQPONMLKJIHGFEDCBA
Asian American >White, Other
4b. Mean ratings given to Mexican American presenters by raters’ race/ethnicity
For entire population 8.156 1.222 440 White 7.975 1.300 278 Mexican American 8.348 .900 46 African American 7.906 .905 18 Asian American 8.823 ,984 62 Other 8.292 1.038 36
Significance level, one-way ANOVA F tests, p = .OOO
zyxwvutsrqponmlkjihgfedcbaZYXWVUTSRQPONMLKJIHGFEDCBA
Significant multiple comparisons, Tukey’s Procedure, at p < .05
All groups > Asian American Asian American > Whites, Other
4c. Mean ratings given to Asian American presenters by raters’ race/ethnicity
For entire population 8.319 1.150 535 White 8.202 1.229 32 1
Mexican American 8.427 ,976 79 African American 8.500 1.041 13 Asian American 8.599 1.046 76 Other 8.433 .960 46 Significance level, one-way ANOVA F tests, p = ,054
Significant multiple comparisons, Tukey’s Procedure, at p < .05
None
4d. Mean ratings given to African American presenters by raters’ race/ethnicity
For entire population 7.929 .914 106 White 7.856 .976 66 Mexican American 7.765 .666 17
African American 8.250 1.084 6 Asian American 8.364 .809 1 1
Other 8.083 ,736 6 Significance level, one-way ANOVA F tests, p = .363
Significant multiple comparisons, Tukey’s Procedure, at p < .05 None
nicity played any part in ratings given, and received, by peer raters within a classroom situation. Participant age and frequency of participation in the classroom were added as control vari- ables. The data presented here rule out
sex as a factor in peer ratings (Tables 2 and 5).
With regard to race/ethnicity, the results were somewhat more complex. Though African Americans and Mexi- can Americans received significantly
lower mean ratings than two or more of
the other groups (Tables 3a and
zyxwvutsrqponmlkjihgfedcbaZYXWVUTSRQPONMLKJIHGFEDCBA
5 ) , fur-ther analysis revealed that these differ- ences could not be explained by any simple manifestation of same raceleth- nicity group preferences. Our data show inconsistencies in this regard. The high- est ratings given by White raters were to White presenters (Table 4a), but White presenters received higher ratings from three of the other race/ethnicity groups. African American raters gave the lowest rating to Mexican American pre- senters (Table 4b) and placed their own group below the White (Table 4a) and Asian American group (Table 4c). The Asian American rater group turned out
to be the most lenient (Table 3b), but gave the highest rating to the Mexican American presenters. The Mexican American raters gave their highest rat- ings to Asian American presenters (Table 4c) and their lowest to African American presenters (Table 4d).
Because race/ethnicity was not a reli- able predictor of peer ratings, we intro- duced two alternative explanations: par- ticipant age and frequency of participation in the classroom. The influence of both of these factors was studied in combination with the other two (Table 5 ) . Both contributed signifi- cantly to the variation in the ratings given, with frequency of presenter par- ticipation in the classroom contributing about 32% of the total variation
explained by the four factors.
Suggestions for Teaching and Research
How should professors cope with
peer ratings in the classroom? Our research leads us to make three sugges- tions for faculty interested in research- ing this subject further and using stu- dents as peer raters in the classroom. First, peer ratings should not be accept- ed at face value when used for appraisal purposes. Our study clearly demon- strates that student peer ratings are influenced by multiple raterhatee char- acteristics and that it would be incorrect to use scores on any one of them indi- vidually as the sole basis for any judg- ment about the meaning and usefulness of the ratings. When race/ethnicity dif- ferences are found, faculty should make
May/June 2001 279
[image:7.612.52.385.34.654.2]TABLE 5. Regression Model for Factors Influencing Ratings
zyxwvutsrqponmlkjihgfedcbaZYXWVUTSRQPONMLKJIHGFEDCBA
Variable
P
zyxwvutsrqponmlkjihgfedcbaZYXWVUTSRQPONMLKJIHGFEDCBA
SE StandardizedP
t SignificancezyxwvutsrqponmlkjihgfedcbaZYXWVUTSRQPONMLKJIHGFEDCBA
% variance explainedConstant 7.197 .I75 41.217 ,000
Presenter Sex ,035 ,037 -.O 16 -0.956 .339
Rater Sex .004 .037 .002 0.113 .910
Presenter Age .013
zyxwvutsrqponmlkjihgfedcbaZYXWVUTSRQPONMLKJIHGFEDCBA
.005 .046 2.803 .005 .2Rater Age .022 .005 .070 4.427
.ooo
.4Participation Frequency .083 .016 .095 5.512
.ooo
1.1Presenter Mexican American -.206 .063 -.055 -3.265
.oo
1 .3Presenter African American -.380 .112 -.054 -3.391
.oo
1 .3Presenter Asian American .063 .058 ,019 1.077
zyxwvutsrqponmlkjihgfedcbaZYXWVUTSRQPONMLKJIHGFEDCBA
'28 1Presenter Other .I32 .067 ,032 1.978
zyxwvutsrqponmlkjihgfedcbaZYXWVUTSRQPONMLKJIHGFEDCBA
.048 .IRater Mexican American ,050 ,057 .014 0.883 ,337
Rater African American ,122 ,098 .020 I .239 .215
Rater Asian American .27 1 ,054 .083 4.999
.om
.7Rater Other -.027 ,065 -.007 -0.413 .680
R2 = .034
a good faith effort to check for con- comitant differences in age, abilities, and experience of presenters and raters (Waldman & Aviolo, 1991).
Second, in both using and research- ing peer ratings, it is important to be more sensitive to potential bias across groups. Much of the research on this subject, cited earlier, focused on the problem of within- or same-group pref- erences. The data from the present study do not show any systematic same-group preference, either between sexes and among race/ethnicity groups. However, we wonder about the across-group rat- ings, in particular, the low ratings assigned to the Mexican American and African American raters. Bias cannot be claimed, because of the absence of validity data and small size of the African American sample. One alterna- tive explanation is language ability dif- ferences, which may account for the low ratings of the Mexican American pre- senters, many of whom spoke English with an accent. But some Asian Ameri- cans had accents too, and their ratings did not suffer. The issue is worthy of additional research.
Our third suggestion is that profes- sors consider the possibility of making
posr hoc adjustments of the rating
results. In other words, when faced with differences in rating tendencies among different student groups, the professor should study the ratings of each group and make corrections to level the play-
280 Journal of Education for Business
ing field. For example, the instructor could convert such scores to ranks and use the ranks for grading the ratees. This practice is now followed in the sport of figure-skating and has done much to level the playing field by ironing out differences in rating tendencies among judges (International Skating Union,
1993).
Conclusion
Students are being recruited to serve as raters of performance of their peers for a wide range of classroom assign-. ments. Ultimately, this practice will have to stand the test of validation stud- ies that correlate peer ratings with some objective indices of performance. Though our study did not seek to vali- date peer ratings in that classical sense,
it does provide insights into the role played by the four student characteris- tics-sex, racelethnicity, age, and fre- quency of class participation by presen- ters-in the rating process. Our study's data can be viewed from both statistical and substantive perspectives. When viewed statistically, because these fac- tors explained only 3.4% of the variance in peer ratings, they could be dismissed as inconsequential to the peer rating process. But in the world of higher edu- cation, even .2 of a point can make a dif- ference between a B and C grade, with
serious consequences for the student. Thus there is an urgent need to subject
peer ratings to a validity test by correlat- ing them with other criterion measures.
REFERENCES
Ammer,
zyxwvutsrqponmlkjihgfedcbaZYXWVUTSRQPONMLKJIHGFEDCBA
J. J. (1998). Peer evaluation model for enhancing writing performance of students withlearning disabilities.
zyxwvutsrqponmlkjihgfedcbaZYXWVUTSRQPONMLKJIHGFEDCBA
Reading & Wriring Quar- terly, 14(3), 263-282.Bass, A. R., & Turner, J. N. (1973). Ethnic group differences in relationships among criteria of job performance. Journal of Applied Psycholo-
Bernardin, H. J., & Buckley, M. R. (1981). A con- sideration of strategies in rater training. Acade- my of Management Review, 6, 205-212. Borman, W. C., White, L. A., & Dorsey, D. W.
(1995). Effects of ratee task performance and interpersonal factors on supervisor and peer performance ratings. Journal of Applied Psy-
California State University. (1999). CSU enroll- ment by campus and ethnic group. [On-line]. Available: http:Nwww.co.calstate.edu/asd/stat- reports/ 1999-2000/FETH99-02.HMTL. Cascio, W. F. (1998). Applied psychology in
human resource managemenf. Upper Saddle River, NJ: Prentice Hall.
Crew. J. C. (1984). Age stereotypes as a function of race. Academy of Management Journol,
27(2). 431-435.
Die. A. H., Debbs, T., & Walker, J. L. (1991). Managerial evaluation by men and women managers. Journal of Social Psychologv.
Haaga, D. A. (1993). Peer review of term papers in graduate psychology courses. Teaching of
Psychology, 20( I), 28-32.
Harber, K. D. (1998). Feedback to minorities: Evi- dence of a positive bias. Journal of Personalirv and Social Psychology, 74(3), 622428. Harris, M. M., & Schaubroeck, J. (1988). A meta-
analysis of self-supervisor. self-peer, and peer- supervisor ratings. Personnel Psychology, 41,
4 3 4 2 .
Henderson, T., Rada, R., & Chen. C. (1997). Quality management of student-student evalua- tions. Journal of Computing Research, 17(3), 199-2 15.
gy, 5, 101-109.
chology, 80, 168-177.
130(6), 763-769.
[image:8.612.55.559.69.273.2]International Skating Union. (1993). Judges hand-
zyxwvutsrqponmlkjihgfedcbaZYXWVUTSRQPONMLKJIHGFEDCBA
book, single ,free skating. Lausanne, Switzer- land: Author.
Johnson, C. B.,
zyxwvutsrqponmlkjihgfedcbaZYXWVUTSRQPONMLKJIHGFEDCBA
& Smith, F. I. (1997). Assessment of a complex peer evaluation instrument forteam learning and group processes. Accounting
Education. 2(1), 21-32.
Jordan, J. L. (1989). Effects of sex on peer ratings
of U.
zyxwvutsrqponmlkjihgfedcbaZYXWVUTSRQPONMLKJIHGFEDCBA
S. Army ROTC Cadets. PsychologicalReports, 64(3, Pt I ) , 939-944.
Khoon, K.
zyxwvutsrqponmlkjihgfedcbaZYXWVUTSRQPONMLKJIHGFEDCBA
A., Abd-Shukor, R., Deraman, M., &Othman, M.
zyxwvutsrqponmlkjihgfedcbaZYXWVUTSRQPONMLKJIHGFEDCBA
Y. (1994). Validity of peer review in selecting the best physics award. College Stu-dent Journal, 28(1), 119-121.
Koerner, B. (1999, February 8). Where the boys aren’t. U. S. News & World Report, pp. 46-55. Kraiger, K., & Ford, J. K. (1985). A meta-analy-
sis of ratee race effects in performance ratings.
Journal
zyxwvutsrqponmlkjihgfedcbaZYXWVUTSRQPONMLKJIHGFEDCBA
of Applied Psychology, 70, 56-65.zyxwvutsrqponmlkjihgfedcbaZYXWVUTSRQPONMLKJIHGFEDCBA
Latham, G. P., & Wexley, K. N. (1994). Increasing
productivity through p e q o m a n c e uppraisal.
Reading, MA: Addison-Wesley Publishing Company.
Nkomo, S. M., Fottler, M. D., & McAfee, R. B. (1996). Applicaiions in human resource man-
agement. Cincinnati, OH: South-Western Col- lege Publishing.
Norton, S. M. (1992). Peer assessment of perfor- mance and ability. Journal of Business and Pulakos, E. D., Oppler, S. H., White, L. A., & Bor- man, W. C. (1989). Examination of race and sex
effects on performance ratings. Journal
zyxwvutsrqponmlkjihgfedcbaZYXWVUTSRQPONMLKJIHGFEDCBA
qfApplied Psychology, 74(5), 770-780.
Rosen, B., & Jerdee, T. H. (1979). The influence of employee age, sex, and job status on man-
psych dog^, 6(3), 387-399.
agerial recommendations for retirement. Acad-
emy of Management Journal, 22,169-173. Sackett, P. R., & DuBois, C. L. Z. (1991). Rater-
ratee effects on performance evaluation. Jour-
nal of Applied Psychology, 76, 873-871. Sherrard, W. R., Raafat, F., & Weaver, R. R.
(1994). An empirical study of peer bias in eval- uations: Students rating students. Journal of
Education for Business, 70( I), 4 3 4 7 . Sommers, C. H. (2000). The war against boys.
The Atlantic Monthly, May, 59-74.
Topping, K. (1998). Peer assessment between stu- dents in colleges and universities. Review of
Educational Research, 68(3), 249-276. Waldman, D. A., & Avolio, B. J. ( 199 I). Race
effects in performance evaluations: Controlling for ability, education, and experience. Journal of Applied Psychology. 76, 897-901,
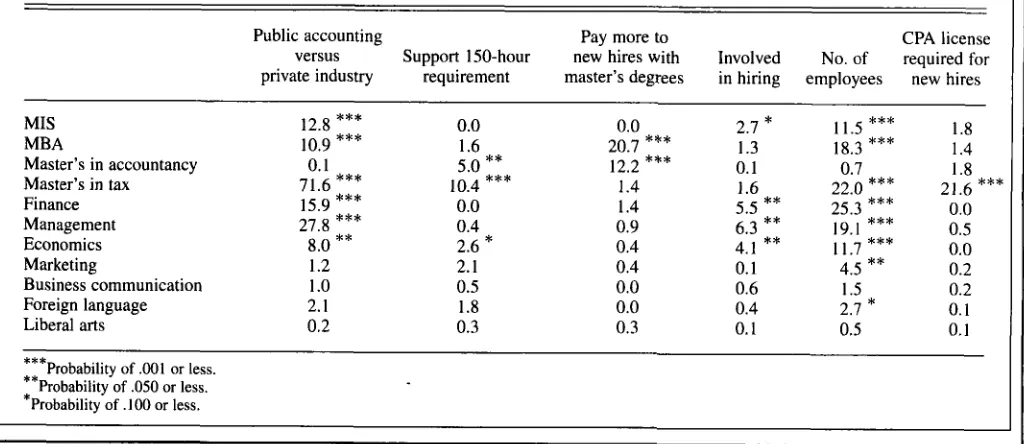
ERRATUM
On page 136 of the JanuaryFebruary 2001 issue of the Journal of Education for Business, Table 5 of “Educating Future Accountants:
[image:9.612.52.564.409.631.2]Alternatives for Meeting the 150-Hour Requirement,” by Celia Renner and Margaret Tanner, was incorrectly printed. The correct Table 5 is as follows:
TABLE 5. Tests of Independence Between Respondents’ Characteristics and Educational Choices (Numbers Shown Are Chi-square Statistics)
CPA license versus Support 150-hour new hires with Involved No. of required for Public accounting Pay more to
private industry requirement master’s degrees in hiring employees new hires MIS 12.8
***
0.0 0.0 2.7*
11.5***
1.8 Master’s in accountancy 0.1 5.0**
12.2***
0.1 0.7 1.8 Master’s in tax 71.6***
10.4***
1.4 1.6 22.0***
21.6***
Managemen t 27.8***
0.4 0.9 6.3**
19.1***
0.5MBA 10.9
***
1.6 20.7***
1.3 18.3***
1.4Finance 15.9
***
0.0 1.4 5.5**
25.3***
0.0Economics 8.0
**
2.6*
0.4 4.1**
11.7***
0.0 Marketing 1.2 2.1 0.4 0.1 4.5**
0.2 Business communication 1 .O 0.5 0.0 0.6 1.5 0.2 Foreign language 2.1 1.8 0.0 0.4 2.1*
0.1Liberal arts 0.2 0.3 0.3 0.1 0.5 0.1
***
**
Probability of ,001 or less.Probability of