Full Terms & Conditions of access and use can be found at
http://www.tandfonline.com/action/journalInformation?journalCode=cbie20
Download by: [Universitas Maritim Raja Ali Haji] Date: 19 January 2016, At: 20:18
Bulletin of Indonesian Economic Studies
ISSN: 0007-4918 (Print) 1472-7234 (Online) Journal homepage: http://www.tandfonline.com/loi/cbie20
CHANGE AND CONTINUITY IN INDONESIA'S NEW
FISCAL DECENTRALISATION ARRANGEMENTS
George Fane
To cite this article: George Fane (2003) CHANGE AND CONTINUITY IN INDONESIA'S NEW FISCAL DECENTRALISATION ARRANGEMENTS, Bulletin of Indonesian Economic Studies, 39:2, 159-176, DOI: 10.1080/00074910302012
To link to this article: http://dx.doi.org/10.1080/00074910302012
Published online: 17 Jun 2010.
Submit your article to this journal
Article views: 98
View related articles
ISSN 0007-4918 print/ISSN 1472-7234 online/03/020159-18 © 2003 Indonesia Project ANU In 1999, President Habibie’s government
introduced two important laws that were designed to make Indonesia more dem-ocratic and to increase the autonomy of the regions—that is, the provinces and the local government areas, the latter comprising both districts (kabupaten) and municipalities (kota).1 Law 22/1999 on
Regional Governance defined the func-tions that were to be transferred from the centre to the regions and set out the procedures for establishing regional as-semblies and for appointing regional governments.2 In contrast to the
substan-tial decentralisation of responsibility for regional government spending, there has been little decentralisation of taxation. The central government has retained the responsibility for setting the rates of all the existing major tax bases, and collect-ing most of their revenue.3
The limited decentralisation of taxa-tion that has occurred is governed by Law 34/2000, which somewhat relaxed the restrictions on regional taxes and charges that had been imposed by Law 18/1997 to curb nuisance taxes and tax-es on regional trade (Silver, Azis and
Schroeder 2001: 358). Law 34/2000 al-located certain existing regional tax bases to provinces and others to local governments, but set ceilings on the maximum rates of these ‘positive list’ taxes. In order to help finance decentral-isation, it also authorised all regional governments to introduce user charges, and authorised local governments, but not provinces, to introduce new taxes. According to Law 34/2000, all new lo-cal taxes and lolo-cal and provincial user charges must be reviewed by the cen-tral government to ensure that they are efficient and appropriate; for example, local taxes must not be levied on bases assigned to provinces or the central gov-ernment. However, a study by Lewis (2003c) concludes that out of over a thousand new taxes and charges that were proposed or implemented by lo-cal governments between April 2000 and June 2002, less than half were in fact reviewed by the central government.
Because of the much more extensive decentralisation of expenditure func-tions than of revenue, the regions’ new responsibilities have had to be financed
CHANGE AND CONTINUITY IN INDONESIA’S
NEW FISCAL DECENTRALISATION ARRANGEMENTS
George Fane*
The Australian National University
The changes in grant allocation among regions have been less revolutionary than the 1999 decentralisation legislation envisaged because the resource-rich regions were able to force the government to modify the proposed fiscal gap formula for allocat-ing general purpose grants so as to put more weight on the status quo. Partly for this reason, and partly because no major tax was decentralised, there has not been much increase in autonomy for the regions that have few natural resources. In addition, it is argued here that the procedures for grant allocation in 2002 created incentives for regional fragmentation and did not take account of poverty in an appropriate way.
mainly from two central government sources: an increase in the share of tax and natural resource revenues that the central government returns to the re-gions in which these revenues originate, and the introduction of a new type of grant, the DAU (Dana Alokasi Umum). This article follows the widespread prac-tice of referring to the DAU as a general purpose grant, although this is only true ‘at the margin’. The bulk of the DAU is needed to pay government officials and to provide services, such as basic edu-cation and health, for which regional governments are responsible. Law 25/1999 on the Fiscal Balance between the Central and Regional Governments stipulated that the DAU should be allo-cated among regions in proportion to their net fiscal gaps, and Government Regulation 104/2000 set out a formula for determining each region’s fiscal gap in terms of proxies for its fiscal need and its economic potential.
When Laws 22/1999 and 25/1999, along with their supporting government regulations and decrees, came into effect in January 2001, regional governments took over responsibility for all govern-ment functions except foreign policy, defence and security, justice, macro-economic policy, religion, and various other central government functions such as national planning, human resource development, natural resource utilisa-tion, conservautilisa-tion, strategic high tech-nology, state administration and state economic institutional systems. Since the functions are not clearly defined, there is obviously scope for interpreting them either broadly or narrowly. Nev-ertheless, there has clearly been a major transfer of revenue and responsibilities to the regions, with most of the staff of the formerly ‘deconcentrated’ agencies of the central government being trans-ferred to the decentralised agencies of
regional governments in 2001.4 The
de-concentrated agencies that remain are those responsible for regional imple-mentation of the functions reserved for the central government (Lewis 2003b: 2). Apart from strengthening the regions relative to the centre, the new laws strengthened local governments relative to provinces in three ways. First, in place of the former hierarchical system in which local governments were respon-sible to provincial governments, Law 22/1999 made each regional govern-ment directly responsible to its legisla-tive assembly, subject to constraints imposed by the central government. Provincial governments do, however, continue to exercise some powers over local governments, because provincial governors have a dual role: in addition to representing their provinces, they also represent the central government in its dealings with local governments. Second, Law 25/1999 transferred most responsibilities to local rather than pro-vincial governments. Third, Law 25/1999 allocated 90% of the DAU to local governments and only 10% to the provinces.
The reason for by-passing the prov-inces appears to have been that the cen-tral government was worried about secessionist movements: strengthening the provinces might shore up these movements, whereas strengthening lo-cal governments would weaken them. The government may have reasoned that individual local government areas are too small to be able to secede and that they would help resist secessionist pressures if they were the recipients of substantial transfers from the centre.
The basic argument of this paper is that the transfer of power from the cen-tral government to the regions has so far been much less revolutionary than would otherwise have been the case,
owing to three factors that partially per-petuated the status quo. First, the cen-tral government continues to control all major tax bases and, therefore, the bulk of the revenues of all regions other than those that are rich in natural resources. Since most revenue raising remains cen-tralised, and since ‘he who pays the pip-er calls the tune’, the extensive transfpip-er of spending responsibilities to the re-gions overstates the extent to which de-cision making has been decentralised.
Second, although responsibility for most current spending has been trans-ferred to the regions, most development spending is still under the central gov-ernment budget. In addition, develop-ment spending provides more scope than routine spending for regions to ex-ercise discretion, since most of the latter finances officials who cannot be dis-missed, together with services, such as education and health care, that must be provided at levels set by the centre.
Third, in response to pressure from regions that would otherwise have had their grants reduced, the central govern-ment assigned a relatively low weight to the new ‘fiscal gap formula’ for allo-cating the DAU. Instead, it gave a much higher weight to past history, in the form of the wage and salary bills of regional government officials and the pre-decentralisation levels of Presidential In-struction (Inpres) grants and grants to autonomous regions (subsidi daerah otonom, SDO). These had been the main general and specific transfers to the regions before the implementation of Law 25/1999.5
This paper focuses mainly on the third factor. It documents the differ-ences between the fiscal gap formula set out in Law 25/1999 and Regulation 104/2000, and the procedures that have actually been used for allocating the DAU among regional governments.
REGIONAL GOVERNMENT REVENUE
The main sources of funds for local and provincial governments are own-source income, transfers from the central gov-ernment of shared tax and natural re-source revenues, and general purpose grants from the central government, mainly from the DAU. In 2002, the DAU was supplemented by a Balancing Fund (referred to by the Ministry of Finance as ‘Dana Penyeimbang’) that was equiv-alent to the DAU from the point of view of regional governments, but treated as a separate item in the central govern-ment’s budget.6 Transfers from the
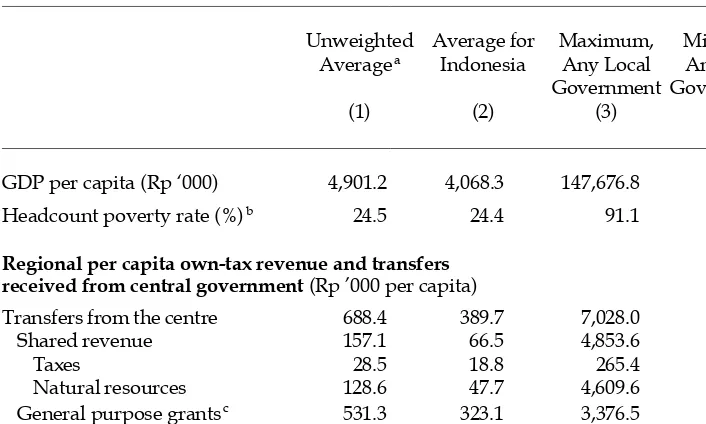
cen-tral government’s Specific Purpose Fund (Dana Alokasi Khusus, DAK) were of negligible importance in 2001 and 2002. Table 1 shows that in 2002, on average, local governments generated just under 5% of their total revenue from own-tax and non-tax sources, while transfers from the central government accounted for the remaining 95%. The DAU, which was by far the most impor-tant source of these transfers, provided 79% of total local government revenue; the remainder was made up of transfers from the central government of shared tax revenue (5%) and shared natural re-source revenue (12%).
A comparison of columns 1 and 2 of table 1 shows that, on a per capita basis, the unweighted average over all local government areas of each of the trans-fers from the central government to lo-cal governments is substantially larger than the corresponding average per cap-ita transfer for Indonesia. The latter is the weighted average over all local gov-ernment areas, where each area is weighted by its population. The fact that the unweighted averages exceed the weighted averages demonstrates that the per capita transfers are negatively correlated with population: the least
populous local government areas tend to receive the largest per capita trans-fers. This effect is especially marked in the case of general purpose grants (DAU and Balancing Fund); the correlation coefficient, across local government areas, between population and this vari-able is –0.5. The corresponding correla-tion coefficients for shared tax revenue and shared natural resource revenue are –0.3 and –0.2 respectively. The correla-tion coefficient between populacorrela-tion and the sum of these three per capita trans-fers is –0.4.
The features of the DAU formula that favour small local government areas will be described below. The fact that all of the central government transfers favour
small areas relative to more populous ones provides an incentive for local gov-ernment areas to fragment.
THE FISCAL GAP FORMULA FOR THE DAU
Article 7 of Law 25/1999 specifies that the total amount of DAU payments made to regional governments by the central government must be at least 25% of the domestic revenue received by the national budget net of payments to re-gional governments of shared tax and natural resource revenues; that 90% of this amount is to be allocated to local governments and 10% to provinces; and that the allocations among local govern-ments and among provinces are to be in TABLE 1 Means of Selected Variables, All Local Governments in Indonesia
Unweighted Average for Maximum, Minimum, Averagea Indonesia Any Local Any Local
Government Government
(1) (2) (3) (4)
GDP per capita (Rp ‘000) 4,901.2 4,068.3 147,676.8 856.5
Headcount poverty rate (%)b 24.5 24.4 91.1 1.0
Regional per capita own-tax revenue and transfers received from central government (Rp ’000 per capita)
Transfers from the centre 688.4 389.7 7,028.0 144.5
Shared revenue 157.1 66.5 4,853.6 6.4
Taxes 28.5 18.8 265.4 4.3
Natural resources 128.6 47.7 4,609.6 0.3
General purpose grantsc 531.3 323.1 3,376.5 113.1
Own-tax and other revenue 22.4 18.6 855.3 0.3
aThe unweighted averages are the arithmetic means of the variables across all local
governments. The average for Indonesia is obtained by taking the weighted average, where each local government is weighted by its population. The variables are those used by the Ministry of Finance to calculate DAU and Balancing Fund grants in FY2002.
bThe headcount poverty rate is the percentage of all people in a local government area
living in households whose average expenditure per capita is below the official poverty line. The source is the National Socio-Economic Survey (Susenas) of the Central Statistical Agency (BPS).
cGeneral purpose grants are DAU plus Balancing Fund receipts in 2002.
proportion to the gap between their fis-cal need and their economic potential. Article 17 of Regulation 104/2000 sets out a formula for calculating fiscal need and economic potential. Article 17(3) states that need ‘shall be calculated on the basis of the multiplication of aver-age expenditure of regions by the total of indexes of population, territorial area, building price and relative poverty af-ter being divided by four’. Article 17(4) states that economic potential ‘shall be calculated on the basis of the multipli-cation of average revenue of regions with the total of indexes of industry, natural resources and human resources after being divided by three’.7
The above quotations show that the fiscal gap formula in article 17 of Regu-lation 104/2000 was ambiguous. For example, it did not define relative pov-erty and the indexes of industry, natu-ral resources and human resources. In the event, article 17 was interpreted in different ways in 2001 and in 2002, and actual allocations from the DAU in both years were also based on past history and factors other than those mentioned in Law 25/1999 and Regulation 104/2000.
Lewis (2001) describes how the DAU was allocated among local governments and provinces in 2001. Each local gov-ernment was given a basic allocation that was equal to the sum of:
• the annualised8 amount of SDO
fund-ing received by the local government in financial year (FY) 2000, plus 30% to cover both expected inflation and the average cost of the transfer from the central government’s payroll to the payrolls of the regional governments of the officials employed by the cen-tral government in the regions;9 and
• the annualised amount of Inpres grants received by the local govern-ment in FY2000, plus 10% to cover expected inflation.
The total of the basic allocation, summed over all local governments, was Rp 40 trillion. This allocation clearly involved past history rather than the fis-cal gap formula in Regulation 104/2000, and had the purpose of ensuring that local governments were financially com-pensated for the new functions trans-ferred to them. A further amount, equal to Rp 0.4 trillion in total, was allocated equally among all local governments. The fiscal gap formula was used to allo-cate only Rp 10 billion—just 18.5% of the Rp 54.5 trillion of DAU payments made to local governments in 2001—and this amount was allocated using an amended version of the formula. The main amendment was that if the esti-mated fiscal gap was negative, that is, if estimated need was less than estimated economic potential, then the amended formula amount was set to zero.
Lewis (2001: 329–30) estimates that in aggregate, and given the increases in shared tax and natural resource reve-nues, the DAU allocations to local gov-ernments in 2001 were far in excess of what was needed. According to the es-timates in his table 2, a total DAU allo-cation of Rp 28.7 trillion would have been sufficient to finance the functions transferred from the centre, given local governments’ own revenues and the greatly increased amounts of shared tax and natural resource revenues that they received. This is only 53% of what they actually received.
Lewis notes that his calculation de-pends on factors not known with any certainty, and that, since shared reve-nues were allocated very unequally among local governments, what is true in aggregate was probably not true for every individual local government. In particular, the amount of DAU pay-ments allocated to some local gov-ernments with few natural resources was probably not enough to finance
their new functions and pay the 15% increase in the wages of government of-ficials that had been decreed by the cen-tral government. For this reason, the central government set up a Contingen-cy Fund from which allocations of Rp 2.8 trillion were made in 2001 to re-gional governments that might other-wise not have been able to meet the salaries of the officials that were trans-ferred to them from the central govern-ment’s payroll.
In the case of provinces, 80% of the DAU payments available in 2001was al-located in proportion to receipts of SDO and Inpres grants in 2000; the remain-der was allocated according to a fiscal gap formula that was similar to that ap-plied to local governments. However, the provinces were treated much less generously than local governments: the total DAU allocation to them in 2001 was only Rp 6.1 trillion, whereas their annu-alised receipts of SDO and Inpres grants in 2000 had been Rp 7.7 trillion (Lewis 2001: 328–9). Nevertheless, both the re-sulting revenue shortfall and the cost of their new functions were slightly more than offset, on average, by their in-creased receipts of shared tax and non-tax natural resource revenues (Lewis 2001: 330).
DAU ALLOCATIONS IN 2002
This section describes how the Ministry of Finance (MOF) interpreted the fiscal gap formula in making DAU allocations for 2002; how it modified this formula to produce a less revolutionary outcome, the ‘original’ formula; and how the gov-ernment was forced to amend the origi-nal formula so as to deviate still less from the status quo. Because of the complex-ity of these formulas, it would have been impossible for local governments to check their entitlements or find out what action they would need to take to raise them. However, it is possible to solve the
complex algebra in the official formulas and calculate the numerical values of the coefficients on each of the variables in these formulas. These coefficients, mea-sured in billions of rupiah of DAU payments per unit of the relevant vari-able—area, population, natural resource revenue and so forth—are presented in table 2 and discussed in the next section. The detailed algebra of the various for-mulas is available in the technical appen-dix to this paper.
A useful minor reform that would increase the transparency of the decen-tralisation procedures would be for the MOF to calculate and announce the cor-responding coefficients in future years, and tell each local government the val-ue, according to the MOF’s database, of each of the formula variables for that local government area. Since the formu-las are linear, the local government would be able to add up the contribu-tion of each variable—that is, the level of the variable multiplied by the relevant coefficient—and obtain the MOF’s esti-mate of its DAU entitlement. This reform would also help to combat the problem of unreliable data: if the local govern-ment felt that the MOF’s data understat-ed the extent of the poverty of its citizens, for example, it would be able to protest and produce whatever evi-dence it could to support its case.
In accordance with Law 25/1999 and Regulation 104/2000, the MOF defined the fiscal gap for each local government in 2002 as the difference between its fis-cal need and its economic potential. An exactly analogous procedure was used for allocating the 10% of DAU payments earmarked for provinces. In 2002, eco-nomic potential was defined as the sum of shared tax revenue, 75% of shared revenue from natural resources, and the estimated value of own-tax revenue from a regression of own-tax revenue on GDP in the services sector. The reason
for using regression analysis, rather than the actual value of own-tax resources in the previous year, was to avoid penalis-ing local governments that had succeed-ed in collecting relatively high levels of revenue relative to the potential tax base, which was regarded as being primarily GDP in the services sector.10 The actual
amount of own-tax revenue was not used in calculating general purpose grants. The weight of 0.75 on revenue from natural resources is not mentioned in Regulation 104/2000. It was presum-ably adopted in the hope of forestalling protests from regions with abundant natural resources that their newly ac-quired shared revenue from these re-sources was being clawed back by the DAU formula.
The formula for economic need was defined as a weighted average of index-es of four variablindex-es: population, area, poverty and prices. Poverty was mea-sured as the ‘expenditure gap of the poor’, defined as the proportion by which the average expenditure of poor people in the local government area was below the poverty line.11 The price
in-dex used was the cost of constructing government buildings. Regulation 104/ 2000 does not define poverty and, in the present context of determining the grant for each local government, the expendi-ture gap is a very unsatisfactory mea-sure of poverty. Two local government areas, in each of which the average ex-penditure of those below the poverty line is 90%, would both have expendi-ture gaps of 10% and would therefore receive the same allocations on account of poverty, even though the numbers of poor people in each local government area might be vastly different. An exam-ple of the very unsatisfactory way in which this worked out in practice in 2002 is given in the next section.
The treatment of prices in the formu-la for need can also be criticised, as
Lewis (2001: 332) notes. Rather than in-cluding a price index as one term in a linear equation for need, the appropri-ate way of allowing for cost differences among regions is to make each region’s monetary need directly proportional to the cost of providing government ser-vices.
The MOF initially proposed allocat-ing DAU payments among local govern-ments in 2002 using a formula that put relatively little weight on the fiscal gap formula in Regulation 104/2000, and that set this fiscal gap to zero if it would otherwise have been negative. The pro-posal also took account of wage and sal-ary payments to local government officials in 2001 and included a ‘flat-rate’ amount for every local government, that is, an amount that was independent of population, area or any other variable. This proposal came to be known as the ‘original’ formula because it was subse-quently modified in response to intense political opposition from the resource-rich regions (Hofman, Kadjatmiko and Kaiser 2002).
Because 11 provinces and 72 local governments would have received low-er DAU payments in 2002 undlow-er the original formula than they had received in DAU and Contingency Fund pay-ments in 2001, this formula generated strong political opposition. The govern-ment was thus obliged to adjust it to ensure that every local government re-ceived at least as much in 2002, in nom-inal terms, as it had in 2001. This adjustment was referred to as the ‘no harm’ clause. It involved comparing the amount given by the original formula with the total amount of DAU and Con-tingency Fund revenue that each local government had received in 2001. If the formula amount was less than the grants received in 2001, the formula was ig-nored and the local government re-ceived the same nominal amount as it
had in 2001. This is the sense in which local governments were unharmed, at least in nominal terms. Henceforth, the 72 local governments to which the no harm clause applied are called the ‘no harm group’, while the remaining 264 are called the ‘formula group’.
The total cost of applying the no harm clause—that is, the sum of the amounts by which the DAU transfers to all local governments in the no harm group un-der the original formula were below what they had received in 2001—was Rp 2,851 billion. This was met partly from additional central government transfers, in the form of the Balancing Fund (Dana Penyeimbang) of Rp 855 billion, and partly by clawing back 22% of the amount that each local govern-ment in the formula group stood to gain under the original formula.12
THE PROPERTIES OF THE AMENDED FORMULA
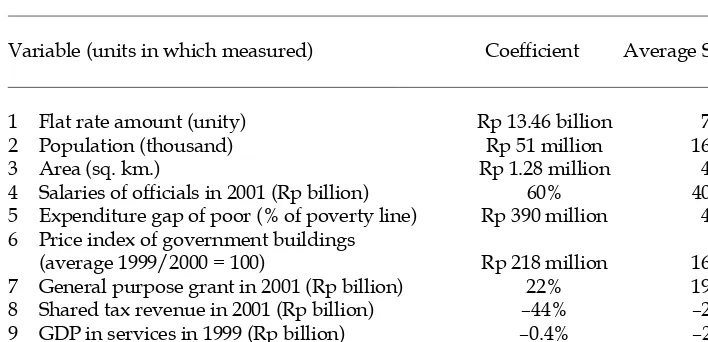
The description in the preceding section of the amended formula can be sum-marised and simplified by calculating the numerical values of the coefficients on each of the variables included in it. These coefficients, measured in billions of rupiah of DAU payments per unit of the relevant variable, are reported in ta-ble 2 for local governments in the for-mula group, that is, those to which the formula rather than the no harm clause applied. For local governments to which the no harm clause applied, the general purpose grant was of course exactly equal in nominal terms to what it had been in 2001. The last column of table 2 shows the average share of each vari-able, defined as the sum of its contribu-tion (coefficient x variable) for all local governments in the formula group as a percentage of the total DAU and Balanc-ing Fund payments for the formula group local governments.13 The
remain-der of this section summarises several
important implications that follow im-mediately from this way of describing the amended formula.
The Proportion of General Purpose Grants Allocated Using the Fiscal Gap Formula
Under the MOF’s original formula for 2002, the share of grants allocated using the fiscal gap formula itself would have been 40%; another 10% would have been allocated as flat-rate payments to each local government and the remaining 50% would have been allocated in pro-portion to spending on the wages and salaries of officials.14 The growing
im-portance of the fiscal gap formula in grant allocation is shown by the fact that the corresponding proportion for 2001 was only 20% but will be 60% in 2003.
However, these estimates overstate the importance of the fiscal gap formu-la because they ignore the effects of the no harm clause. In 2002, 22% of general purpose grants were allocated to local governments in the no harm group. The fiscal gap formula was irrelevant to the size of these grants, which were simply equal to what each of these local gov-ernments had received in 2001. In addi-tion, the importance of the fiscal gap formula was reduced even for local gov-ernments in the formula group, because the no harm clause was partly financed by clawing back 22% of the gains of lo-cal governments in the formula group. The data in table 2 can be used to take account of these problems and derive a corrected estimate of the importance of the fiscal gap formula.
The variables in table 2 that are part of the fiscal gap formula are population, area, poverty, prices, GDP in services, and shared tax and natural resource reve-nues. The sum of the shares of these vari-ables is 35%, which means that 35% of the general purpose grants received by local governments in the formula group
can be attributed to the fiscal gap formu-la itself. Since 78% of general purpose grants were distributed to local govern-ments in the formula group, and since the formula did not affect the amounts re-ceived by those in the no harm group, this means that 27% of general purpose grants can be attributed to variables in the fiscal gap formula in 2002.
The Employment Subsidy
Local governments in the formula group received an extra Rp 60 million in gen-eral purpose grants for every Rp 100 mil-lion spent on the wages and salaries of local government officials in the previ-ous year. If local governments were free to hire and retrench local government officials, if they fully understood the grants formula, and if they expected the present formula to be maintained, this would amount to a 60% subsidy on the employment of local government offi-cials. Of course the ‘ifs’ do not exactly hold. Nevertheless, if the weight of the
fiscal gap formula, which does not in-clude wages and salaries, were substan-tially increased, as some MOF officials have proposed, the implicit subsidy on employing officials would fall, and the incentives for local governments not to make new appointments and to search for ways of retrenching existing employ-ees would become much greater than they now are.
The Claw-back of Shared Tax and Natural Resource Revenues
For local governments in the formula group, general purpose grants were re-duced by 44% of their shared tax reve-nue. Since the shared revenue from natural resources receives a weight of 0.75 in the MOF’s measure of economic potential, its marginal effect on grants was only three-quarters of this, or –33%. These coefficients can be read directly off the amended formula in table 2.
The possibility that the way of allo-cating general purpose grants would TABLE 2 Amended Formula for DAU and Balancing Fund Payments
to Local Governments in the Formula Group, 2002a
Variable (units in which measured) Coefficient Average Share (%)
1 Flat rate amount (unity) Rp 13.46 billion 7
2 Population (thousand) Rp 51 million 16
3 Area (sq. km.) Rp 1.28 million 4
4 Salaries of officials in 2001 (Rp billion) 60% 40 5 Expenditure gap of poor (% of poverty line) Rp 390 million 4 6 Price index of government buildings
(average 1999/2000 = 100) Rp 218 million 16
7 General purpose grant in 2001 (Rp billion) 22% 19
8 Shared tax revenue in 2001 (Rp billion) –44% –2
9 GDP in services in 1999 (Rp billion) –0.4% –2
10 Shared natural resource revenue (Rp billion) –33% –1
aThe formula group of local governments is all districts and municipalities to which the no
harm clause does not apply (see text). The average share of each variable is the sum of its contribution (that is, coefficient x variable) for all local governments in the formula group as a percentage of the total DAU and Balancing Fund payments for these local governments.
claw back some of the shared natural resource revenue was noted by McLeod (2000: 37):
… the gain to resource rich provinces and districts/municipalities from natural resource revenues could be largely offset if their proportional entitlements to the general funds allocation are set at a low level pre-cisely because of their large resource endowments.
However, McLeod was writing be-fore the no harm clause had been intro-duced. The effect of this clause is to prevent the claw-back of shared reve-nue from applying to local governments in the no harm group. This means that the claw-back generally does not apply to the resource-rich local governments because the claw-back itself usually makes the amount they would have re-ceived under the original formula less than the amount they received in 2001. Strong evidence for this is given by the fact that the average amount of shared natural resource revenue per region in the formula group is Rp 7 billion, where-as the average per region in the no harm group is Rp 104 billion.
The Bias in Favour of Fragmentation of Regions
The central government presumably does not intend to subsidise the frag-mentation of regions, but the inclusion of the flat rate amount in the amended DAU formula has this effect. A possible rationale for the flat-rate amount in the amended DAU formula is that there is a certain minimum cost of administering any local government area, and the flat-rate amount is intended to cover it. The flaw in this argument is that it postu-lates that fragmentation raises adminis-trative costs, but proposes that local governments should be able to pass all these costs on to the centre, even though they have a large say in determining
whether or not fragmentation occurs. In 2003, the subsidisation of fragmentation has been increased by using specific pur-pose grants from the DAK to allocate Rp 4 billion to each new district to cov-er start-up costs.
The amended formula in table 2 al-lows one to quantify the extent of the incentive for fragmentation provided by the amended formula. The local govern-ment area in the formula group with the largest population is the district of Tangerang (part of Greater Jakarta) with a population of 2.8 million. This is 76 times the population of the smallest lo-cal government area in the formula group, the district of Malinau in East Kalimantan with a population of 36,000. On a per capita basis, the flat-rate amount in the amended formula, which is Rp 13.46 billion per local government, therefore provides Malinau with 76 times as large an allocation per capita as that provided for Tangerang: Rp 369,000 per person in Malinau com-pared with about Rp 5,000 per person in Tangerang.
The flat-rate amount is not the only term in the amended formula that pro-vides an incentive for regions to frag-ment; the way in which the formula allows for poverty and the price of gov-ernment buildings has the same effect. This can be seen by noting that if a local government area were to split into two identical halves, each of the new small-er local govsmall-ernments would receive the same absolute amount as the original area on account of the flat-rate amount, poverty and the price of government buildings, whereas for the other seven terms in the amended formula— population, area, salaries of officials, general purpose grants in the previous year, shared tax revenue, shared natu-ral resource revenue and GDP in services—the two new local govern-ments would each receive half of what
the original local government had re-ceived. The estimates reported in the last column in table 2 imply that 28% of the general purpose grant of an average lo-cal government in the formula group is attributable to the flat-rate amount, the expenditure gap of the poor and the price index of government buildings. It follows from this that if an average lo-cal government area were to split into two identical halves, the total general purpose grants of the two new local gov-ernments would be 28% more than the total general purpose grant received by the original local government.15
The incentives for fragmentation pro-vided by the DAU allocation formulas are exacerbated by the formulas for the allocation of shared tax and natural re-source revenues. As noted earlier (at the end of the section on regional govern-ment revenue), table 1 demonstrates that these other formulas also favour small local government areas over larger ones. The reasons are essentially the same as for the DAU: these other formulas also allocate part of the revenue to be shared equally among all local government ar-eas, without taking account of their dif-ferent population sizes.
There are many possible reasons for the fragmentation that has been occur-ring among local government areas and provinces. Some may well be more im-portant than the incentive to fragment provided by the formulas for allocating DAU and other shared revenue. But even if this is true, it would clearly be sensible for the central government to stop subsidising fragmentation.
Unequal Treatment of Poverty in Different Regions
The way in which the formula for gen-eral purpose grants treats poverty is very unsatisfactory. This can be demon-strated by comparing how much partic-ular local governments receive on
account of poverty, that is, the amount received under item 5 in table 2, ex-pressed relative to the number of poor people in the local government area. The unsatisfactory treatment of poverty can be illustrated by comparing the district of Jember in East Java with the munici-pality of Denpasar in Bali. These two local government areas are chosen to highlight the weaknesses of the amend-ed formula in allowing for poverty.
Poverty in Denpasar is negligible compared to poverty in Jember: Den-pasar has a population of 523,000 of whom only about 1% are in poverty, whereas Jember has a population of 2.2 million of whom 46% are in poverty. The poverty gap measure of poverty tells the same story: the poverty gap in Jember is 8.7% whereas that in Denpasar is only 0.23%. However, the amended formula makes the payment on account of mea-sured poverty directly proportional to the expenditure gap, which is the amount by which the average expendi-ture of poor people is below the pover-ty line, expressed as a percentage of the poverty line. The expenditure gap is the ratio of the poverty gap to the propor-tion of the populapropor-tion in poverty (see note 11). In Denpasar the expenditure gap is therefore 23% of the poverty line, whereas in Jember it is only 19%. Since Denpasar and Jember are both in the formula group, and since the amended formula allocates Rp 390 million to these local governments for each percentage point by which the average incomes of poor people are below the poverty line (see table 2), it allocates Rp 9.0 billion to Denpasar on account of poverty, but only Rp 7.4 billion to Jember. On a per poor person basis, this is equivalent to Rp 1.7 million for each poor person in Denpasar, but only Rp 8,000 for each poor person in Jember! Admittedly, the average expenditure of poor people in Denpasar is estimated to be 5% less than
in Jember, but this could scarcely justify allocating over 200 times as much per poor person to Denpasar as to Jember.
The bizarre implications of the formu-la documented here result from the fact that the expenditure gap does not de-pend on the number of poor people in an area, but only on the proportion by which the expenditure of the average poor person in the area falls short of the pov-erty line. If two areas have the same poverty headcount rate, and if the aver-age expenditure of poor people in the two areas is equal, the DAU formula would give each of them the same total amount of money on account of pover-ty, whatever their total populations. But if one of the areas contained 10 times as many people as the other, it should pre-sumably receive 10 times as much as the other on account of poverty, since it con-tains 10 times as many poor people, and since the poor people in both areas are equally poor on average.
Do Central Government Transfers Reduce Horizontal Imbalances?
The studies by Lewis (2001) and Hof-man, Kadjatmiko and Kaiser (2002) sug-gest that the DAU reduces horizontal imbalances. Lewis (2001) took as each government’s base revenue the fitted value of own-source per capita revenue from a regression in which the explana-tory variables are per capita GDP and a dummy for municipal (as opposed to district) status. He then calculated the effects on the inequality of per capita local government revenue in 2001—as measured by the coefficient of variation, the standard deviation of the logarithm and the Gini coefficient—of adding, one by one, the remaining components of per capita local government revenue. All three inequality measures are reduced when shared tax revenue is added to fit-ted own-source revenue; all three are raised very substantially by then
add-ing shared natural resource revenue; and all three are reduced by then add-ing per capita DAU payments. Table 8 in Hofman, Kadjatmiko and Kaiser (2002) broadly confirms Lewis’s results for 2001 and their table 9 shows a simi-lar pattern for 2002.
On the basis of these findings, it seems likely that the DAU did indeed help to reduce horizontal fiscal inequalities in both 2001 and 2002. It would probably have been a stronger force for equalisa-tion if a weight of unity rather than 0.75 had been put on natural resource reve-nue in the measure of economic poten-tial, and if the original DAU formula had not been replaced by the amended for-mula. The reason is that shared natural resource revenue increases horizontal inequalities, and both these amend-ments to the DAU formula reduce the extent to which it claws back shared nat-ural resource revenue. However, it does not follow that these more equalising policies should have been chosen. The adoption of a fully equalising DAU for-mula would have resulted in the shar-ing of natural resource revenue among regions in proportion to their fiscal need, net of their other revenue sources and without regard to the geographical lo-cation of the natural resources. Such a formula for the DAU would have fully clawed back natural resource revenue from the resource-rich regions and thus made a mockery of the clear intention in Laws 22 and 25 of 1999 that regions should receive at least some of the reve-nue from their natural resources.
SUMMARY
This article distinguishes among three formulas for allocating general purpose grants in 2002: the fiscal gap formula foreshadowed in Law 25/1999 and set out in Government Regulation 104/ 2000; the original formula proposed by the MOF, which was a weighted
age of the fiscal gap formula, a flat-rate amount for every local government area (regardless of size) and the wage and salary bill of officials in the previous year; and the amended formula that the government was obliged to adopt in the face of intense lobbying from the re-source-rich provinces, whose natural resource revenue would have been par-tially clawed back by both the other for-mulas. The analysis of these formulas showed that there is a common thread linking the various changes that were made to the fiscal gap formula in order to arrive at the amended formula actu-ally used to allocate general purpose grants: all these changes helped to pre-serve the historical pattern of grant al-location.
It was also argued that each of these formulas contains defects that were un-necessary in the sense that they were not forced on the government by political pressure. They allow for differences in costs among local government areas in an additive way, whereas such differ-ences should be allowed for in a multi-plicative way: if prices in one area are double those in another, the former area needs twice the revenue of the latter, everything else being equal. The same criticism applies to the way in which the formulas allow for population differenc-es: other things being equal, an area that contains twice as many people as anoth-er should receive twice as large a grant. Instead, all three formulas make grants a linear function of several variables, of which population is only one. In the case of poverty, the failure to take proper ac-count of population size means that in some cases areas containing hundreds of thousands of poor people receive less than areas containing only a few thou-sand poor people. Denpasar, where only about 5,000 people are below the pover-ty line, received a slightly larger share of the DAU on account of poverty than
Jember, where almost a million people were below the poverty line!
More important than the relatively minor defects of the various formulas is that the decentralisation of decision making has been greatly limited by the central government’s retention of con-trol over all the major tax bases. This ef-fect has been reinforced by the fact that those expenditures that have been de-centralised are mainly routine expendi-tures over which regional governments have little discretion.
In any fairly stable system for allocat-ing central government grants to region-al governments, the amounts received annually by each individual regional government will be closely related to what was received in the previous year. The shares of each region in the total may alter to reflect inflation, growth and special factors, but are unlikely to alter greatly between one year and the next. In apparent contradiction of this rule, Indonesia’s adoption of a new grants formula in 2001 and 2002 had the po-tential to disrupt the old system. Sub-stantial changes were desired, but the changes that would have resulted from applying the fiscal gap formula in Reg-ulation 104/2000—which inevitably used imperfect proxies of need and po-tential—would have made it impossible for some regions to provide basic servic-es or to go on paying their employeservic-es. It was therefore impracticable to distrib-ute all grants according to any simple formula and to ignore completely the historical pattern of grants among re-gions that had resulted from political competition for grants over many years. The fiscal gap formula had to be modi-fied to increase the influence of the sta-tus quo in the pattern of grant allocation. This greatly assisted the resource-rich regions, whose new shared revenues would otherwise have been clawed back by the reductions in their general
pose grants that would have resulted from allocating all grants according to a fiscal gap formula that fully included natural resource revenue in economic potential.
It would be an exaggeration of the extent to which the status quo has been preserved to say that the 1999 decentral-isation laws have not greatly changed the numbers of officials employed in the regions, or what they do, but have merely resulted in the officials who used to be employed by the central govern-ment’s deconcentrated agencies now receiving their salaries from regional governments, which in turn receive in-creased grants from the centre. The most important change to the status quo that this too cynical view of decentralisation omits is the increased autonomy that resource-rich regions have acquired as a result of having much of their natural resource revenue returned to them by the central government.
However, the exaggeration contains an important element of truth: as long as the resource-poor regional govern-ments are dependent on grants from the central government for almost 80% of their funding, they will not be genuine-ly autonomous. To realise the potential for decentralisation to make govern-ments more cost-efficient and more sen-sitive to local aspirations, regional governments need genuine autonomy. The resource-poor regions will only achieve this if the central government reduces their dependence on grants by allowing them to set the rates of one or more major tax bases, administer the collection of the revenue, and then re-tain all the revenue collected. The main candidate for decentralisation is the property tax (Lewis 2003a). Ryder (2003) argues strongly that it would be feasible and desirable to partially de-centralise the income tax by allowing each regional government to add its
chosen percentage rate, applicable only to the incomes of its own residents, to the income tax rates set by the central government.
NOTES
* I am grateful for helpful comments from two referees, many ANU colleagues and, especially, Blane Lewis. All remaining errors are mine.
1 Decentralisation policies during the New Order period are described in Qureshi (1997) and Silver, Azis and Schroeder (2001). Paauw (1955) describes the limit-ed but nevertheless significant extent of self-finance by local governments in West Java and Central Sumatra during the Sukarno period.
2 All the laws and government regulations mentioned in the present article can be found at http://www.gtzsfdm.or.id. 3 The property tax is officially classified as
a central government tax, not a local gov-ernment one. Its rate is set centrally but its administration is shared between the central government and each local gov-ernment (Lewis 2003a). For every Rp 100 of gross revenue from the property tax, the central government retains Rp 10 to cover administration costs and returns the rest to regional governments. How-ever, the source local government itself receives only Rp 64.8, with the remain-ing Rp 25.2 goremain-ing to provinces and other local governments. In addition, as ex-plained in the discussion of table 2, 44% of all shared tax revenue is usually clawed back by the central government in the form of reduced eligibility of local governments for general purpose grants. For the 79% of all local governments to which this claw-back applied in 2002, the source local government therefore re-ceived only Rp 36.3 (56% x Rp 64.8) after the claw-back in the formula for general purpose grants. As a fraction of the prop-erty tax revenue net of administration costs, this is only 40% (Rp 36.3 ÷ Rp 90). In contrast, local governments retain 100% of the net revenue raised by genu-inely local taxes.
4 Bird and Vaillancourt (1998: 3) define
‘deconcentration’ as the dispersion of re-sponsibilities within a central govern-ment to regional branch offices or local administrative units, and ‘devolution’ as the transfer to local governments of both the implementation of government deci-sions and the authority to decide what is done. They define ‘decentralisation’ to include deconcentration, devolution and also delegation (having local govern-ments act as agents of the centre). In con-trast, this article follows the Indonesian practice of defining it to mean what Bird and Vaillancourt call ‘devolution’. Thus the ‘deconcentrated agencies’ of the cen-tral government are its provincial offices (kanwil) and its local offices (kandep). The ‘decentralised agencies’ of regional gov-ernments are those that are financed by regional governments and answerable to them. This is also the usage adopted by Alm, Aten and Bahl (2001: 84–5). 5 Silver, Azis and Schroeder (2001) give a
detailed analysis of the Inpres grants. Both the SDO and Inpres had elements of specific grants and of general purpose grants (Lewis 2003b).
6 The Balancing Fund (‘Dana Penyeim-bang’) should not be confused with the ‘Dana Perimbangan’ (often translated as ‘Balance Fund’), which is the name giv-en by Article 6 of Law 25 to the total of grants, shared taxes and shared natural resource revenues transferred by the cen-tral government to regional govern-ments.
7 The English translations of articles 17(3) and (4) are taken from the gtzsfdm web-site (see note 2).
8 Before 2000, Indonesian financial years ran from 1 April to 31 March. Since 2001, the financial and calendar years have coincided. The transitional financial year was 2000, which ran from 1 April to 31 December. The annualised amounts of SDO and Inpres allocations in FY2000 were the actual amounts received, mul-tiplied by 12/9.
9 High school teachers comprised the larg-est group of officials transferred to re-gional government payrolls. The next largest groups transferred were admin-istrative officials and health sector
em-ployees. Teachers in elementary schools had already been transferred to regional payrolls under the decentralisation re-forms of the early 1990s.
10 The MOF’s choice of GDP in services, rather than total GDP or GDP in some other sector, as its proxy for potential lo-cal tax revenue was probably driven by the fact that six of the seven taxes on the positive list of local government taxes specifically approved by Law 34/2000 are taxes on services: hotels, restaurants, entertainment, advertising, parking and electricity consumption (known as the ‘street lighting tax’, since the revenue is earmarked for street lighting). The sev-enth tax on the list is mining.
11 The ‘expenditure gap’ is not the same as the more familiar ‘poverty gap’. When poverty is measured by expenditure rath-er than income, as in Indonesia, the pov-erty gap, or Foster–Greer–Thorbecke P1
index (Foster, Greer and Thorbecke 1984; Ravallion 1992), is equal to the ratio (a)/(b), where (a) = number of poor people x [per capita expenditure at the poverty line – average per capita expen-diture of the poor], and (b) = total popu-lation x per capita expenditure at the poverty line. Since the headcount pover-ty rate is the ratio of the number of poor people to the total population, it follows that the expenditure gap is equal to the poverty gap divided by the proportion of the population below the poverty line. 12 For the formula group, the total of the excess of the original formula amounts over the grants received in 2001 was Rp 9,170 billion. By clawing back 21.8% of this, the central government saved Rp 1,996 billion. Together with the Bal-ancing Fund of Rp 855 billion, this was just enough to provide the Rp 2,851 bil-lion needed to pay local governments in the no harm group the difference be-tween what they had received in 2001 and what they would have received un-der the original formula.
Yet one more adjustment was actually made to take account of the creation of 12 new municipalities in 2002. In calcu-lating the general purpose grants for the new municipalities, the MOF allocated
each a separate flat-rate amount and correspondingly reduced the flat-rate amounts that would have been payable under the amended formula. The remain-ing allocations to the new municipalities (that is, those for wages and salaries and the fiscal gap) were deducted from the corresponding allocations under the amended formula to the local govern-ments that they had originally been part of, thus again leaving the cost to the cen-tral government unchanged (Hofman, Kadjatmiko and Kaiser 2002).
13 In any linear relationship, such as the amended formula G′′ = α + ΣβjXj, the elasticity of G′′ with respect to Xj is βjXj/ G′′. Therefore, the average share of each variable is equal to the elasticity of gen-eral purpose grants with respect to that variable, evaluated at the sample mean. 14 The fiscal gap formula is given by equa-tions (1), (2), (3) and (4) in the technical appendix. The proportions in the origi-nal formula that are attributable to the fiscal gap formula, flat-rate payments, and wages and salaries of officials are the coefficients of these variables in equation (6′) of the technical appendix.
15 As described in note 12, the MOF gave the 12 new municipalities created in 2002 an additional flat-rate amount, but de-ducted their remaining DAU allocations from those of the local governments that they used to be part of. However, if the 2002 procedures are maintained, the 12 new municipalities will be treated like all other local governments, and will there-fore be given separate allocations for each variable in the formula, including pov-erty and the price index for buildings.
REFERENCES
Alm, James, Robert H. Aten and Roy Bahl (2001), ‘Can Indonesia Decentralise Suc-cessfully? Plans, Problems and Prospects’, Bulletin of Indonesian Economic Studies 37 (1): 83–102.
Bird, R.M., and F. Vaillancourt (1998), ‘Fis-cal Decentralization in Developing Coun-tries: An Overview’, in R.M. Bird and F. Vaillancourt (eds), Fiscal Decentralization in Developing Countries, Cambridge Uni-versity Press, Cambridge (UK).
Foster, James, J. Greer and Erik Thorbecke (1984), ‘A Class of Decomposable Pover-ty Measures’, Econometrica 52: 761–6. Hofman, Bert, Kadjatmiko and Kai Kaiser
(2002), Evaluating Indonesia’s Fiscal Equalization, available from World Bank Office, Jakarta, mimeo.
Lewis, Blane D. (2001), ‘The New Indonesian Equalisation Transfer’, Bulletin of Indone-sian Economic Studies 37 (3): 325–43. Lewis, Blane D. (2003a), ‘Property Taxation
in Indonesia: Measuring and Explaining Administrative (Under-)Performance’, Public Administration and Development 23 (3), forthcoming.
Lewis, Blane D. (2003b), ‘Indonesia’, in Paul Smoke (ed.), Intergovernmental Fiscal Transfers in Asia, Asian Development Bank, Manila.
Lewis, Blane D. (2003c), ‘Tax and Charge Creation by Regional Governments: Esti-mates and Explanations’, Bulletin of Indo-nesian Economic Studies 39 (2): 177–92 (in this issue).
McLeod, Ross H. (2000), ‘Survey of Recent Developments’, Bulletin of Indonesian Eco-nomic Studies 36 (2): 5–40.
Paauw, Douglas S. (1955), ‘The Role of Local Finance in Indonesian Economic Devel-opment’, Ekonomi dan Keuangan Indonesia 7 (1): 2–24.
Qureshi, Zia (1997), ‘Fiscal Transfers in In-donesia’, in Ehtisham Ahmad (ed.), Fi-nancing Decentralized Expenditures: An International Comparison of Grants, Edward Elgar, Cheltenham (UK) and Brookfield VT.
Ravallion, Martin (1992), ‘Poverty Compari-sons: A Guide to Concepts and Methods’, Living Standards Measurement Study, Working Paper No. 88, World Bank, Washington DC.
Ryder, Mark (2002), The Estimated Revenue Yield from a Piggyback Personal Income Tax, Mid-term Report to the Directorate of Regional Revenue, Ministry of Finance, Republic of Indonesia, 12 August, Jakarta, mimeo.
Silver, Christopher, Iwan J. Azis and Larry Schroeder (2001), ‘Intergovernmental Transfers and Decentralisation in Indone-sia’, Bulletin of Indonesian Economic Studies 37 (3): 345–62.
TECHNICAL APPENDIX
The fiscal gap for each local government is defined to be the difference between its fiscal need and its economic poten-tial:
the subscript i indicates local govern-ment i;
Fi is the fiscal gap;
Xi is fiscal need; and
Ci is economic potential.
In 2002, economic potential was de-fined as the sum of shared tax revenue, 75% of shared revenue from natural re-sources and the estimated value of own-tax revenue from a regression of own-own-tax revenue on GDP in the services sector:
i
Ri is shared tax revenue in billions of rupiah;
Si is shared natural resource revenue in billions of rupiah; and
T ˆ i is the fitted value of own-tax
rev-enue in billions of rupiah from a re-gression of own-tax revenue on GDP originating in the services sector. The estimated regression, with all variables measured in billions of rupiah, was: vices sector. The actual amount of own-tax revenue was not used in calculating general purpose grants.
In 2002, fiscal need was defined by:
Zi is population in thousands; a bar over a variable, as in Z , indi-cates the unweighted average value of that variable for all local govern-ments;
Ai is area in square kilometres;
Qi is the expenditure gap of the poor, defined as the amount by which the average expenditure of poor people in the local government area was be-low the poverty line, expressed as a percentage of the poverty line;
Pi is the price index for government buildings, indexed at 100 in 1999/ 2000 for Indonesia as a whole; and
α is a coefficient that the MOF set
equal to 166.32. It is measured in bil-lions of rupiah and is needed to ensure comparability between eco-nomic potential, which is also mea-sured in billions of rupiah, and fiscal need, which would otherwise be a pure number that would, on average, be equal to unity.
If the DAU had been allocated among local governments solely in proportion to the fiscal gap, the amount received by each would have been:
Σ
fiscal gap formula for general pur-pose grants, in billions of rupiah;
DΣ is the total amount of general pur-pose grants to be allocated to local governments in the form of DAU pay-ments in billions of rupiah (in 2002,
DΣ was 62,202.7); and
wi is the share of DAU payments
al-located to local government i under the fiscal gap formula.
The MOF’s original formula was:
G′
i=wi′ DΣ (5′)
where
G ′ iis the original formula amount for
general purpose grants in billions of rupiah;
DΣ is the total amount of general pur-pose grants to be allocated to local governments in the form of DAU pay-ments (as noted above, this amount was Rp 62,202.7 billion in 2002); and
w ′ iis the weight of local government
i in the original formula:
∑
∑
′′ + + = ′
i i i
i i i i
F F W W N
w 0.1 0.5 0.4 (6′)
where
N is the total number of local govern-ments in Indonesia;
Wi is the wage and salary bill of local government officials in 2001; and
F i′ is the fiscal gap in the original
for-mula, which was set to zero if the fis-cal gap given by equation (1) was negative:
} , 0 max{ i
i F
F′= . (1′)
It is clear from equation (6′)that the
sum of the weights is unity. This ensures that the sum, over all local governments, of the original formula amounts is equal to the total amount of DAU funding al-located to all local governments:
Σ
i G
′
i=DΣ=62,202.7. (7) The amended formula that the gov-ernment was obliged to implement in re-sponse to political pressure from the regions that would have received lower grants in 2002 under the original for-mula than they had received in 2001 is:
G′′
i= Gi
2001 + (1 – t) [max{0,G′
i – Gi
2001}] (5′′)
where
G′′
i is the amended formula, that is, the total amount (in billions of rupiah) of general purpose grants, in the form of DAU and Balancing Fund pay-ments, earmarked for local govern-ment i in 2002, before making the minor adjustment described in note 12 for the creation of 12 new munici-palities in 2002;
G2001i is the total amount (in billions of
rupiah) of general purpose grants, in the form of DAU and Contingency Fund payments, received by local government i in 2001; and
t is the proportion of the gains under the original formula, relative to 2001, that is clawed back by the amended formula; the value of t is 0.218. The value of t was chosen to ensure that the sum of G′′
i over all local govern-ments is the total amount of the DAU plus the total amount of the Balancing Fund:
Σ
i G
′′
i= DΣ+ BΣ =62,202.7
+ 854.7 = 63,057.4 (8)
where BΣ is the total amount of the Bal-ancing Fund paid to all local govern-ments, which is Rp 854.7 billion.