SWUP
Comparison of
ø
-insentive support vector regression and
ù
-support
vector regression in nonlinear regression problem
Veni Freista Hustianda, Santi Wulan Purnami, Sutikno
Department of Statistics, Institut Teknologi Sepuluh Nopember, Surabaya 60111, Indonesia
Abstract
The purpose of this study was to identify performance of ε -insentive estimation and ν
-estimation with linear kernel, gaussian radial basis function kernel, and polynomial kernel using support vector regression (SVR)-based modeling technique. This research use two type of data, public data and real data. The public data was about compressive strength in high performance concrete. Ever since, the term high-performance concrete was introduced into the industry, it had widely used in large-scale concrete construction that demands high strength, high flowability, and high durability. It consist of 181 experimentals point that collected from one sources (Lim, 2003). The public data was consist of 2 experimentals, the first public data was about compressive strength in 40-80 Mpa with 104 experimentals points and the second public data was about compressive strength in 80-120 Mpa with 77 experimentals points. While real data (Yoyok, 2012) was about slump flow in self compacting concrete. This data was consist of 18 observations. The results of this research showed that the best estimation for first public data (compressive strength 40–80 Mpa) was ε-insentive estimation with linear kernel that has prediction accuracy (bassed on pseudo-ü ) of 98.36%. While in the second public data (compressive strength 80–120 Mpa), the best estimation was ν-SVR with gaussian radial basis function kernel. It has prediction accuracy of 94.75%. For real data, it was also showed high prediction accuracy that reach 99.99% in coefficient of determination (ü ). Real data used ε-insentive estimation (based on previous research).
Keywords ε-insentive support vector regression, ν-support vector regression, kernel type
1.
Introduction
the SVR is based on the performance of the model generalization. In this study, grid search method used to select the parameters SVR by using the above three types kernel. This technique is done by putting a variety of parameter values, then choose a couple of parameters with the best accuracy. There are several types of estimation used in the method of SVR. SVR introduce a modified alternative loss function in the size range. There are four possible loss function, the quadratic loss function, least modulus, Huber, and ε –incentive. From that kinds of loss function, the one that is able to produce a support vector that spreads is ε -incentive loss function. Scholkopf (2000) introduces a new estimates in SVR method, namely ν-SVR. The main motivation in ν-SVR method is able to provide a more meaningful interpretation. ν-SVR shows the upper limit of error in training data and lower limits of the training data that called support vector.
Research before in Support Vector Regression has been done by (Peng, 2015) which used a Gaussian RBF kernel to predict the thermal hydraulic. The result was SVR give better predictions and also has the computation time shorter than ANN. (Bhavsar, 2014) used the linear kernel, polynomial, and RBF in SVR method in eight kinds of public data that show different results between linear kernel, polynomial, and the RBF at the level of accuracy. (Ramedani, 2014) compare Fuzzy Linear Regression method and SVR with RBF kernel where the results show that the SVR method has better prediction. In addition, (Cen, 2008) comparing the SVR method, Radial Basis Neural Network, and Multiple Linear Regression on gas chromatography retention where all three of these methods have a similar prediction ability, but SVR has a higher prediction than the prediction of both methods. Based on the above, this study is use Support Vector Regression with -SVR and ν-SVR estimation. Beside that, this research also use three type of kernel, Linear, polynomial, and a Gaussian Radial Basis Function to compare the results obtained by using above estimation. The data consists of two kinds of public data and real data. Public data (Lim, 2003) relates about compressive strength in high performance concrete. While the real data (Yoyok, 2012) relates about the slump flow in self compacting concrete.
2.
Materials and methods
2.1 Support vector regression
In -SVR (Vapnik, 1995), the goal is to find a function Ÿ that has at most deviation from the actually obtained targets for all the training data, and at the same time is as flat as possible. In other words, this loss function doesn’t care about errors as long as they are less than , but will not accept any deviation larger than this.
SVR linear model can be described by
= Ÿ = ý. Ÿ + þ, (1)
where Ÿ is regression function to be established, Ÿ is input vector dan ý is weight vector, and þ the constant (bias). In some input data can not be solved linearly and they must to be transformed in feature space (high dimension space). The SVR models become
y = f Ÿ = -ý.ϕ Ÿ . + b (2)
Flatness in the case of Eq. (1) or Eq. (2) means that one seeks a small ý. One way to ensure this is to minimize the norm ‖¸‖ . This problem as a convex optimization problem:
min12 ‖ ‖
subject to Êz − -ý.ϕ Ÿ . − b ≤ ε
SWUP The tacit assumption was that function above is feasible. But, it also want to allow for some error, therefore to cope with otherwise infeasible, one can introduce slack variables
, ∗. The formulation is become:
min, , , ∗ ‖ ‖ + ∑ + ∑7 ∗
# 7
# .
For the ν -Support Vector Regression (Scholkopf, 2000), ν parameter will be replaced parameter, so the formulation is described by
min, , , ∗ ‖ ‖ + • +7∑7 + ∗
#¼ –,
where 0 ≤ν≤ 1 and C is controlled parameter. Because of it difficult to define , so new parameter of νis introduced to control the number of support vector and error.
2.2 Method
2.2.1 Data
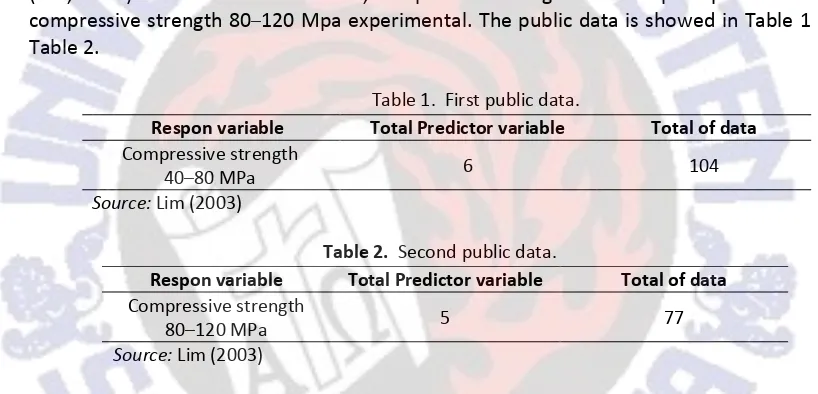
Data used in this research consist of two type, public data and real data. Public data (Lim, 2003) also consits of two data, compressive strength 40–80 Mpa experimental and compressive strength 80–120 Mpa experimental. The public data is showed in Table 1 and Table 2.
Table 1. First public data.
Respon variable Total Predictor variable Total of data
Compressive strength
40–80 MPa 6 104
Source: Lim (2003)
Table 2. Second public data.
Respon variable Total Predictor variable Total of data
Compressive strength
80–120 MPa 5 77
Source: Lim (2003)
First public data consist of 104 experimentals with 6 predictor variables: water to binder ratio X , water X , fine aggregate ratio X‰ , fly ash replacement ratio Xï , air-entraining agent content Xò , superplasticizer XÓ ,. But the second public data is consist of 77 experimentals with 5 predictor variables, water to binder ratio r , water r , fine aggregate ratio r‰ , fly ash replacement ratio rï , superplasticizer rò .
Real data (Yoyok, 2012), means that the data haven’t published yet and it take from observation directly. Real data is showed in Table 3. Real data consist of one respon variabel with 18 observations and 6 predictors: coarse agregate X , fine agregate X , cement
X‰ , silica fume Xï , water Xò , dan SP XÓ .
Table 3. Real data.
Respon variable Total Predictor variable Total of data
Slump flow 6 18
2.2.2
Procedure
In the present study, a SVR-implementation known as -SVR and ν-SVR in the LIBSVM software library (Chang & Lin, 2001) has been used to develop the SVR-based model for slump flow. The LIBSVM package utilizes a fast and efficient method known as sequential minimal optimization for solving large quadratic programming problems. Mentioned below procedure was followed for estimating regression function using LIBSVM software:
1) Training data set—Choose an appropriate training set of input and output features - Public data, the data is devide into 2, training set and testing set based on 90%:10&
for training set and testing set. Therefore, for first public data, there are 10 testing set and 94 training set. While, second public data is consist of 8 testing set and 69 training set.
- Real data, the all data is used for training data because of fewer data.
2) Scaling—Conduct linear scaling of each data attribute to the range [0, 1] in order to avoid data in greater numeric ranges to dominate those in smaller numeric ranges
3) Kernel selection—there are 3 type of kernel, linear, gaussian RBF, and polynomial 4) Use the best parameters for establishment of regression function—Having given the
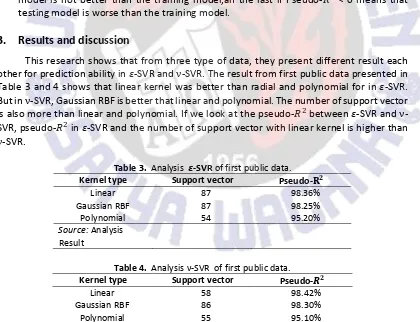
best estimated values of , , , and z, the best values of these parameters are obtained by using pseudo-ü . The procedure of pseudo-ü , When Pseudo-ü = 1, it means that testing model is perfect (model in testing data). If Pseudo-ü = 0, it means that testing model is not better than the training model,an the last if Pseudo-ü < 0 means that testing model is worse than the training model.
3.
Results and discussion
This research shows that from three type of data, they present different result each other for prediction ability in -SVR and ν-SVR. The result from first public data presented in Table 3 and 4 shows that linear kernel was better than radial and polynomial for in -SVR. But in ν-SVR, Gaussian RBF is better that linear and polynomial. The number of support vector is also more than linear and polynomial. If we look at the pseudo-ü between -SVR and ν -SVR, pseudo-ü in -SVR and the number of support vector with linear kernel is higher than ν-SVR.
Table 3. Analysis ;-SVR of first public data.
Kernel type Support vector Pseudo- F
Linear 87 98.36%
Gaussian RBF 87 98.25%
Polynomial 54 95.20%
Source: Analysis Result
Table 4. Analysis ν-SVR of first public data.
Kernel type Support vector Pseudo- F
Linear 58 98.42%
Gaussian RBF 86 98.30%
Polynomial 55 95.10%
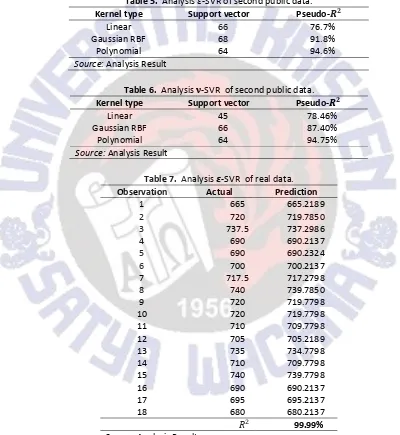
SWUP For second public data, the result is shown in Table 5 and Table 6. The result from second public data presented that polynomial kernel was better than radial and polynomial for in -SVR. Same with -SVR, polynomial is also better in ν -SVR. Beside that, the number of support vector is also same between both of estimation. From the research that has been done, it show that, prediction ability of each data is different and depends on the data.
For the real data, it used parameter that same with research before (Yoyok, 2012). Table 7 shows that coefficient of determination (ü ) for real data is very higt that reach 99.99%. Its better that research before that get ü 99.4% with the same parameters used.
Table 5. Analysis -SVR of second public data.
Kernel type Support vector Pseudo- F
Linear 66 76.7%
Gaussian RBF 68 91.8%
Polynomial 64 94.6%
Source: Analysis Result
Table 6. Analysis ù-SVR of second public data.
Kernel type Support vector Pseudo- F
Linear 45 78.46%
Acknowledgment
The authors would like to express their gratitude to the lecturer, Dr. Santi Wulan Purnami that has teaches and gives the knowledge about SVR. Beside that thanks the authors to Mr. Yoyok Setyo that has give the real data for this research.
References
Cen, H.-F (2008). Quantitative predictions of gas chromatography retention. Analytica Chimica Acta,
609, 24–36.
Chang, C.-C., & Lin, C.-J. (2002). Training v-support vector regression: Theory and algorithm. Neural Computation, 14, 1959–1977.
Chang, C.-C., & Lin, C.-J. (2003). LIBSVM: A library for support vector machines.
Chen, P.-H., Lin, C.-J., & Scholkopf, B. (2005). A tutorial on EMBED Equation. DSM4 Support Vector Machines, Computer Science dan Information Engineering Department. Taiwan.
Gunn, S. (1998). Support vector machine for classification and regression. Southempton.
Gandi, A.B., Joshi, J.B., Jayaraman, V.K., & Kulkarni, B.D. (2007). Development of support vector regression (SVR) based correlation for prediction of overall gas hold-up in bubble column reactors for various gas–liquid systems. Chemical Engineering Science, 62, 7078–7089.
Hetal, B., & Ganatra, A. (2014). Increasing efficiency of support vector machine using the Novel kernel function: Combination of polynomial and radial basis function. International Journal on Advanced Computer Theory and Engineering, 3(5), 2319–2526.
Lim, C.-H., Yoon, Y.-S., & Kim, J.-H. (2003). Genetic algorithm in mix proportioning of high-performance concrete. Cement and Concrete Research, 34, 409–420
Maalouf, M. (2009). Robust weighted kernel logistic regression in imbalanced and rare events data. Oklahoma.
Nehdi, M.C. (2001). Predicting performance of self-compacting concrete mixtures using artificial neural networks. ACI Mater. J., 98(5), 394–401.
Peng, H.X. (2015). Predicting thermal-hydraulic performances in compact heat exchangers by support vector regression. International Journal of Heat and Mass Transfer, 84, 203–213.
Ramedani, Z.M. (2014). A comparative study between fuzzy linear regression and support vector regression for global solar radiation prediction in Iran. Solar Energy, 109, 135–143.
Scholkopf, B. A. (2000). New support vector algoritms. Neural Computation, 12, 1207–1245.
Setyo, Y. (2012). Slump flow modelling of self compacting concrete using smooth support vecctor regression (SSVR).
Vapnik (1998). Statistical learning theory. New York: Wiley.