Magister of Mathematics Education Department FKIP Sriwijaya University
52
DEVELOPING INTERACTIVE MULTIMEDIA BASED PMRI APPROACH ON
PRESENTATION OF DATA MATERIALS
IN 9
THGRADE OF JUNIOR HIGH SCHOOL
Atika Zahra1, Ratu Ilma Indra Putri2
Sriwijaya University1,2
[email protected], [email protected]2
Abstract
This study aimed to develop interactive multimedia based PMRI on presentation of data with categorized valid, practical, and has potential effect. Development research study with two stages, preliminary and formative evaluation was applied. In preliminary stages, materials analysis and design interactive multimedia content was conducted based on the three principles and five characteristics of PMRI. Thus, the raw design of interactive multimedia or prototype will be produced. In the formative evaluation stages of the expert review, one to one and small group were conducted to obtain a valid and practical interactive multimedia. Next to find out, to see the potential effect of interactive multimedia that have been developed, field test conducted in 9-G grades of junior high school Xaverius 1 Palembang which consists of 29 students. Based on the analysis of tests on each of the steps taken by the students and the results of the analysis capabilities and the ability to apply acquired knowledge that students are able the materials and active learning, it can be concluded that interactive multimedia based PMRI approach on presentation of data that has been developed meets the criteria of a valid , practical and effective.
Key words: Development, Interactive Multimedia, PMRI approach, Presentation of Data
INTRODUCTION
Presentation of data is an important subject because it is applied in a variety of disciplines, both natural sciences, business, and industry. Bakker (2004) reveals that almost every decision made in the political and economic uses statistical reasons (including the presentation of data).
In fact, in the material presentation of the data was difficult. The cause is still supporting books using direct instruction on the use of numbers without motivating students express / everyday life. As a result, students seem saturated and allows the student does not like the material (Supriyanto, A. 2011). For example, in the learning process presenting data largely done by giving the formula directly without first learning about the basic concepts and procedures meaningful (meaning full) for students (Lestariningsih, 2012). The learning process has led to the understanding that such low so as to further cause students experiencing difficulties in learning.
Magister of Mathematics Education Department FKIP Sriwijaya University
53
To support the professional duties of teachers as well as to improve the effectiveness of learning itself, then as one of the appropriate approach is Realistic Mathematics Education Indonesia (PMRI) which emphasizes the use of contextual issues as a starting point for learning math. It is also stated by Freudenthal about mathematics (in Zulkardi, 2002). Two views of the importance of mathematics is to be connected with everyday life situations and mathematics as a human activity, so that students are given the opportunity to learn matematisasi activity on all topics of mathematics. Also according to Ilma, R. (2011) PMRI is one approach to learning that will lead students to understand mathematics by constructing their own concept through prior knowledge related to daily life, find themselves with the concept.From the above discussion, the formulation of the research problem is how interactive multimedia characteristics PMRI approach based on the subject of class IX presentation of the data valid and practical, as well as how the potential effects of interactive multimedia PMRI developed based on presenting data the subject of class IX in junior high school Xaverius 1 Palembang.
Realistic Mathematics Education Indonesia (PMRI)
According to Zulkardi and Ilma (2011), PMRI or RME (Realistic Mathematics Education) is the starting point of the theory that things are 'real' or experienced students, emphasizing process skills 'doing mathematics', discuss and collaborate, argue with classmates so they can find their own ('student-inventing') as opposed to ('teacher telling') and in the end the mathematics to solve problems both individually and collectively.
The Principles of PMRI
According to Gravemeijer (in Zulkardi, 2002), there are three principle PMRI approach which are as follows:
1. Guided reinvention and didactical phenomenology
This principle can be inspired to use informal procedures. This effort will be achieved if the teaching is done using the situation in the form of phenomena that contain mathematical concepts and real against the lives of students (Zulkardi, 2002). By knowing the concepts of statistics and data and population and sample, and can write the definition in their own words, students can construct their own knowledge about the data presentation in the form of tables and data presentation in the form of diagrams and worksheets with answer in multimedia students can find understanding the concept of presenting the data in the table and presenting the data in the diagram.
2. Didactical Phenomenology
Situation phenomena and materials used in the teaching of mathematics application areas should depart from the real state of the student before reaching the level of formal mathematics (Zulkardi, 2002). Students are given an opportunity to argue, results expressed his thoughts in a horizontal or vertical matematization through activities in the multimedia student worksheets taken from the context of everyday life.
3. Self-developed models
Magister of Mathematics Education Department FKIP Sriwijaya University
54
model of self-development principles can be seen from the results of the students' answers. At the student answers can be seen how or strategies used by students in answering activity worksheets contained in the multimedia.The Characteristics of PMRI
According to Zulkardi (2000), the approach has five characteristics PMRI which are as follows:
1. Using contextual issues
Learning begins by introducing some context. Context is used in this study is the result of agricultural and weight. With the existing context herded students through questions to reach into formal mathematics.
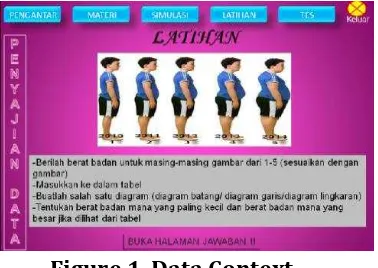
Figure 1. Data Context
In Figure 1. Using the child's weight context, students were herded by weight as a model for the bridge towards the concept of data, then the students were asked to assess how the child's weight. Furthermore, students are trained to dare to express their opinions by explaining the content of the image.
2. Using a model or a bridge with a vertical instrument
The role of the development of the model itself is a bridge for students from formal to informal situations mathematics. For example, the following data presentation material:
Through the context of the child's weight, students were herded by the model weight towards the concept of presenting the data to the table with the questions that led to the presentation of data in tabular form (here the students create their own data) so that students can ultimately determine how the image is a diagram of the table they make.
3. Using student contributions
Students are given the opportunity to develop informal strategies to solve problems that can lead to their contribution of troubleshooting procedures with the guidance of
teachers expected students to find. Students work individually or group, using the knowledge he already has, among others, reading tables / diagrams so that they can determine large and small lot and summarize the data.
4. Interactivity
Magister of Mathematics Education Department FKIP Sriwijaya University
55
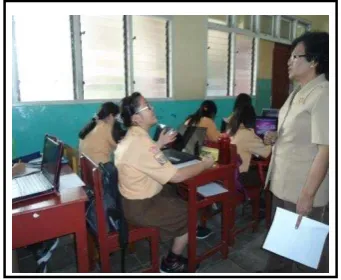
Figure 2. Interactivity between students and teacherIn figure 2, appears interactivity in the learning process between students and teacher as well as students and students that when students ask the teacher and his friends, as well as students argue about the answers with other students.
5. Integrated with other learning topics
Multimedia developed strongly linked and integrated with mathematics and other disciplines. In mathematics associated with addition, multiplication and subtraction percentages and angles. While in other disciplines related to science.
RESEARCH METHODS
This study uses research development manifold Development Research Study. The research was conducted on even semester 2013/2014 in the junior Xavier 1 Palembang. The subjects were students of class IX totaling 29 students.
Research Procedures
The study consisted of two stages: a preliminary stage which includes analysis and design, and Evaluation formative stage which includes self evaluation, expert reviews and one-to-one (low resistance to revision), and small groups, as well as field test (high resistance to revision) (Tessmer, 1993; Zulkardi, 2002).
1. Preliminary
This stage includes the analysis of curriculum and designing. Junior high school mathematics curriculum were analyzed to see which parts of the curriculum with the opportunity to develop multimedia technology. The next stage, researchers are designing interactive multimedia PMRI based on material data presentation. Design materials displayed includes objectives, learning materials, simulations, exercises and tests.
2. Formative Evaluation
This stage includes: a. Self evaluation
Self assessment by design of interactive multimedia (prototype 1) b. Expert Review and One-to-One
Prototype I in the form of multimedia experts validated to 2. Experts will provide a review of the first prototype multimedia based content, construct and layout. Then, in parallel with the phase of the expert review, conducted also one to one.
Researchers utilizing 2 junior high school students as a tester. This stage is done to see the extent to which interactive multimedia can be understood by the students. c. revision
Magister of Mathematics Education Department FKIP Sriwijaya University
56
d. Small groupIn this step the prototype tested in small groups, consisting of five junior high school students of class IX.
e. revision
Once the prototype is tested, small group of students were asked to provide feedback on the prototype. Based on the results of student responses and
researcher observations during the learning process, a prototype re-revised. The revised prototype is expected to produce an interactive multimedia valid and practical.
f. Field Test
The revised prototype tested against the research subjects. In the field test will be seen how the practicality and effectiveness of the final prototype. It can be seen from the process of learning, student activities and student capabilities that include cognitive learning by using multimedia data presentation.
Data Collection and Analysis Techniques
Based on research methods and procedures above, data collection and analysis techniques used in this study are as follows:
a. Walkthrough
Researchers gave the media that has been produced to the experts then the experts observe and review any content, construct, and the layout is in multimedia. Then the researchers noted any comments and suggestions provided by experts.
b. Video / Camera
Video / camera footage is used as documentation for collecting data used to record some part in the learning process (Sugiyono, 2012), to determine whether students understand the concept of presenting data through a learning activity of students. c. Interview
Interviews were conducted with students in the evaluation stage one to one and small group. Interviews were conducted to explore problems in the use of media conducted unstructured. Data obtained in the form of feedback and assessment of students as suggestions and improvements researchers to revise the product (Sugiyono, 2012). d. Observation
Observations conducted to observe students' learning activities using observation sheets on the stage small group evaluation (Sugiyono, 2012). Observations were also used to determine the practicalities of the implementation of learning by using interactive multimedia developed.
e. Test
The test is used to look at the effectiveness of the use of interactive multimedia that has been developed to determine the ability of the student. The steps are performed in analyzing test data are:
1. Making key answers were scored predetermined benchmark.
2. Analyze the steps workmanship questions by students to measure student ability level representation.
Magister of Mathematics Education Department FKIP Sriwijaya University
57
RESULTS AND DISCUSSIONThis study generates interactive multimedia valid, practical and have potential effects to the material presentation of data. Where in the interactive multimedia development process in two stages: preliminary and formative evaluation.
In the preliminary stage of the analysis performed and the junior high school mathematics curriculum analysis results are obtained:
Standard of Competence: Perform processing and presentation of data.
Basic Competence: Presenting the data to the form of tables, charts, images, stem and loop.
This study focuses on understanding the concept of presenting data with indicators, namely:
1. Presenting the data in tabular form 2. Presenting data into a bar chart
3. Presenting the data in the form of line charts 4. Presenting the data in the form of pie charts 5. Read/interpret the data
Furthermore done designing prototype based on 3 principles and characteristics PMRI, namely: guided reinvention and didactical phenomenology, progressive mathematization, self-developed models, using contextual problems, using a model or a bridge with a vertical instrument, using the contributions of students, Interactivity, integrated with other instructional topics (Zulkardi, 2002).
The second stage is the formative study. This stage is carried out through self evaluation, expert reviews, one to one, small group, and a field test. At this stage of the expert review, obtained comments and suggestions from experts and it is known that the prototype still needs a lot of revision, especially in terms of content. Input from experts is used to revise the prototype. Furthermore, in line with the expert reviews, also done stage one to one. In stage one to one, two students were asked to work on worksheets in interactive multimedia, and then provide comments and suggestions on the instruments that have been generated. student comments seen that in terms of the students really liked the look of this multimedia and multimedia means well and is said to have or do not require revision. Difficulties students use the media only on the cursor that is hard pressed because it does not use a mouse and not accustomed to using a laptop.
The revised prototype tested on small groups consisting of 5 students of class IX SMP. After the test, the students were asked to provide comments and suggestions on the prototype. At this stage it is known that the students are very excited to work on the problems. Based on the observations of the student researchers confusion in answering
questions and to make a table or chart during the small group evaluation, the researcher makes the student answer sheet to answer the questions in multimedia.
Magister of Mathematics Education Department FKIP Sriwijaya University
58
neighbour, then they dared to ask the teacher. Field test activities can be seen in Figure 2.Figure 2. Activity Field Test Evaluation
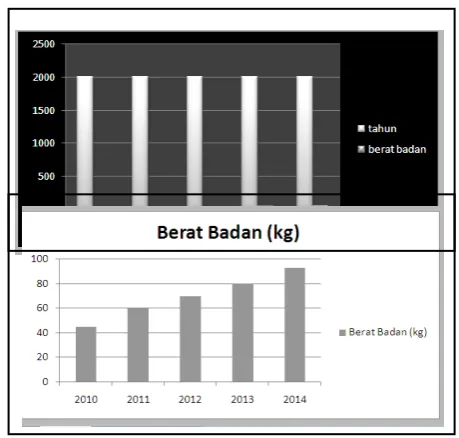
Meeting of the field test stage given the context of weight loss associated with daily life. To make the activity data into the data into the tables and diagrams, overall the students were able to answer well. First students consider the available images and discuss it with friends on the table. Students entering data into a table and then create diagrams. One result of the student answers can be seen in Figure 4. Having analyzed is known that, in the matter of the test, most students can answer correctly.
Figure 4. Results of student test answer no 4
Presenting the data in the form of a diagram there are 24 students who answered this question correctly. Mostly a lot of mistakes in presenting the data in a pie chart form. This is due to an error in entering student data into the table so that when in insert charts, graphs wrong. Can be seen in Figure 5., And Figure 6.
Figure 5. Answer wrong students
Magister of Mathematics Education Department FKIP Sriwijaya University
59
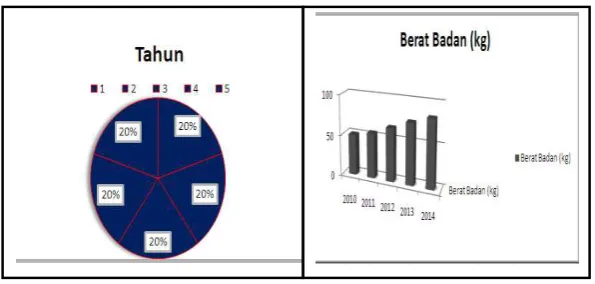
In addition there is also the matter of the test allows students the freedom to provide the answer and different options, for example in Figure 7. Could be seen clearly.Figure 7. Results answer two students (Mahvira and Stefani)
Of the two students' answers, there are two ways of settlement of a matter and each different data. Mahvira uses pie charts to present data using bar charts while Stefani to present the data. In Figure 8. Reading / interpreting the data contained in the no. 6 and 7, and from the results of our analysis it is known that 24 students answered correctly and 5 students is not appropriate in resolving this matter.
Figure 8. Results of students' answers on No. 6
This is because the tables / charts that students not true, so the students also experienced an error in reading / interpreting the data. Can be seen in Figure 9.
Figure 9. Results of students' answers on No. 7
Overall the students were able to answer the practice questions and tests well and from the observation stated that students actively in learning. It can be concluded that PMRI based interactive multimedia presentation on the subject of the data has a potential effect.
CONCLUSION
This research resulted in a product that is in the form of interactive multimedia based PMRI and has been tested on students of Xavier junior class IX.G 1 Palembang. Based on the results of research and discussion, the conclusion is:
1. Interactive multimedia presentation of data developed based approach PMRI considered valid and practical. Multimedia validity based on expert assessment which includes several aspects: content, construct and layout, as well as views of the extent to which interactive multimedia can be understood by students one to one based on the analysis worksheets in multimedia. Interactive Multimedia considered practical because it can be used easily by students, is seen during small group trials.
Magister of Mathematics Education Department FKIP Sriwijaya University
60
field test, students can present the data shown in the table, it can present data in charts and read / interpret the data suggest that students were able to master thematerial. Then, also the results of the analysis of observations obtained by the student activity indicator visible characteristics PMRI very active in student learning. Thus it can be said that the interactive multimedia that has been developed by researchers to have a potential effect on the presentation of the data subject.
REFERENCES
Supriyanto, Anang. 2011. Pengembangan Materi Ajar Pengolahan Data Menggunakan Pendekatan Pendidikan Matematika Realistik Indonesia (PMRI) di Kelas VI Sekolah
Dasar (SD). Proceeding Seminar Nasional Pendidikan FKIP UNSRI.
Bakker. 2004. Design Research in Statistics Education On Symbolizing and Computer
Tools. Utrecht : wilco, Amersfoort/ Freudenthal Institute.
Depdiknas. 2009 . Pengantar Multimedia Pembelajaran. Jakarta : Depdiknas.
Ilma, Ratu. 2011. Building the Nation Character through Humanistic Mathematics
Education. Makalah disampaikan pada International Seminar and the Fourth
National Conference on Mathematics Education 2011. Pada tanggal 21-23 Juli 2011 Yogyakarta.
Ilma, Ratu., Zulkardi. 2011. Pengembangan Blog Support Untuk Membantu Siswa dan Guru Matematika Indonesia Belajar Pendidikan Matematika Realistik Indonesia (PMRI). JIPP Balitbang
Lestariningsih. 2012. Desain Pembelajaran Matematika Legenda Pulau Kemaro Pada
Pembelajaran Statistika Di Kelas VI Sekolah Dasar. Tesis S2 Universitas Sriwijaya
Sugiyono. 2012. Metode Penelitian Kombinasi (Mixed methods). Bandung: Alfabeta.
Tessmer, M. 1993. Planning and Conducting Formative Evaluations. London, Philadelphia: Kogan Page.
Zulkardi. 2002. Developing a Learning Environment On Realistic Mathematics Education
For Indonesian Student Teachers Disertasi. (http://projects.edte.
utwente.nl/cascade/imei/dissertation/disertasi.html diakses 14 April 2013