SUPPORTING 5
THGRADE INDONESIAN STUDENTS
IN LEARNING PERCENTAGES
Yoga Dwi Windy Kusuma Ningtyas1
State University of Surabaya, Indonesia1 1)[email protected]
Abstract
Students of elementary school still have difficulties to understand the concept of percentages. Therefore, this study aims to figure out how teacher can support students to understand the concept of percentages: 1) students show an awareness that percentages are related to something; 2) students are able to compute the part of a whole while the percentage is given; 3) students are able to compute a whole if its part and its percentage is given. The study was conducted before students learned percentages formally in class, and then they only have their pre-requisite knowledge about fractions and their own initial knowledge of percentages they found from their surroundings. Based on those aims, we use Design Research as a method. We develop a set of instructional activities which is exploring
students’ initial knowledge of percentages. Besides, contextual situation based on Realistic
Mathematics (RME) approach which are loading bar on a game, voting results, road repair, and discount problems was used to contribute to the development of students’ understanding of percentages. From those activities, students will shade the loading bar, estimate the position of percentage on a loading bar, divide bar into small pieces, and use percentage bar to compute percentages which are expected can support them in understanding the concept of percentages. The ongoing analysis of collected data shows
that the designed learning activities can support students’ understanding of the concept of
percentages. However, some students still struggled with the discount problems.
Keywords: the concept of percentages, Realistic Mathematics Education
INTRODUCTION
A percentage is a concept in mathematics curriculum which is present in everyday life. The existence of percent can be seen easily in the department store/shop, the television of weather forecast, the economic circumstances, the article written in the newspaper, the clothes we wear, the things we use, and the food package. As its practical uses in daily life, it is proved that percentage is a mathematical topic which is useful and common in everyday situations.
Several previous studies asserted that students are surprised when they have to use percentages in the meaning of fractions and decimals (Parker & Leinhardt, 1995; Reinup, 2010).Students only see the relationship between percentages and fractions without knowing the reasons why and when they should use percentages as fractions or vice versa. Other studies revealed that students ability to apply benchmarks and other estimation techniques to percentages problems is helpful for them to develop their understanding of percentages (Lembke & Reys, 1994; Parker & Leinhardt 1995). Primary school students are familiar with the benchmark of percentages such as 25%, 50%, and 100%, because students can easily judge percentages by using the benchmark. Students intuitively know that 100% is everything, while 50% of something is synonymous with a half which can be seen as fractional part-whole relationship. Therefore, the use of a benchmark as the introduction of percentages in the teaching and learning process is also important.
However, in Indonesian commercial mathematics books and in teaching practices, benchmarks are never applied. A procedural term about percentages such as per a hundred is given directly to students without first exploring their intuitive knowledge about percentages. Even though students are familiar with 100% and 50%, the use of that benchmark is never implemented as a part of the lesson. Therefore, in this study, the use of benchmarks and students intuitive knowledge about 100% as everything and 50% as a half will be included as an instructional approach to teach the concept of
percentages in promoting students understanding of percentages.
In terms of students intuitive knowledge of percentages, a teacher can suggest context as the main characteristics of the learning process and let students explore the contexts in their own ways (see Parker & Leinhardt, 1995; van den Heuvel-Panhuizen, 2003; Van Galen, et al., 2008; Reinup, 2010). It means that students experience mathematics as real situations and it underlies a Realistic Mathematics Education (RME) approach.
According to the description above, this study aims to contribute to the development of a local instructional theory for percentages and to support fifth grade students in understanding percentages by designing and developing hypothetical learning trajectory. Furthermore, this study has a general research question on figuring out how teacher can support students to understand the concept of percentages: 1) students show an awareness that percentages are related to something; 2) students are able to compute the part of a whole while the percentage is given; 3) students are able to compute a whole if its part and its percentage is given.
THEORETICAL FRAMEWORK Concept of Percentages
Van den Heuvel-Panhuizen 99 claimed that a percentage is a relation between two
numbers or magnitudes that is expressed by means of a ratio. Similarly, Parker &
one set as a subset of another set which is an example of a part-whole relationship. If the number of mathematics books is 25% of the number of physics books, this reflects a ratio where one set is a disjoint set of other set.
Understanding Percentages
Mousley ; cited in Beswick, argued what is meant by understanding in
mathematics. He posed that understanding is about connections between: new and existing knowledge, various mathematical ideas and representations; and mathematical learned in school and everyday life. Similarly, Barmby, Harries, Higgins, and Suggate (2007) described the definitions of understanding as making connection between mental representations and mathematical concepts. Thus, generally it can be said that understanding is a mental activities in which students build a structure of network of mathematical concepts or ideas.
Considering the different meaning of concept of percentages related to comparison tools, the meaning of understanding percentages proposed by van den
Heuvel-Panhuizen 99 , and students prior knowledge of percentages such as students have
learnt fraction (part-whole relationship) yet they do not learn about ratio, then in this study we define understanding the concept of percentages as follows.
a. Using percentages as comparison tool which are always related to something and that therefore cannot be compared without taking into account to what they refer. b. Using percentages to compute the part of a whole while the percentage is given. c. Using percentages when different parts of different wholes have to be compared.
The Use of Model in Learning Percentages
Some studies suggested using models in supporting students development in
understanding the concept of percentages. One of those studies, by van den Heuvel-Panhuizen (2003), revealed that, on one hand, models can be used to bridge the gap between students concrete knowledge and formal knowledge. The study of van Galen & van Eerde (2013) revealed that a percentage bar plays a role as an important model used in teaching the concept of percentage because students can benefit by using it. The advantages are that students can use a bar model as a concrete model to visualize the
given context, to track students thinking processes steps in determining the
calculation process, and to guide them in choosing effective ways of calculation, such as calculating via 1%. The percentage bar model refers to a strip in which the different scales are written at the same time, that is, percentages can be written above the bar and
the corresponding amount/quantity below the bar, or the other way. For instance, how
much is 1 % of € ? van Galen & van Eerde, .
15% 100%
? €
Figure 1. Visualization of percentages questions (van Galen & van Eerde, 2013)
percentage bar gives a concrete picture to depict the relationship between a whole and its parts. This study focuses on using a percentage bar as a model to support students in learning percentages, later in solving percentages problems.
The Use of Realistic Mathematics Education (RME) in Understanding Percentages Lembke & Reys (1994) described that there are five components to show students
understanding of percentages: a the existence of pictorial representations for
percentages; (b) the ability to relate fractions, decimals, and percentages; (c) the ability to apply benchmarks and other estimation techniques to solve percentage problems; (d) the ability to perform mental computation in conjunction with percentage problems;
and e a sensitivity to reasonableness of the solution . This raises a question on how students understanding of percentages is attained. Several studies documented that they implemented a Realistic Mathematics Education (RME) approach in the teaching and learning percentages by implementing all its characteristics. According to the Gravemeijer (1994), there are five characteristics of RME:
1. The use of context
The contexts are related to the students daily life such as the loading bar, the result
of voting, and the road repair of Mudik Lebaran. The students, for instance, are familiar with the use of a loading bar which can be seen on their laptop screen when they want to play games.
2. The use of models
Models are used to bring students from informal to formal mathematics. In this study, a percentage bar is used to support students in solving percentage problems. First, students will see a percentage bar as a visualization of the given contextual problems. Then students will see the relationship between a whole and its parts through the percentage bar. Later, at the end of the learning activities students are able to use the percentage bar as a tool for finding reasoning to determine the easiest way in solving percentage problems.
3. Interactivity
Students communicate their thinking, opinions, and solutions in pair-discussion and classroom discussion. Thus, students do not only interact with other students but also with the teacher.
4. Intertwining
In this process, there is integration among mathematical strands or units. In this study, percentages as one unit in mathematics have a relationship with other topics such as fractions, ratios, and proportions.
5. The use of students own contribution
Students will contribute by making their own percentages and their own loading bar. It is assumed to lead in the various solutions. Thus, students will be given time to think and to discuss the different solutions.
According to explanation above, the concept of percentages has a close relation with fractions which is a prior knowledge of students that they have before having formal knowledge of percentages. Students are familiar with benchmarks of percentages such as 50% as a half of a whole which relates to fractions. Therefore, in this study, the use of
benchmarks and students informal knowledge about percentages will be included as an
instructional approach to teach the concept of percentages in promoting students
students’ understanding of percentages?; 2) how does the percentage bar support students
in solving percentages problems?
METHOD
Design research (DR) is chosen to gain the aim of this study. It is because within a design
research, the instructional theories about students learning and the tools which are
designed to support the learning activities are developed (Gravemeijer & Cobb, 2006). The three phases of DR in this study are preparing, experiment, and retrospective analysis. Besides, contextual situation based on Realistic Mathematics (RME) approach – loading bar on a game, voting results, road repair, and discount problems – was used to
contribute to the development of students understanding of percentages.
The study was carried out during March until April 2014 SD Negeri Sumbersuko, Lumajang. The first cycle was carried out in SD Sumbersuko with six students who have different level of academic achievement and the researcher as the teacher. This first cycle was conducted to carry out the designed learning materials, to know how the Hypothetical Learning Trajectory (HLT) will work for students. Later, the retrospective analysis of the first cycle is based on the collected data from video, field notes, students
worksheet, and interview s result of pre- and post-test.
RESULT AND DISCUSSION
We designed learning sequences which consists of five activities and its HLT. The series of activities are intended to help students in understanding the concept of percentages. First activity, loading bar, was designed for students to construct the sense of percentages by shading the part of the loading bar. Second activity, voting result, was intended for reconstructing the meaning of percentages as hundredth. The third, road repair I, was developed to determine a percentage of a given certain number and introduce the use of bar model. Students encounter problem of road repair in the context of Mudik Lebaran. They also should make visual representation of road which may help them in solving the problem. The fourth and fifth activities were designed to develop the use of percentage bar in supporting students to find solution of percentage problems.
The Retrospective Analysis of the Cycle 1
Before conducting the experiment phase, the researcher conducted pre-test to collect
data about students knowledge on percentages. According to the pre-test results, students already had pre-requisite knowledge about fraction. All of them know how to write fractions, but only some of them understand that fraction related to part-whole relationship and see that one thing is 100%. Some students knew benchmark of percentages; ½ is 50% and ¼ is 25%. And, all of students have difficultie in solving problems realted to discount even they knew what discount is. Therefore, in this study, the use of benchmarks and students intuitive knowledge about 100% as everything and 50% as a half will be included as an instructional approach to teach the concept of
percentages in promoting students understanding of percentages.
The first activity was designed to explore students initial knowledge of percentages ans their sense of percentages though loading bar. Students shaded loading bar and estimated the position of a given value of loading bar. By experiencing those activities,
their idea. Therefore, teacher role in promoting students confidence to pose their idea
and translated what students means was important.
The second actvity was designed to reconstruct the meaning of percent as base of a hundred. The context was voting for class-leader election which was represented in a bar. We gave a hint on dividing the bar into ten parts and by asking them to draw a given value of percentage they would divide into small parts again parts . All students conjectured were taken place. Some students had a tendency to use formal ways to determine relation between percentages and fractions as they had learned it in a private course outside school.
The third activity was intended to introduce the use of bar model to students in which
support students reasoning in determining efficient strategies for finding solution.
Students encounted a context about road repair. We expected that students could find the legth of the repaired road with given percentages and made a model to visualize the
problem. The conjectured of students solutions was not as expected, for instance, the
use of formal way. Most of them have same solutions that was capturing a road into a percentage. They also could saw the use percentage bar in helping them found the solutions by examining given number on problem. The similarity of answer was because they cheated each other.
The fourth activity was designed to develop the use of percentage bar. Students were invited to explore road repair context. We expected them to develop the use of percentage bar by examining the given number so that they could find the efficient strategies. Eventhough not all students conjectured appeared during the lesson, but students had already develop the use of percentages bar by using 10% rule and 5% rule. They did not have any difficulty in finding their strategies but they need more times.
The fifth activity was about percentage around students real life which were discount problems and percentage on bottle of a drink. The conjectured of students strategies
were taken place in this activity. The fact that students knew what discount is, the use of percentage bar made some students students could some problems on fifth activity. Yet, some students struggled to solve the problem as they only found how much the discount is and ignored the true price that they should pay. They used percentage bar and applied their strategies to determine the solutions. However, there was one problem in which
students had a missunderstanding in interpreting the problem. Therefore, the teacher s
guidance was needed along the class discussionn to get the right interpretation of the problems.
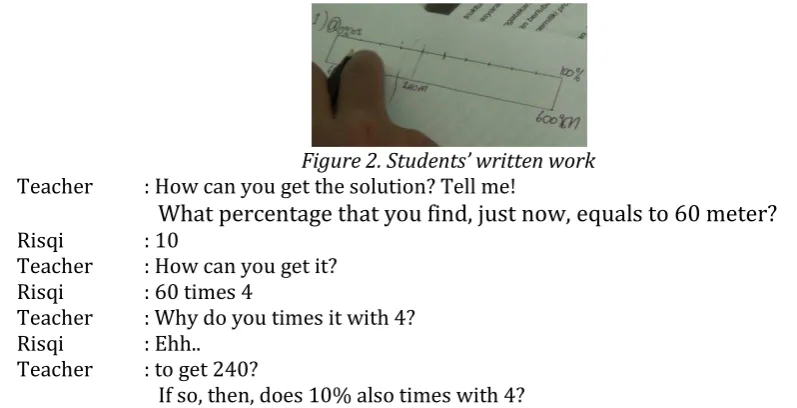
After conducting the series of activities, there was a fact that the use of percentage bar could help students for determining the solution of percentage problem. For instance, in the fourth meeting, students were invited to determine the percentage of road which has been repaired: 240 m of 600 m road has been repaired and 280 m of 800 m of road has been repaired. As our expectation, they would use percentage bar for determining the solution of the problem.
Transcript 1
Risqi : I should find the percent, ooo 20, 30, 40
Figure 2. Students’ written work
Teacher : How can you get the solution? Tell me!
What percentage that you find, just now, equals to 60 meter? Risqi : 10
Teacher : How can you get it? Risqi : 60 times 4
Teacher : Why do you times it with 4? Risqi : Ehh..
Teacher : to get 240?
If so, then, does 10% also times with 4?
Based on transcript 1 and figure 2, student showed that they know how to work with percentage bar. They knew that 100% represents 600, and they divided the bar into 10 parts so that 1 small part (10%) represents 60 m. Thus, they got the position of 240 m in the fourth of small parts. It means they need 4 times of 10% to get 240 m. At last, they used percentage bar for determining the solution of the problem
After carrying out the experiment phase, the researcher held a post-test to collect data about how far students understand the concept of percentages. According to the post-test results, all students had been aware that percentages are related to something and they used benchmark of percentages. However students still had struggled to solve discount problems.
CONCLUSION
In summary, the result of this study is the designed learning trajectory could help students in understanding the concept of percentages: 1) students show an awareness that percentages are related to something; 2) students are able to compute the part of a whole while the percentage is given; 3) students are able to compute a whole if its part and its percentage is given. From the first activities and the second activities, students could understand initial knowlegde of percentages which are the full percenetage is 100% and know some benchmark of percentages throgh loading bar. Students knew they should divide a loading bar into
REFERENCES
Barmby, P., et. al. (2007). How can we assess mathematical understanding?. In Woo, J.H., Lew, H. C., Park, K. S., & Seo, D. Y. (Eds.). Proceedings of the 31st Conference of the
International Group for the Psychology of Mathematics Education, 2, 41-48.
Beswick, K. (2005). Preservice Teachers Understanding of Relational and )nstrumental Understanding. In Chick, H. I., & Vincent, J. L. (Eds.). Proceedings of the 29th
Conference of the International Group for the Psychology of Mathematics Education, 2, 161-168.
Gravemeijer, K. (1994). Developing Realistic Mathematics Education. Utrecht: CD-8 Press/Freudenthal Institute.
Gravemeijer, K., & Cobb, P. (2006). Design research from the learning design perspective. In Van den Akker, J., Gravemeijer, K., McKenney, S., & Nieveen, N (Eds.), Educational Design Research. London: Routledge.
Lembke, L. O, & Reys, B. J. (1994). The Development of, and Interaction between, Intuitive and School-Taught Ideas about Percent. Journal for Research in Mathematics Education, 25(3), 237-259.
Lee, K. P. (1998). The knowledge of percent of pre-service teachers. The Mathematics Educator, 3(2), 54-69.
Parker, M., & Leinhardt, G. (1995). Percent: A privileged proportion. Review of Educational Research, 65(4), 421-481.
Reys, R. E., et al. (2007). Helping Children Learn Mathematics. USA: John Wiley & Sons, Inc.
Reinup, R. (2010). Teaching Number Line, Fractions, Decimals and Percentages as an Integrated System. Didactics as Design Science, 71-82.
van den Heuvel-Panhuizen, M. (1994). Improvement of (Didactical) Assessment by Improvement of Problems: an Attempt with Respect to Pecentage. Educational Studies in Mathematics, 27, 341-372.
van den Heuvel-Panhuizen, M. (2003). The Didactical Use of Models in Realistic Mathematics Education: An Example from a Longitudinal Trajectory on Percentage. Educational Studies in Mathematics, 54(1), 9-35.
van Galen, F., et al. (2008). Fractions, Percentages, Decimals and Proportions: A Learning-teachng Trajectory for Grade 4, 5 and 6. Rotterdam: Sense Publishers.