Groundwater Level Changes in Shallow Aquifer of Yogyakarta City,
Indonesia: Distribution and Causes
Liliane Manny1, Rilo Restu Surya Atmaja2, and Doni Prakasa Eka Putra*2
1Department of Engineering Geology and Hydrogeology, RWTH Aachen, Germany
2Department of Geological Engineering, Faculty of Engineering, Gadjah Mada University, Indonesia
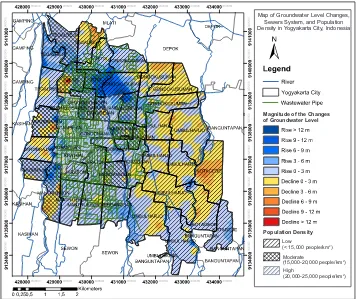
ABSTRACT. The population in Yogyakarta City, Indonesia has increased since 1970, result-ing in high groundwater utilization. This normally results in a decline of groundwater level in shallow aquifer beneath the city. However, expansion of the city and urbaniza-tion effects can also have the opposite effect and lead to a rise of groundwater levels due to urban recharge. This study investigates groundwater level changes in Yogyakarta City during a time period of 30 years between 1985 and 2015. Collected data in this research are groundwater level, rainfall, population density, sewer system, and land use. Overlaying various spatial information reveals a pattern of groundwater level rise in some areas of the city by 0–12 m, whilst in other areas a decline of 0–9 m is discovered. Rising ground-water levels are mainly found in areas moderate to high population density where sewer system networks have been installed. The rising of groundwater levels is thus expected to be caused by urban recharge and sewers leakage.
Keywords: Groundwater level changes ·Urban recharge ·Sewers leakage ·Yogyakarta
City·Indonesia.
1 INTRODUCTION
Yogyakarta City is located in the middle of Spe-cial Province of Yogyakarta, Indonesia. Accord-ing to BPS-statistics of DI Yogyakarta Province (2016), by 2015 population of Yogyakarta City counts around 412.704 in 2015. Marwasta (2010) stated that the City of Yogyakarta has been experiencing a major growth since 1970 due to the increase of local population as well as urban migration resulting in the development
of more houses and hotels. The rising
de-mand for accommodation which was followed by land use transformations from open and agricultural land towards settlement area has
led to higher housing densities. In general,
land use changees can affect groundwater re-sources, A reduced infiltration volume conse-quently results in declining groundwater levels (Remondi, Burlando, & Vollmer, 2016).
*Corresponding author: D.P.E. PUTRA, Department of Geological Engineering, Faculty of Engineering, Gadjah Mada University. Jl. Grafika 2 Yogyakarta, Indonesia. E-mail: [email protected]
Yogyakarta’s population mostly uses the city’s underlying shallow aquifer from which it abstracts groundwater through dug wells or bore wells. Moreover, Asriningtyas and Putra (2006) also stated that potable water supply of Yogyakarta City is largely taken from Sle-man Regency which is located in the upstream of the Yogyakarta City. Hendrayana and Vi-cente (2013) calculated utilization groundwa-ter withdrawal of 28,563,487,181 ligroundwa-ter/year in Yogyakarta City. Significant groundwater ab-straction from the underlying shallow aquifer due to increasing urban demand and develop-ment can affect the groundwater level in many
ways. Morris et al. (2003) described that
de-cline in the city periphery which occurs due to large abstraction rates from wells. In the fol-lowing aquifer beneath the city is abandoned because of deterioration of water quality. Fi-nally, as the city expands further, the water table beneath the city rises again causing flood-ing and contamination because of leakflood-ing of waste-water sewers.
Besides the urban growth, (Karamouz et al.,
2013) stated that climate change may also have an effect groundwater level and resources. In relation to groundwater resources, three im-pacts of climate change are detected: changes in the timing and magnitude of groundwater recharge, changes in the interaction between groundwater and surface water and water re-treats. Therefore, it is important to investigate the changes of groundwater level in Yogyakarta City in relation to urban growth and annual rainfall variation to understand the urbaniza-tion stage of the city.
This study aims to investigate the changes of groundwater level in Yogyakarta City through-out 30 years from 1985 to 2015, including the magnitude, distribution and causes, and thus to gain an understanding of the relation of land use changes, sanitation, urbanization and an-nual rainfall variation to the changes of ground-water level in Yogyakarta City.
2 STUDYAREA
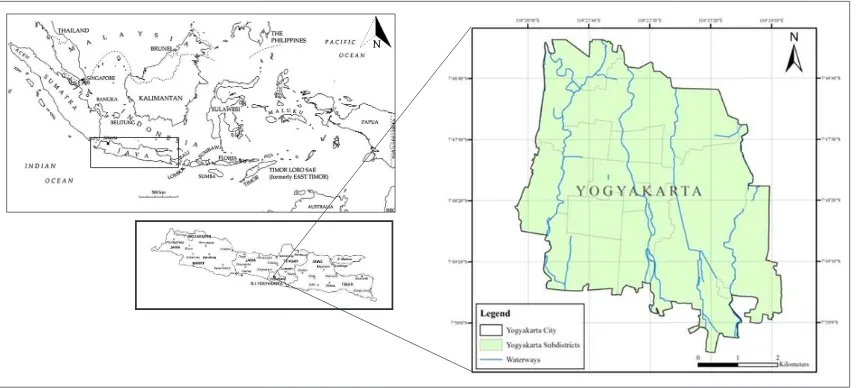
According to BPS-statistics of Yogyakarta City (2009), City of Yogyakarta lies between 110°24’19"–110°28’53" east longitude and be-tween 07°49’26"–07°15’24" south latitude, cov-ering area a total area of 32.5 km². The city expands from north to south from the slopes of the Merapi Volcano towards the Indian Ocean with an average elevation of 113 m and 0–2 %
inclination. The regional climate is tropical
with an annual mean temperature of 27.3°C. The average annual rainfall of 2450 mm/year mainly occurs during the wet season months
from November to April (Putraet al., 2013). As
shown in Figure 1, there are three rivers flow-ing through the city from north to south, which are Gadjah Wong river in the east, Code river in the middle, and Winongo river in the west.
In the term of regional geology, Yogyakarta City is mainly composed by quarternary fluvial-volcanoclastic sediments such as tuff,
ash, breccia, agglomerate, and lava flows which are named Young Merapi Volcanic Deposits
(Rahardjo et al., 1995). MacDonald & Partners
(1984) differentiated Young Merapi Volcanic Deposits into two formations; Sleman
For-mation and Yogyakarta ForFor-mation. Sleman
Formation is designated as the lower part of Young Merapi Volcanic Deposits. It extends from the upper slope of Merapi Volcano to the southern of Bantul Regency and features mostly sands, gravels with interspersed boulders and derivations from volcanic ejecta with a varying thickness of 38 to 120 m. Yogyakarta Formation acts as top layer covering most of lowland area of Yogyakarta Basin. It is dominated by sands, gravels, silts, clays with a thickness up to 45 m lying unconformably upon the Sleman Forma-tion. Those quarternary fluvial-volcanoclastic sediments form an aquifer system, the Merapi Aquifer System (MacDonald & Partners, 1984).
The City of Yogyakarta is located in the cen-tral part of the Yogyakarta-Sleman Groundwa-ter Basin. The Yogyakarta and Sleman Forma-tion are both major groundwater aquifers. Yo-gyakarta Formation has a hydraulic conductiv-ity of 7.8 m/day, storativconductiv-ity values between 0.03 and 0.20 and an average specific yield of 20 %
(Putra et al., 2013). The base of the northern
part of the aquifer system are Old Merapi Vol-canic Deposits, while the base of the aquifer sys-tem in the central and the south of Yogyakarta City consists of limestone, marl, and tuff frm the Sentolo Formation (MacDonald & Partners,
1984). Those rocks act as aquicludes (Putra et
al., 2013). Based on data from 1990 until 2002,
Putra (2003) estimated Yogyakarta’s ground-water recharge using the ground-water balance and groundwater fluctuation equations and came to the result of 442.98 × 10⁶ m³/year
ground-water recharge. In contrast, the value for
groundwater storage of 3530 × 106 m³/year
exceeds the recharge value by far. The
Figure 1: Study area in Yogyakarta City, Indonesia.
In 2013, the optimum yield of 125,000 m³/day was determined with an estimated ground-water withdrawal of 45,000 m³/day. Natural groundwater recharge of 400 mm/year was
de-termined for 2013 (Putraet al., 2013).
Putra (2007) estimated potential wastewater in Yogyakarta City of 24.51 × 10⁶ m³/a, while potential wastewater recharge of 1.86 mm/day. Furthermore, the sewer system discharges 2.43 × 10⁶ m³/a f wastewater. Approximately 14.5 % of the the total sewage flow are
as-sumed as losses due to sewage. Therefore,
estimated sewage leakage in Yogyakarta City of 0.35 × 10⁶ m³/a (Putra, 2007).
3 RESEARCHMETHODS
Four main sections are defined in order to ob-tain the objectives of this research; (1) under-standing of the groundwater level in 1985 and 2015, (2) understanding of the growth of land use, population density, and underground sew-ers system, and (3) undsew-erstanding the variation of annual rainfall within 30 years’ time period from 1985 to 2015. Finally, data is evaluated including all named factors to understand the changes of groundwater level and the relation of urban growth and annual rainfall variation to the changes of groundwater level in Yogyakarta City for the past 30 years.
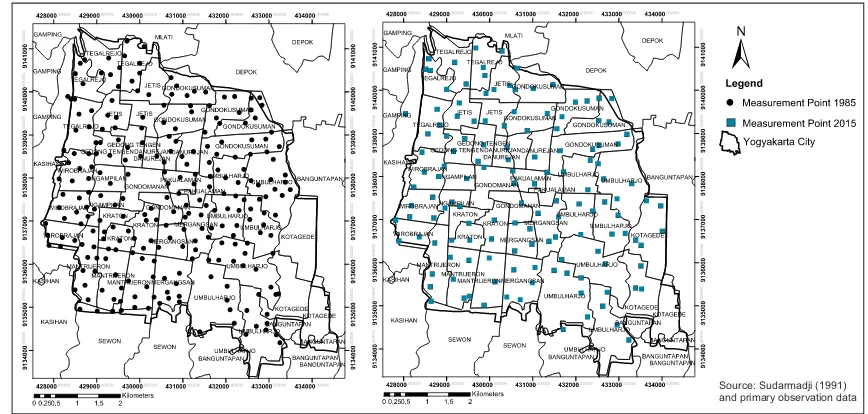
The analysis of the changes of groundwater level is conducted by obtaining groundwater level data in 1985, and through groundwater level observations conducted in July 2015. As shown in Figure 2, Sudarmadji (1991) collected 258 groundwater level measurement points in
1985. Moreover in 2015, 139 groundwater level measurement points were observed.
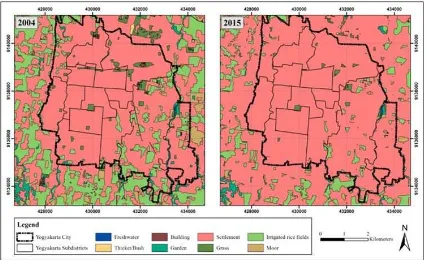
The evaluation of land use data requires satellite images. Land use data of Yogyakarta City in 2004 is classified into six categories: settlement, building, freshwater, irrigated rice fields, thicket/bush, garden, grass and moor. Unfortunately there is no land use data avail-able for the long time period from 1985 until 2003. Thus, the first 20 years of observation re-main uninterpreted in relation to the ground-water level changes. However, data for 2015 is obtained from Google Earth in order to make conclusions for at least the time period of eleven years. The raw image data from June 2015 was implemented in ArcGIS and area were manu-ally attributed to the already existing individual categories of 2004. Population density is calcu-lated based on the population of villages which are divided by the area of each village. Data of population and area of the villages are taken from various statistics reports. Sewer system data is taken form previous research by Putra (2007), which includs sewer system map. The sewer system is overlaid with the population density map.
Source: Sudarmadji (1991) and primary observation data
Figure 2: Data measurement points (black dot: 1985, blue square: 2015).
4 RESULTS ANDDISCUSSION
The graphic comparison of the two maps of land use in Yogyakarta city for 2004 and 2015
are presented in Figure 3. It reveals an
in-crease of settlement area throughout eleven years. Densification of settlement area occured moderately in eastern and southeastern part of Yorgyakarta City. Settlement area increased slightly in the southwestern and norhtwestern part of the city. In contrary to the main city, the suburban region outside of the city boarders experienced an enormous transformation from open land and agricultural land towards settle-ment area between 2004 and 2015.
The population density in Yogyakarta City is classified into low to high categories based on Indonesia’s national standard of urban housing planning procedures (Badan Standardisasi Na-sional, 2004). As shown in Figure 4, high pop-ulation density areas are located in the center of Yogyakarta City, while moderate population density area suround those. The eastern part of Yogyakarta City mostly represents low popula-tion density areas. Sewer systems are installed in the center of Yogyakarta City, extending from north to south. Sewer systems are mainly in-stalled where moderate to high population den-sity exists. It is undestood that higher popula-tion density tends to produce higher wastewa-ter discharge volumes.
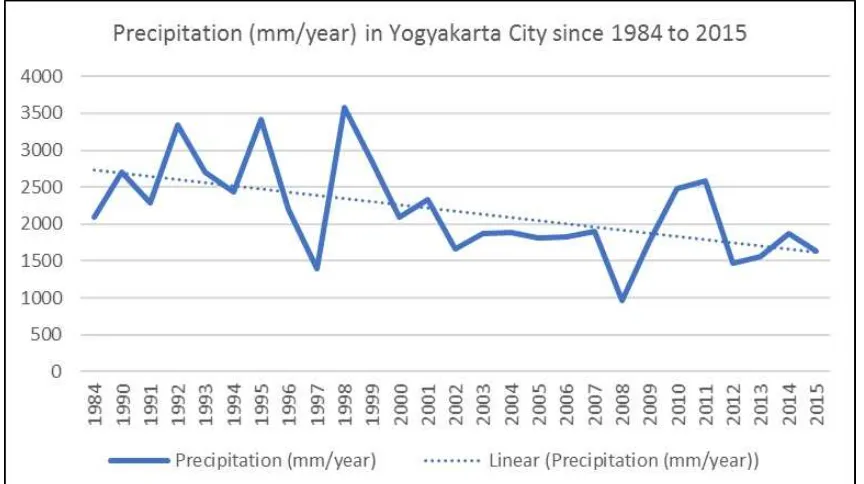
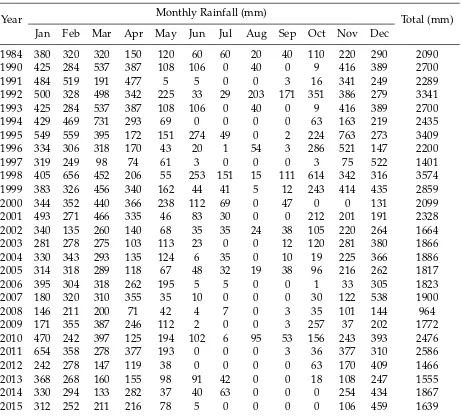
The graph in Figure 5 illustrates the varia-tion of precipitavaria-tion data in 1984 and 1990 to 2015. The annual rainfall from 1984 to 2015 shos
strong fluctuative. However, using trend line, it can be concluded that the precipitation overall decreased from 1984 to 2015.
The comparison of groundwater level maps allows the assessment of groundwater level changes. Figure 6 shows two maps of ground-water level for the years of 1985 and 2015. It is clearly seen that groundwater level change throughout 30 years from 1985 to 2015. A dis-tinct difference is apparent in the northern part and southeastern part of Yogyakarta City.
Figure 7 illustrates the direct temporal changes of groundwater levels between 1985 and 2015. Groundwater level rises in magni-tude of 0–12 m appear in many area which are marked in blue color. The northern part of Yo-gyakarta City encounters the highest ground-water level rise of 3–12 m compared to the condition in 1985. Groundwater level mainly rises for about 0–3 m. Whilst in the eastern part of Yogyakarta City a declining of the ground-water level of 0–9 m occurs, the northern part of Kotagede subdistrick experience 0–9 m lower groundwater levels. However in some area in the western part of the city, groundwater levels declines happens locally.
Figure 3: Land use of Yogyakarta City in 2004 and 2015.
the causes for various changes of groundwa-ter level across Yogyakarta City, the changes of groundwater level were attributed to sewer system lines and population density. As pre-sented in Figure 8, areas experiencing a rise of groundwater levels are located in low to high population density parts where sewers system have been installed. On the contrary, in low population density area with no existing sewer system experience the lowering of groundwa-ter levels. Therefore, population density and sewers system are expected to possess a bigger impact to the changes of groundwater level.
Estimation of wastewater discharge from urban population of 2.43 × 10⁶ m³/a in Yo-gyakarta City (Putra, 2007) is considered as urban recharge to the groundwater. In addition an estimated sewage leakage of 0.35 × 10⁶ m³/a in Yogyakarta City (Putra, 2007) contributes to urban recharge which cause the rising of groundwater level. Therefore, combination of urban recharge and sewage leakage lead to the rising of groundwater level in higher popula-tion density area in Yogyakarta City. Further-more, these results are consistent with Putra (2007) groundwater quality analysis which detected high concentration of nitrate and co-liform bacteria in shallow groundwater in the middle and western part of Yogyakarta City. There, nitrate concentration of 50 to more than
100 mg/L and coliform bacteria contents of 100 to more than 2000 MPN/100 ml are investi-gated (Putra, 2007). Nonetheless, local changes of groundwater level still can be considered as an impact of local pumping due to dewatering.
5 CONCLUSIONS
The comparison of groundwater levels in 1985 and 2015 shows various spatial changes. Groundwater levels in Yogyakarta City, In-donesia mostly rose at 0–3 m. In the northern part of the city encounter highest groundwater level rise of 3–12 m. Whilst groundwater levels in the eastern part of Yogyakarta City generally declined by 0–3 m. The maximum of ground-water level decline occured in the southeastern part of the city at magnitude of 6–9 m. In some areas, groundwater level declines occured on local scale.
Population Density
Low
2 (< 15,000 people/km ) Moderate
2 (15,000-20,000 people/km ) High
2 (20,000-25,000 people/km ) Very High
2 (> 25,000 people/km )
Source:
Putra (2007); Ekowati (2016); Gumita (2016); Hariyadi (2016); Khalimi (2016);
Kuswanto (2016); Manijo (2016); Nugroho (2016); Purnawan (2016); Purwanto (2016); Purwoko (2016); Putranto (2016); Sarmuji (2016); Sussiatri (2016); Widodo (2016);
Map of Population Density and Sewers System in Yogyakarta City, Indonesia
Figure 4: Population density and sewers system (wastewater pipe network) in Yogyakarta City (data from Ekowati, 2016; Gumita, 2016; Hariyadi, 2016; Khalimi, 2016; Kuswanto, 2016; Manijo, 2016; Nugroho, 2016; Purnawan, 2016; Purwanto, 2016; Purwoko, 2016; Putra, 2007; Putranto, 2016; Sarmuji, 2016; Sussiatri, 2016; Widodo, 2016).
Measurement Point
Data 1985 Data 2015
Map of Temporal Groundwater Level of Yogyakarta City, Indonesia
Source: Sudarmadji (1991) and primary observation data
Figure 6: Groundwater level of Yogyakarta City in 1985 and 2015 (Sudarmadji, 1991 and observation data).
Magnitude of the Changes of Groundwater Level
Map of Groundwater Level Changes, Yogyakarta City, Indonesia
Magnitude of the Changes of Groundwater Level
Map of Groundwater Level Changes, Sewers System, and Population Density in Yogyakarta City, Indonesia
Population Density
Low 2
(< 15,000 people/km )
Moderate 2
(15,000-20,000 people/km )
High 2
(20,000-25,000 people/km )
Figure 8: Changes of groundwater level attributed to sewer system and population density in Yo-gyakarta City, Indonesia.
rising of groundwater levels mostly are located in low to high population density areas where sewer system is installed. Local variation of grondwater level changes still can be ascribed to the impact of local pumping.
ACKNOWLEDGEMENTS
Authors would like to thank Department of Ge-ological Engineering Universitas Gadjah Mada, Indonesia for supporting this research. The first author also would like to thank the correspond-ing reference person from RWTH Aachen Uni-versity, Germany, Dr. Klaus Baier who helped to arrange the opportunity for research in In-donesia.
REFERENCES
Asriningtyas, V., Putra, D.P.E. (2006). Ten Year Groundwater Simulation in Merapi Aquifer, Sle-man, DIY, Indonesia. Indonesian Journal of Ge-ography, 38(1), 1–14.
Badan Standardisasi Nasional. Tata Cara Peren-canaan Lingkungan Perumahan di Perkotaan, Pub. L. No. SNI 03-1733-2004, 52 (2004). Indone-sia.
BPS-statistics of DI Yogyakarta Province (2002) Daerah Istimewa Yogyakarta in Figures 2001.
Yogyakarta: BPS-statistics of DI Yogyakarta Province.
BPS-statistics of DI Yogyakarta Province (2003) Daerah Istimewa Yogyakarta in Figures 2002. Yogyakarta: BPS-statistics of DI Yogyakarta Province.
BPS-statistics of DI Yogyakarta Province (2004) Daerah Istimewa Yogyakarta in Figures 2003. Yogyakarta: BPS-statistics of DI Yogyakarta Province.
BPS-statistics of DI Yogyakarta Province (2005) Daerah Istimewa Yogyakarta in Figures 2004. Yogyakarta: BPS-statistics of DI Yogyakarta Province.
BPS-statistics of DI Yogyakarta Province (2006) Daerah Istimewa Yogyakarta in Figures 2005. Yogyakarta: BPS-statistics of DI Yogyakarta Province.
BPS-statistics of DI Yogyakarta Province (2007) Daerah Istimewa Yogyakarta in Figures 2006-2007. Yogyakarta: BPS-statistics of DI Yogyakarta Province.
BPS-statistics of DI Yogyakarta Province (2008) Daerah Istimewa Yogyakarta in Figures 2008. Yogyakarta: BPS-statistics of DI Yogyakarta Province.
Yogyakarta: BPS-statistics of DI Yogyakarta Province.
BPS-statistics of DI Yogyakarta Province (2010) Daerah Istimewa Yogyakarta in Figures 2010. Yogyakarta: BPS-statistics of DI Yogyakarta Province.
BPS-statistics of DI Yogyakarta Province (2011) Daerah Istimewa Yogyakarta in Figures 2011. Yogyakarta: BPS-statistics of DI Yogyakarta Province.
BPS-statistics of DI Yogyakarta Province (2012) Daerah Istimewa Yogyakarta in Figures 2012. Yogyakarta: BPS-statistics of DI Yogyakarta Province.
BPS-statistics of DI Yogyakarta Province (2013) Daerah Istimewa Yogyakarta in Figures 2013. Yogyakarta: BPS-statistics of DI Yogyakarta Province.
BPS-statistics of DI Yogyakarta Province (2014) Daerah Istimewa Yogyakarta in Figures 2014. Yogyakarta: BPS-statistics of DI Yogyakarta Province.
BPS-statistics of DI Yogyakarta Province (2015) Daerah Istimewa Yogyakarta in Figures 2015. Yogyakarta: BPS-statistics of DI Yogyakarta Province.
BPS-statistics of DI Yogyakarta Province (2016) Daerah Istimewa Yogyakarta in Figures 2016. Yogyakarta: BPS-statistics of DI Yogyakarta Province.
BPS-statistics of Yogyakarta City (2009) Yogyakarta City in Figures 2009. Yogyakarta: BPS-statistics of Yogyakarta City.
Ekowati, E.D. (2016) Statistik Daerah Kecamatan Umbulharjo 2016. Yogyakarta: BPS Kota Yo-gyakarta.
Gumita, H.E. (2016) Statistik Daerah Kecamatan Da-nurejan 2016. Yogyakarta: BPS Kota Yogyakarta. Hariyadi (2016) Statistik Daerah Kecamatan
Mantri-jeron 2016. Yogyakarta: BPS Kota Yogyakarta. Hendrayana, H., Vicente, V.A.D.S. (2013) Cadangan
Air Tanah berdasarkan Geometri dan Konfigurasi Sistem Akuifer Cekungan Air Tanah Yogyakarta-Sleman. In Prosiding Seminar Nasional Kebu-mian Ke-6 (pp. 356–375). Yogyakarta: Teknik Ge-ologi Universitas Gadjah Mada.
Karamouz, M., Nazif, S., & Falahi, M. (2013). Hydrology and Hydroclimatol-ogy: Principles and Applications (vol. 27). https://doi.org/10.1201/b13771
Khalimi, N. (2016) Statistik Daerah Kecamatan Ko-tagede 2016. Yogyakarta: BPS Kota Yogyakarta. Kuswanto (2016) Statistik Daerah Kecamatan
Wiro-brajan 2016. Yogyakarta: BPS Kota Yogyakarta. MacDonald & Partners (1984) Greater Yogyakarta
Groundwater Resources Study, Volume 3: Groundwater. Directorate General of Water Re-sources Development Project (P2AT), Ministry
of Public Works, Government of the Republic Indonesia.
Manijo (2016) Statistik Daerah Kecamatan Jetis 2016. Yogyakarta: BPS Kota Yogyakarta.
Marwasta, D. (2010) Yogyakarta Urban Growth Ver-sus Smart Growth : Towards Yogyakarta Slow City Proposal. In Seminar on “To Solve Problem Through Art and Cultural Activities” (pp. 1–16). Yogyakarta: Urban Research Plaza Yogyakarta Sub-Center.
Morris, B.L., Lawrence, A.R.L., Chilton, P.J.C., Adams, B., Calow, R.C., Klinck, B.A. (2003) Groundwater and its Susceptibility to Degra-dation: A Global Assessment of the Problem and Options for Management, Early Warning and Assessment Report Series (RS. 03-3). Nairobi: United Nations Environment Programme. Nugroho, A. G. (2016) Statistik Daerah Kecamatan
Gondokusuman 2016. Yogyakarta: BPS Kota Yo-gyakarta.
Purnawan, I.D. (2016) Statistik Daerah Kecamatan Gedongtengen 2016. Yogyakarta: BPS Kota Yo-gyakarta.
Purwanto, A. (2016) Statistik Daerah Kecamatan Gondomanan 2016. Yogyakarta: BPS Kota Yo-gyakarta.
Purwoko, S.Z. (2016) Statistik Daerah Kecamatan Mergangsan 2016. Yogyakarta: BPS Kota Yo-gyakarta.
Putra, D.P.E. (2003) Integrated Water Resources Management in Merapi-Yogyakarta Basin. Yo-gyakarta.
Putra, D.P.E. (2007) The Impact of Urbanization on Groundwater Quality A Case Study in Yo-gyakarta City. RWTH Aachen.
Putra, D.P.E., Iqbal, M., Hendrayana, H., Putranto, T.T. (2013) Assessment of Optimum Yield of Groundwater Withdrawal in the Yogyakarta City, Indonesia. Journal of South East Asian Applied Geology, 5(1), 41–49.
Putranto, M.E. (2016) Statistik Daerah Kecamatan Kraton 2016. Yogyakarta: BPS Kota Yogyakarta. Rahardjo, W., Sukandarrumidi, Rosidi, H.M.D.
(1995) Geological Map of Yogyakarta Quadran-gle. Scale 1:100.000. Geological Research and Development Center of Indonesia.
Remondi, F., Burlando, P., Vollmer, D. (2016) Ex-ploring the hydrological impact of increas-ing urbanisation on a tropical river catch-ment of the metropolitan Jakarta, Indonesia. Sustainable Cities and Society, 20, 210–221. https://doi.org/10.1016/j.scs.2015.10.001. Sarmuji (2016) Statistik Daerah Kecamatan
Ngampi-lan 2016. Yogyakarta: BPS Kota Yogyakarta. Sudarmadji (1991) Agihan geografi sifat kimiawi
Sussiatri (2016) Statistik Daerah Kecamatan Tegal-rejo 2016. Yogyakarta: BPS Kota Yogyakarta. Widodo, K. (2016) Statistik Daerah Kecamatan
Table 1: Rainfall data in Yogyakarta City in 1984 and 1990 to 2015.
Year Monthly Rainfall (mm) Total (mm)
Jan Feb Mar Apr May Jun Jul Aug Sep Oct Nov Dec
1984 380 320 320 150 120 60 60 20 40 110 220 290 2090
1990 425 284 537 387 108 106 0 40 0 9 416 389 2700
1991 484 519 191 477 5 5 0 0 3 16 341 249 2289
1992 500 328 498 342 225 33 29 203 171 351 386 279 3341
1993 425 284 537 387 108 106 0 40 0 9 416 389 2700
1994 429 469 731 293 69 0 0 0 0 63 163 219 2435
1995 549 559 395 172 151 274 49 0 2 224 763 273 3409
1996 334 306 318 170 43 20 1 54 3 286 521 147 2200
1997 319 249 98 74 61 3 0 0 0 3 75 522 1401
1998 405 656 452 206 55 253 151 15 111 614 342 316 3574
1999 383 326 456 340 162 44 41 5 12 243 414 435 2859
2000 344 352 440 366 238 112 69 0 47 0 0 131 2099
2001 493 271 466 335 46 83 30 0 0 212 201 191 2328
2002 340 135 260 140 68 35 35 24 38 105 220 264 1664
2003 281 278 275 103 113 23 0 0 12 120 281 380 1866
2004 330 343 293 135 124 6 35 0 10 19 225 366 1886
2005 314 318 289 118 67 48 32 19 38 96 216 262 1817
2006 395 304 318 262 195 5 5 0 0 1 33 305 1823
2007 180 320 310 355 35 10 0 0 0 30 122 538 1900
2008 146 211 200 71 42 4 7 0 3 35 101 144 964
2009 171 355 387 246 112 2 0 0 3 257 37 202 1772
2010 470 242 397 125 194 102 6 95 53 156 243 393 2476
2011 654 358 278 377 193 0 0 0 3 36 377 310 2586
2012 242 278 147 119 38 0 0 0 0 63 170 409 1466
2013 368 268 160 155 98 91 42 0 0 18 108 247 1555
2014 330 294 133 282 37 40 63 0 0 0 254 434 1867
2015 312 252 211 216 78 5 0 0 0 0 106 459 1639