A TWO-STEP CLASSIFICATION APPROACH TO DISTINGUISHING SIMILAR
OBJECTS IN MOBILE LIDAR POINT CLOUDS
Hanxian He a, *, Kourosh Khoshelham a, Clive Fraser a, b
a
Geomatics Group, Dept. of Infrastructure Engineering, University of Melbourne, Australia- [email protected], [email protected], [email protected]
b
Cooperative Research Centre for Spatial Information, VIC 3053, Australia
KEY WORDS: Shape Recognition, Lidar, Point Cloud, Point Feature Histogram, Bag-of-features, Laser Scanning, Mapping.
ABSTRACT:
Nowadays, lidar is widely used in cultural heritage documentation, urban modeling, and driverless car technology for its fast and accurate 3D scanning ability. However, full exploitation of the potential of point cloud data for efficient and automatic object recognition remains elusive. Recently, feature-based methods have become very popular in object recognition on account of their good performance in capturing object details. Compared with global features describing the whole shape of the object, local features recording the fractional details are more discriminative and are applicable for object classes with considerable similarity. In this paper, we propose a two-step classification approach based on point feature histograms and the bag-of-features method for automatic recognition of similar objects in mobile lidar point clouds. Lamp post, street light and traffic sign are grouped as one category in the first-step classification for their inter similarity compared with tree and vehicle. A finer classification of the lamp post, street light and traffic sign based on the result of the first-step classification is implemented in the second step. The proposed two-step classification approach is shown to yield a considerable improvement over the conventional one-step classification approach.
* Corresponding author
1. INTRODUCTION
With the rapid development of 3D lidar technology, point clouds are becoming ever more widely used across various application fields, including building modeling, road mapping, road monitoring and nowadays driverless car technology. Compared with traditional data acquisition methods in photogrammetry and remote sensing, lidar scanners are faster and invariably more accurate in their collection of huge amounts of unstructured 3D point data. However, raw point clouds contain geometric information only, and extracting semantics such as object types is a challenging task. Considering the complexity of data and the variety of object types, it is a difficult and labour-intensive task to manually extract objects from point clouds. Therefore, the development of methods for automated and efficient object recognition in point clouds is of considerable importance.
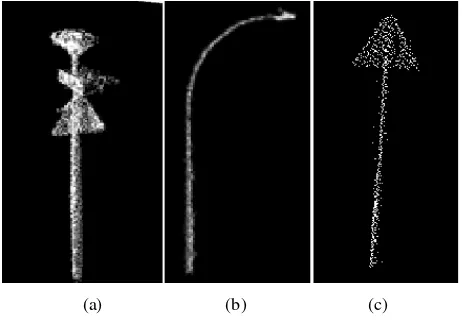
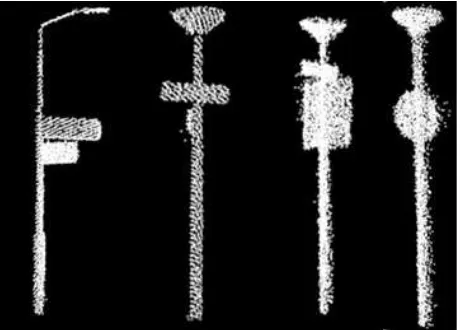
A common approach to object recognition in point clouds is supervised classification based on the geometric features of objects of interest. The types of features used in classification methods can be divided into two main categories: global features and local features (Bayramoglu and Alatan, 2010; Castellani et al., 2008). Global features, such as size and height, describe the overall shape of the object, whereas local features captured at key points characterize the object surface within local neighborhoods (Tangelder and Veltkamp, 2008). Although global features are useful for the recognition of objects with large intra-class variability (Lehtomäki et al., 2010a; Vosselman et al., 2004), they are not sufficiently discriminative for object classes which are similar, such as the different pole-like objects shown in Figure 1.
In contrast, local features capture the detail of objects, which makes it possible to distinguish similar objects with local
differences. However, in order to achieve an acceptable classification accuracy, local features need to be encoded into a sufficiently discriminative high-dimensional feature vector. Consequently, a relatively large number of training samples is required to sufficiently train the classifier, which is a practical challenge in point cloud classification (Khoshelham and Oude Elberink, 2012). In the literature, similar objects have often been grouped into more general categories, such as pole-like objects (Rodríguez-Cuenca et al., 2015; Yokoyama et al., 2013). Poor classification accuracies have generally been reported for similar objects when they have not been grouped (Golovinskiy et al., 2009; Pu et al., 2011).
(a) (b) (c)
Figure 1. Street light, lamppost, and traffic sign have global similarity but local differences.
(Csurka et al., 2004) method. We propose a two-step classification approach to overcome training sample limitations. We experiment with different supervised classifiers to evaluate the performance of our method.
The paper is organized into five sections. Section 2 provides a review of the state of the art. In Section 3, the proposed classification method based on point feature histograms and bag of features is described. Section 4 discusses the results of classification experiments and, finally, conclusions are provided in Section 5.
2. LITERATURE REVIEW
Point cloud classification methods can be divided into two main categories: point-based and segment-based. In point-based methods, local features are extracted from small neighborhoods around individual points. Point-based methods have been widely used for the detection of ground, wall and basic structures. The Geometric Index (GI) (Rodríguez-Cuenca et al., 2015) is one of the most widely used local features for point cloud classification. Directional Associate Markov Network (AMN) was used by Munoz et al. (2008) to classify wires, poles, ground and scatter. Jutzi and Gross (2009) and Weinmann et al. (2015) used features derived from eigenvalues of the covariance matrix of the points in local neighborhoods. The neighborhood selection, definition, and combination of different geometric features in 2D and 3D are analyzed by Weinmann et al. (2015).
In segment-based methods, individual points are grouped into segments, and segment features are used for classification (Golovinskiy et al., 2009; Khoshelham et al., 2013; Pu et al., 2011). Golovinskiy et al. (2009) considered multiple object classes in an urban area and reported low classification accuracy (60%) for some object classes. Velizhev et al. (2012) improved this workflow by using the Spin image and implicit shape model (ISM) and achieved a precision of 68% and 72% for cars and light poles, respectively. These were the only object classes considered in their experiment. Yang et al. (2015) achieved a good accuracy level for the extraction of urban objects based on segmentation of super-voxels, rather than individual points, using a set of rules defined for uniting separate segments. However, the design of rules and the setting of thresholds in the identification and classification of different object classes required manual interpretation and interaction based on the shape (geometric structure), height and width information of each object.
Detection of pole-like objects such as tree trunks, traffic signs, and light poles have been widely studied for their unique structure (Cabo et al., 2014; Landa and Ondroušek, 2016; Lehtomäki et al., 2010b; Yokoyama et al., 2011). 3D Hough transform combined with RANSAC has been shown to work well in the detection of pole-like structures by Vosselman et al. (2004). In the research of Brenner (2009), a pole is recognized by decomposing it into sliced horizontal stacks with a kernel region and outer ring of the kernel. Lam et al. (2010) applied a robust vertical line fitting method to detect poles. The Minimum Bounding Rectangle (MBR), Minimum Bounding Circle and height percentiles were used to detect planar shapes and poles, respectively, by Pu et al. (2011). Radial distance, mean value and standard deviation of points in a local cylindrical neighborhood were employed by Rodríguez-Cuenca et al. (2015). Scan line information has also proved very useful in the automated detection of vertical pole-like structures in road
environments (Lehtomäki et al., 2010a). Cabo et al. (2014) detected pole structures by the inner and outer radius after voxelization of points. While, most of these methods assumed that poles are vertical, the pairwise 3-D shape context method introduced by Yu et al. (2015) works independently of the pose of pole-like objects.
The classification of pole-like objects is mainly achieved by setting a series of thresholds for feature values (Aijazi et al., 2013; Li and Elberink, 2013; Masuda et al., 2013; Pu and Vosselman, 2009; Yang et al., 2015; Yokoyama et al., 2013). The shortcoming of these knowledge-based methods is that the thresholds should be adjusted under different scenarios. The accuracy of classification is highly related to the threshold setting. Supervised machine learning methods are adopted in the classification of similar pole-like objects for its independence from threshold setting (Fukano and Masuda, 2015; Lai and Fox, 2009). However, the limitation of supervised machine learning based methods is the requirement of a large number of training samples.
The limitation and imbalance of training samples for some object classes pose a significant challenge for the classification of point clouds. Khoshelham et al. (2013) and Weinmann et al. (2015) used feature selection methods to reduce the required number of training samples. Azadbakht et al. (2016) investigated different sampling strategies to overcome an imbalance in the distribution of training samples. In this paper, we propose a two-step classification method for distinguishing similar objects with insufficient and unbalanced training data.
3. METHODOLOGY
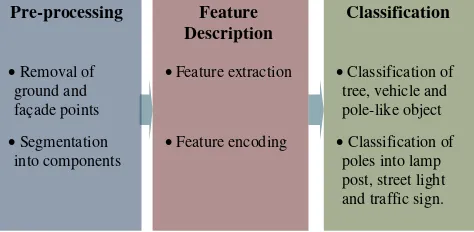
The conceptual framework of the proposed approach is shown in Figure 2. It includes data pre-processing, feature description, and object classification. In the pre-processing phase, points on the ground and on building façades are removed. The remaining points are grouped into individual segments. These individual segments are manually labelled for the training and evaluation of the adopted classifier. Then, point feature histograms are computed as local features and then encoded into high-level features using the bag-of-features method. Finally, the classification of the segments is performed in two steps.
Figure 2. The conceptual framework of the method consisting of data pre-processing, feature extraction and classification.
3.1. Pre-processing
In segment-based classification methods, the removal of the points on the ground, along with those on building facades, roofs, and fences, helps achieve a better segmentation result.
Classification
•Classification of tree, vehicle and pole-like object
• Classification of poles into lamp
3.1.1 Removal of Ground and Façade Points: To remove the ground points, we use a variant of the progressive TIN densification algorithm (Axelsson, 2000) which is implemented in Lastools(1). The algorithm requires the setting of four parameters for the filtering of ground points, namely step, spike, offset and standard deviation. In the Lasground tool, suitable values for these parameters are recommended according to land cover type. In this paper, “city and warehouse” was selected as the land cover type, based on the data in this experiment. The building roofs and façades were removed manually in Cloud Compare(2).
3.1.2 Connected Component Segmentation: After the filtering of ground and façade points, a connected component segmentation is applied to group the points into individual segments. The connected component segmentation is based on the assumptions that points that are closer than a certain distance belong to one connected component. Different connected component parameters were compared by the performances of segmentation. The maximum distance between points and the minimum number of points of the segment were set as 0.2m, and 500 respectively after comparative experiments. To perform the connected component segmentation more efficiently, the point cloud is first restructured in an octree data structure. After the segmentation, every individual object should ideally be segmented as one single component. In this paper, we focus on the evaluation of classification performance and, therefore, over-segmentation and under-segmentation errors are manually removed at this stage.
3.2 Feature Description
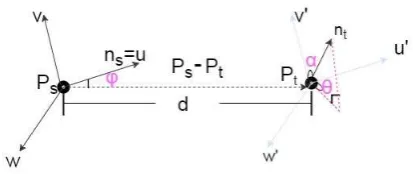
3.2.1 Feature Extraction: To avoid the influence of occlusions and low point density, we extract local features at every point in each segment rather than at key points only. To extract local features, we use Point Feature Histograms (PFH), and to combine local features into segment features we use the bag of features method (Csurka et al., 2004). The PFH is a robust multi-dimensional feature descriptor that describes the local geometry around the surface points (Wahl et al., 2003). It has been demonstrated to be effective in labelling 3D points based on the type of surface it belongs to, and it is very discriminative in classifying various geometric primitives (cylinder, plane, sphere, cone, torus, corner and edge) (Rusu et al., 2008).
In order to calculate the PFH, k neighbors of the query point are selected. A value of 6 was experimentally found suitable for k. For each pair of points (Pt, Ps) and their associated normals (nt,
ns), a Darboux frame coordinate system is defined as shown in
Figure 3. The axes of the coordinate system are defined as:
u = ns (1)
d
p - pst = u × v
(2)
w = u ×v (3)
(1)
https://rapidlasso.com/lastools/ (2)
http://www.danielgm.net/cc/
Figure 3. The Darboux frame coordinate system defined for calculating three angular features for a pair of points.
(Reproduced from point cloud library(3).)
The angular features describing the difference between the two normals ns and ntare defined as:
t
α= ⋅v n (4)
( )
t s d
ϕ= ⋅u p −p (5)
1
tanh ( , )
t t
θ= − w × n u × n
(6)
The distance d used here between point Pt and Ps is the
Euclidean distance. After all the triplets <α, φ, θ> between each pair of two points in the k-neighbourhood are computed, the set of all triplets at the query point is binned into a histogram, the PFH. In this process, the value of each feature is divided into 5 subdivisions and the number of occurrences in each subinterval is counted. In order to avoid the overlapping of the values of these three features in each bin interval, a histogram with 53 bins in a fully correlated space is created.
3.2.2 Feature Encoding: Feature encoding by bag-of-features is performed by constructing a vocabulary of dominant local features from the data directly and creating a histogram of these features for each segment. The construction of the vocabulary is done by the k-means clustering algorithm (MacQueen, 1967). Each cluster center is the mean of a number of similar point feature histograms and represents a frequently appearing local surface characteristic. Once the vocabulary is constructed, a bag of features is created for each segment by counting the number of point feature histograms assigned to each cluster. The resulting histogram encodes the point feature histograms into a feature vector for the segment.
3.3 Classification
After all point feature histograms are encoded into segment features, a classifier can be trained using the manually labelled training samples. In order to classify the segments, we consider five object classes: vehicle, tree, lamp post, traffic sign and street light. As we will see, the application of the classifier in a single step will result in poor classification accuracies for similar object classes, i.e. lamp post, traffic sign, and street light, which are less abundant in the data, and are, therefore, represented with fewer training samples. To alleviate this problem, we propose a two-step classification approach. In the first step, a classifier is trained to classify the segments into three general classes: vehicle, tree and mixed pole. In the second step, a classifier is trained to classify the mixed poles into three specific classes: lamp post, traffic sign, and street light.
(3)
We experiment with several classifiers: Gaussian support vector machines (SVM) (Andrew, 2000), random forest (Breiman, 2001), decision tree (Quinlan, 1986), and discriminant analysis (Klecka, 1980). SVM classifiers try to find the best hyperplanes with the largest margin to separate one class from another. The performance of SVM is highly dependent on the kernels applied and the data to be classified. In our experiment, the Gaussian kernel is selected for its superior performance over the other two kernels. Decision tree makes a prediction by following the decision in the tree from the root node down to a leaf node. Random forest is an ensemble method that aggregates the results of multiple weak classifiers, each trained by a bootstrap subset of the training set. The quadratic discriminant classifier computes a quadratic decision boundary between training samples of different categories. The parameters of different models under each classifier were trained by optimization experiments and k-fold cross validation.
4. RESULTS AND ANALYSIS 4.1 Data Description
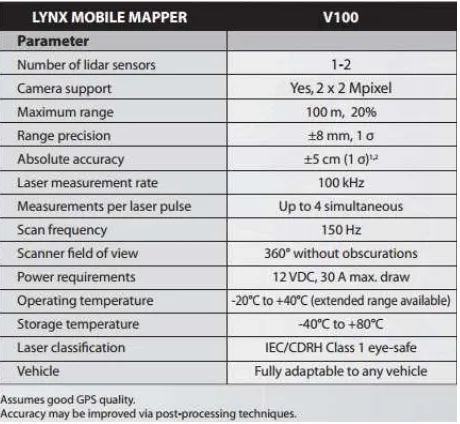
The experimental dataset was collected by the German company TopScan in December 2008 using an Optech Lynx Mobile Mapper system, the basic specifications of which are shown in Figure 4. The data was recorded over the city of Enschede, Netherlands. Two rotating scanning sensors were mounted on the top of the vehicle with scanning planes at 45 degrees angles to the central lane, and perpendicular to each other. The vehicle drove at 50km/h and scanned 20kms of the road. The strip overview is shown in Figure 5.
Figure 4. Optech LYNX Mobile Mapper specifications.
The result of the ground points removal is shown in Figure 6. After removal of building and ground points, further segmentation and labeling were conducted, as indicated in Figure 7. The Lidar data collected in strip 4, 5, 6, 12, and 13 are used in this paper.
The training dataset was created by manually labeling the segments using an interface developed in Matlab, which allowed 3D viewing and rotation of each segment, as seen in Figure 8. The number of segments after pre-processing is described in Table 1.
A feature vector was generated for each segment by extracting point feature histograms and encoding these by the bag of features method. We used 125 bins for the PFHs and initially set the vocabulary size in the bag of features method as 30, resulting in a feature vector of length 30 for each segment.
Figure 5.Overview of the scanned strips from the experimental dataset.
Figure 6. Classification of ground and non-ground points. Ground points are in red and non-ground points in green.
Figure 8. Interface for manual labeling of the segments.
Table 1. Number of labelled segments after segmentation and manual labeling.
4.2 One-step Classification
Using the labelled segments each represented by a bag of features, we trained the Gaussian SVM, random forest, decision tree and quadratic discriminant classifiers. The scale of the Gaussian kernel in Gaussian SVM was set as 1 /sqrt P( ) (P is the number of features). In the decision tree, a value of 13 was experimentally found appropriate for the number of minimum leaf size, and the twoing rule (Steinberg, 2009) was adopted as the split criterion. In the random forest, the tree template had the same setting with the decision tree, and 100 was experimentally set as the number of learners.
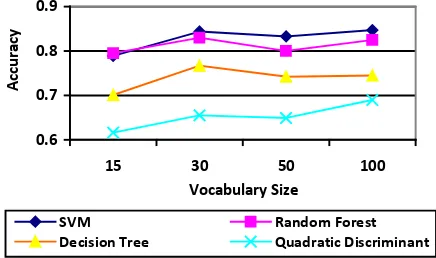
An experiment with different vocabulary sizes (i.e. the number of features per segment) was then conducted to test the performance of the classifiers. We set the upper and lower limits as 15 and 100 according to the number of labelled segments. The accuracy of the classifiers against vocabulary sizes 15, 30, 50 and 100 is shown in Figure 9.
Figure 9. Classification accuracy with different vocabulary sizes
Usually, a larger vocabulary size provides higher discriminative power at the cost of an increase in both storage and processing time (Alonso et al., 2011). The result of the test with different vocabulary sizes reveals that the classifiers showed good performance at a relatively small vocabulary size of 30. Thus, in the following experiments, the vocabulary size is set as 30. Also, the quadratic discriminant classifier is not included in the following experiments due to its low accuracy at all vocabulary size settings.
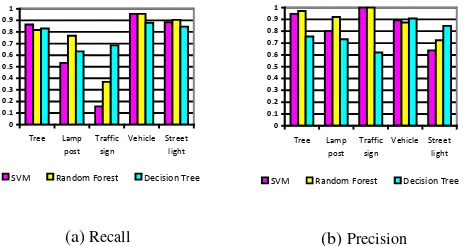
The classifiers were then evaluated in a one-step classification using a five-fold cross-validation scheme. The training dataset was divided into five folds, and in five iterations the classifier was trained with four folds and tested with the remaining fold. The average precision and recall over the five tests were used as performance measures for the classifiers. The result of the one-step classification is shown in Figure 10.
0
SVM Random Forest Decision Tree
(a) Recall
SVM Random Forest Decision Tree
(b) Precision
Figure 10. Recall and precision of one-step classification obtained from 5-fold cross validation with vocabulary size
equal to 30.
As it can be seen, vehicles and trees are classified with higher precision and recall than the other three classes. Lamp posts are classified with a low recall, and street lights are classified with a low precision. For the class traffic sign, all classifiers perform poorly as both precision and recall values are below 30%. The number of correctly recognized items is recorded in Table 2.
Label True Number
Number of Recognized items
SVM Random
Table 2. The number of correctly recognized items in one-step classification method.
Figure 11. Structural diversity of traffic signs.
In addition, the lamp posts and street lights in this dataset are all somehow attached with sign boards, which make the classification of light poles and traffic signs more complex and difficult. Light poles attached with sign boards can be seen in Figure 12.
Figure 12. Light poles are sometimes attached to sign boards.
4.3 Two-step Classification
As is shown in Figure 10, the one-step classification accuracy for street light, traffic sign, and lamp post classes is relatively low. Compared with tree and vehicle, these three categories all share a similar pole-like structure and have a low number of samples. In order to improve the classification result, a two-step classification is performed. At the first step, three general classes, i.e tree, mixed class (lamp post, traffic sign, and street light), and vehicle are classified. In the second step, the classifiers are first trained with the manually labelled segments, and then applied to those segments that were classified as mixed in the first step. The result of the first-step three-class classification in the hierarchical classification scheme is shown in Figure 13 and the number of correctly recognized items in this classification is recorded in Table 3.
0.7 0.75 0.8 0.85 0.9 0.95 1
Tree Mixed Vehicle
SVM Random Forest Decision Tree
(a) Recall
0.7 0.75 0.8 0.85 0.9 0.95 1
Tree Mixed Vehicle
SVM Random Forest Decision Tree
(b) Precision
Figure 13. Recall (a) and precision (b) values obtained from 5-fold cross validation in the first step.
Label True Number
Recognized Number
SVM Random Forest
Decision Tree
Tree 82 71 67 68
Mixed 101 90 87 87
Vehicle 182 174 174 160
Table 3 Number of correctly recognized objects in the first step.
From the first step, we can see that SVM outperforms the other two classifiers. The result is consistent with the result of one-step classification. Thus, the classification result of each classifier in the first step is adopted as testing data in the second step, while the manually labelled segments are used as training data. In decision tree, 5 was tested as the best choice of the number of minimum leaf size. The result of the second step classification is shown in Figure 14.
0 0.2 0.4 0.6 0.8 1
Lamp post Traffic sign Street light
SVM Random Forest Decision Tree
(a) Recall
0 0.2 0.4 0.6 0.8 1
Lamp post Traffic sign Street light
SVM Random Forest Decision Tree
(b) Precision Figure 14. Recall and Precision values in the second step of
two-step classification.
The number of correctly recognized items in the two classification steps is recorded in Table 4.
Label True Number
Recognized Number
SVM Random Forest
Decision Tree
Tree 82 71 67 68
Lamp post 30 16 23 19
Traffic sign 19 3 7 13
Vehicle 182 174 174 160
Street light 52 46 47 44
Table 4 The number of correctly recognized items in the second step.
0
SVM Random Forest Decision Tree
(a) Recall
SVM Random Forest Decision Tree
(b) Precision Figure 15. Recall and precision of two-step classification.
From a comparison of the first and second steps of the two-step classification, we can see that SVM outperformed the ensemble (random forest) and decision tree methods in the first step, where tree, mixed, and vehicle are each very distinguishable. However, in the second step, when the items are more difficult to separate, the SVM yielded relatively poor performance when compared with the two other classifiers. The two-step classification generated a better result compared to the one-step method, largely due to the fact that the one-step classification could not handle well an unbalanced dataset in which it was difficult to distinguish between basically similar objects belonging to different categories, i.e. traffic signs, lamp posts and street lights.
5. CONCLUSION
In this paper, the application of point feature histograms combined with the bag-of-features method for segment-based classification of mobile lidar point clouds was investigated. The proposed two-step classification approach for distinguishing similar objects with unbalanced data was shown to yield a significant improvement over the conventional one-step classification approach. The PFH based bag-of-feature method provides an effective representation of local surface characteristics of objects and therefore has the potential for the classification of point clouds into more specific object classes and object parts. In the future, other local features will be tested, combined with various encoding methods to examine performance differences. Additionally, the proposed two-step method will be tested on more categories with intra-class variability, not only on pole-like objects.
ACKNOWLEDGEMENTS
This research is supported by the Melbourne International Engagement Award provided by the University of Melbourne. The authors are grateful to the data provided by TopScan. The Faculty ITC of the University of Twente is also gratefully acknowledged for providing the software Point Cloud Mapper.
REFERENCES
Aijazi, A.K., Checchin, P., Trassoudaine, L., 2013. Segmentation based classification of 3D urban point clouds: A super-voxel based approach with evaluation. Remote Sensing 5, 1624-1650.
Alonso, M.C., Malpica, J.A., de Agirre, A.M., 2011. Consequences of the Hughes phenomenon on some
classification Techniques, ASPRS 2011 Annual Conference, Milwaukee, Wisconsin May, pp. 1-5.
Andrew, A.M., 2000. An Introduction to Support Vector Machines and Other Kernel-Based Learning Methods by Nello Christianini and John Shawe-Taylor, Cambridge University Press, Cambridge, 2000, xiii+ 189 pp., ISBN 0-521-78019-5 Cambridge Univ Press.
Axelsson, P., 2000. DEM generation from laser scanner data using adaptive TIN models. International Archives of Photogrammetry and Remote Sensing 33, 111-118.
Azadbakht, M., Fraser, C.S., Khoshelham, K., 2016. Improved Urban Scene Classification Using Full-Waveform Lidar. Photogrammetric Engineering & Remote Sensing 82, 973-980.
Bayramoglu, N., Alatan, A.A., 2010. Shape index SIFT: Range image recognition using local features, Pattern Recognition (ICPR), 2010 20th International Conference on. IEEE, pp. 352-355.
Breiman, L., 2001. Random Forests. Machine Learning 45, 5-32.
Brenner, C., 2009. Extraction of features from mobile laser scanning data for future driver assistance systems, Advances in GIScience. Springer, pp. 25-42.
Bronstein, A., Bronstein, M., Ovsjanikov, M., 2010. 3D features, surface descriptors, and object descriptors. 3D Imaging, Analysis, and Applications.
Cabo, C., Ordoñez, C., García-Cortés, S., Martínez, J., 2014. An algorithm for automatic detection of pole-like street furniture objects from Mobile Laser Scanner point clouds. ISPRS Journal of Photogrammetry and Remote Sensing 87, 47-56.
Castellani, U., Cristani, M., Fantoni, S., Murino, V., 2008. Sparse points matching by combining 3D mesh saliency with statistical descriptors, Computer Graphics Forum. Wiley Online Library, pp. 643-652.
Csurka, G., Dance, C., Fan, L., Willamowski, J., Bray, C., 2004. Visual categorization with bags of keypoints, Workshop on statistical learning in computer vision, ECCV. Prague, pp. 1-2.
Fukano, K., Masuda, H., 2015. Detection and Classification of Pole-Like Objects from Mobile Mapping Data. ISPRS Annals of Photogrammetry, Remote Sensing and Spatial Information Sciences 2, 57-64.
Golovinskiy, A., Kim, V.G., Funkhouser, T., 2009. Shape-based recognition of 3D point clouds in urban environments, Computer Vision, 2009 IEEE 12th International Conference on, pp. 2154-2161.
Khoshelham, K., Oude Elberink, S., 2012. Role of dimensionality reduction in segment-based classification of damaged building roofs in airborne Laser scanning data, Proceedings of the 4th GEOBIA, Rio de Janeiro - Brazil, pp. 372-377.
Khoshelham, K., Oude Elberink, S.J., Xu, S., 2013. Segment-based classification of damaged building roofs in aerial laser scanning data. IEEE Geoscience and Remote Sensing Letters 10, 1258-1262.
Klecka, W.R., 1980. Discriminant analysis. Sage.
Lai, K., Fox, D., 2009. 3D laser scan classification using web data and domain adaptation, Robotics: Science and Systems.
Lam, J., Kusevic, K., Mrstik, P., Harrap, R., Greenspan, M., 2010. Urban scene extraction from mobile ground based lidar data, Proceedings of 3DPVT, pp. 1-8.
Landa, J., Ondroušek, V., 2016. Detection of Pole-like Objects from LIDAR Data. Procedia-Social and Behavioral Sciences 220, 226-235.
Lehtomäki, M., Jaakkola, A., Hyyppä, J., Kukko, A., Kaartinen, H., 2010a. Detection of vertical pole-like objects in a road environment using vehicle-based laser scanning data. Remote Sensing 2, 641-664.
Lehtomäki, M., Jaakkola, A., Hyyppä, J., Kukko, A., Kaartinen, H., 2010b. Detection of Vertical Pole-Like Objects in a Road Environment Using Vehicle-Based Laser Scanning Data. Remote Sensing 2, 641.
Li, D., Elberink, S.O., 2013. Optimizing detection of road furniture (pole-like objects) in mobile laser scanner data. ISPRS Ann. Photogramm. Remote Sens. Spat. Inf. Sci 1, 163-168.
MacQueen, J., 1967. Some methods for classification and analysis of multivariate observations, Proceedings of the fifth Berkeley symposium on mathematical statistics and probability. Oakland, CA, USA., pp. 281-297.
Masuda, H., Oguri, S., He, J., 2013. Shape reconstruction of poles and plates from vehicle-based laser scanning data, Informational Symposium on Mobile Mapping Technology.
Munoz, D., Vandapel, N., Hebert, M., 2008. Directional associative markov network for 3-d point cloud classification, Fourth International Symposium on 3D Data Processing, Visualization and Transmission.
Pu, S., Rutzinger, M., Vosselman, G., Oude Elberink, S., 2011. Recognizing basic structures from mobile laser scanning data for road inventory studies. ISPRS Journal of Photogrammetry and Remote Sensing 66, S28-S39.
Pu, S., Vosselman, G., 2009. Knowledge based reconstruction of building models from terrestrial laser scanning data. ISPRS Journal of Photogrammetry and Remote Sensing 64, 575-584.
Quinlan, J.R., 1986. Induction of decision trees. Machine learning 1, 81-106.
Rodríguez-Cuenca, B., García-Cortés, S., Ordóñez, C., Alonso, M., 2015. Automatic Detection and Classification of Pole-Like Objects in Urban Point Cloud Data Using an Anomaly Detection Algorithm. Remote Sensing 7, 12680-12703.
Rusu, R.B., Marton, Z.C., Blodow, N., Beetz, M., 2008. Learning informative point classes for the acquisition of object model maps, Control, Automation, Robotics and Vision, 2008. ICARCV 2008. 10th International Conference on, pp. 643-650.
Steinberg, D., 2009. CART: classification and regression trees. The top ten algorithms in data mining 9, 179.
Tangelder, J.W., Veltkamp, R.C., 2008. A survey of content based 3D shape retrieval methods. Multimedia tools and applications 39, 441-471.
Velizhev, A., Shapovalov, R., Schindler, K., 2012. Implicit shape models for object detection in 3D point clouds, International Society of Photogrammetry and Remote Sensing Congress, pp. 179-184.
Vosselman, G., Gorte, B.G., Sithole, G., Rabbani, T., 2004. Recognising structure in laser scanner point clouds. International archives of photogrammetry, remote sensing and spatial information sciences 46, 33-38.
Wahl, E., Hillenbrand, U., Hirzinger, G., 2003. Surflet-pair-relation histograms: a statistical 3D-shape representation for rapid classification, 3-D Digital Imaging and Modeling, 2003. 3DIM 2003. Proceedings. Fourth International Conference on, pp. 474-481.
Weinmann, M., Urban, S., Hinz, S., Jutzi, B., Mallet, C., 2015. Distinctive 2D and 3D features for automated large-scale scene analysis in urban areas. Computers & Graphics 49, 47-57.
Yang, B., Dong, Z., Zhao, G., Dai, W., 2015. Hierarchical extraction of urban objects from mobile laser scanning data. ISPRS Journal of Photogrammetry and Remote Sensing 99, 45-57.
Yokoyama, H., Date, H., Kanai, S., Takeda, H., 2011. Pole-like objects recognition from mobile laser scanning data using smoothing and principal component analysis, ISPRS Workshop, Laser scanning, pp. 115-121.
Yokoyama, H., Date, H., Kanai, S., Takeda, H., 2013. Detection and classification of pole-like objects from mobile laser scanning data of urban environments. International Journal of CAD/CAM 13, 1-10.