SECTION-BASED TREE SPECIES IDENTIFICATION USING AIRBORNE LIDAR POINT
CLOUD
YAO Chunjinga, ZHANG Xinyuea,∗, LIU Haibob
a
School of Remote Sensing and Information Engineering ,Wuhan University, China - [email protected]
b
State Power Economic Research Institute - [email protected]
KEY WORDS:LiDAR, Tree Detection, Species Identification, Section Based Method, Decision Tree Rule, Crown Parameter
ABSTRACT:
The application of LiDAR data in forestry initially focused on mapping forest community, particularly and primarily intended for large-scale forest management and planning. Then with the smaller footprint and higher sampling density LiDAR data available, detecting individual tree overstory, estimating crowns parameters and identifying tree species are demonstrated practicable. This paper proposes a section-based protocol of tree species identification taking palm tree as an example. Section-based method is to detect objects through certain profile among different direction, basically along X-axis or Y-axis. And this method improve the utilization of spatial informa-tion to generate accurate results. Firstly, separate the tree points from manmade-object points by decision-tree-based rules, and create Crown Height Mode (CHM) by subtracting the Digital Terrain Model (DTM) from the digital surface model (DSM). Then calculate and extract key points to locate individual trees, thus estimate specific tree parameters related to species information, such as crown height, crown radius, and cross point etc. Finally, with parameters we are able to identify certain tree species. Comparing to species information measured on ground, the portion correctly identified trees on all plots could reach up to 90.65%. The identification result in this research demonstrate the ability to distinguish palm tree using LiDAR point cloud. Furthermore, with more prior knowledge, section-based method enable the process to classify trees into different classes.
1. INTRODUCTION
The availability of LiDAR data has grown exponentially during the last decade (Alt, 1962), with the advancement of sensor tech-nology such as the increased sampling rate and accuracy, Li-DAR data is potentially beneficial to alter traditional detection in forestry into new development.
The application of LiDAR data in forestry initially focused on mapping forest community, and primarily intended for managing and monitoring large-scale forest such as timber volume (Nilsson, 1996, TopEye, 1997) and estimation of mean height at stand and plot level. Recently, as the smaller footprint and higher sampling density LiDAR data emerge, it was demonstrated to detect indi-vidual overstory in forests (Brandt berg, 1999, Hyypp, 1999), es-timate crowns parameters (Popescu and Zhao, 2008) and identify species (Brandtberg et al., 2003a, Holmgren and Persson, 2004, Moffiet et al., 2005). The new full waveform scanners that pro-vide a higher point density and additional information about the reflecting characteristics of trees, also proved feasible to detect individual trees in forests and classify tree species (Brandt berg, 1999, Hyypp, 1999). But the critical issues including the calibra-tion and the decomposicalibra-tion of full waveform data with a series of Gaussian functions (Reitberger et al., 2008) are usually diffi-cult parts of the whole work. And the data acquisition is usually costly. Thus, LiDAR data based on a single wavelength band and relatively low flying heights are generally used for individual tree species identification. Furthermore, recent studies have shown that individual tree or larger areas canopy height distributions, can be obtained from LiDAR data acquired under leaf-on (Moffi-et (Moffi-et al., 2005) or leaf-off conditions (Brandtberg (Moffi-et al., 2003a, Nsset, 2005).
Still there is great interest in automatic tree classification and
in-∗Corresponding author: [email protected]
dividual species identification in wilderness areas by detecting structural parameters such as crown size, crown base height and other synthetic geometry parameters. The purpose of this paper is to develop a standard procedure for tree species identification using LiDAR data.
The overall goal of the study to identify individual palm tree using airborne LiDAR data. More specific steps are as follows:
1. Rough Classification of LiDAR point cloud;
2. Remove buildings using the decision-tree-based rules in sec-tion profiles;
3. Locate trees in depth image and pinpoint individual tree us-ing section analysis;
4. Estimate specific parameters, such as crown height and crown radius;
5. Identify palm tree;
2. MATERIALS AND METHODS
2.1 Study Site
The study area Wuzhizhou island is located in southern Chi-na (N18◦18’51.07” , E109◦45’42.60”) as Figure 1 covering 1.48km2. Forest comprises more than 95% of the island while bare rocks and constructions mainly comprise the rest 5%.
Figure 1. Overview of the Wuzhizhou island
2.2 LiDAR Data
LiDAR data in the paper were acquired from an average of 1000mabove ground level (AGL) in a period between March 2014 and March 2015. The LiDAR system (Optech ALTM Aquarius) utilizes advanced technologies in airborne positioning and orientation, enables the collection of high-accuracy digital surface data and records four returns per laser pulse. The reported horizontal and vertical accuracies for the mission specifications of this project are 1525cmand 15cm, respectively.
For specific dataset, the LiDAR system provided a 30 degree swath from nadir, for a total scan angle of 60 degree. With a cross-hatch grid of flight lines, the average laser point density is 4 per square meter. The point density translates into an average distance between laser points of about 1m. The average swath width was 350m, with 4 flight lines in a northsouth direction.
2.3 Technical Design
With high quality LiDAR data available, the flow chart for pro-cessing described above in introduction is shown in Figure 2.
Figure 2. Work flow
3. EXPERIMENT
3.1 Crown Points Extraction
3.1.1 Preprocessing: Firstly, build a digital surface model (DSM) by interpolating lidar point elevations to a regular grid with a spatial resolution of 0.5m using the triangulated irreg-ular network (TIN) method. Lidar points used for creating the DSM included only the highest points in 0.5mby 0.5mcells so as to allow an accurate characterization of the top canopy sur-face. Then establish a raster Digital Terrain Model (DTM) used for the normalization of raw point heights to get absolute tree height from the raw point clouds and eliminate the interference from terrain and the buildings. The DTM is generated from the raw point clouds with TIN progressive adaptive filtering algo-rithm (P., 2012). Finally create a Crown Height Model (CHM) with a spatial resolution of 0.5mby subtracting the DTM from the DSM. The CHM represents a three dimensional surface that characterizes vegetation height across the landscape.
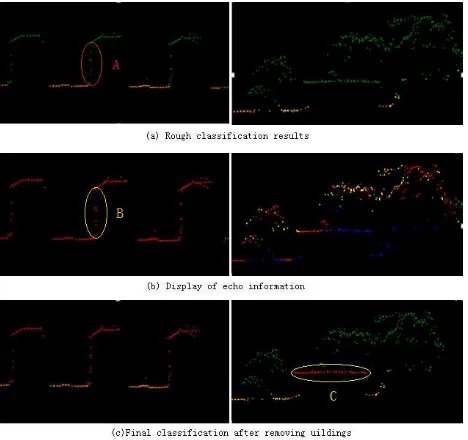
3.1.2 Removing Building Points: Based on the CHM, the point clouds can be roughly classified into ground points, build-ing points, short trees, medium height trees and tall trees. In order to extract the crown points, the echo information of point data is significant to identify the remaining artificial object points such as buildings from the profile of the current section. Besides, u-nique sign like blank signal under series horizonal points is also important. It is known that laser beams can penetrate tree branch-es in forbranch-est area and most LiDAR systems are capable of receiv-ing multi-echo-return points. Notice that the buildreceiv-ing points has only the first return and the last return signal(Charaniya et al., 2004). With sections profile method, the building points are ex-tracted using decision-tree-based method. Thus, the rest of the points are basically representing trees.
Figure 3. Different information of point classification As for figure (b), the only-first return points are red, the medium
return points are yellow, the last return points are blue.
points. As laser beams hit the walls of buildings, the echo points reflected by the walls are shown as the two perpendicular eclipses of A and B Figure 3 (a) and (b). It is known that laser beams can penetrate tree branches in forest and most LiDAR systems are capable of receiving multi-echo-return points. These returns can be classified into three groups as illustrated by the images in the second row shown in Figure 3(b).
Notice that building points are either the only-first return points or the last return points(Charaniya et al., 2004). An interesting phenomenon as highlighted by circle C is that the returns on the roof of building have the lowest height values, which indicating tree branches invaded the space atop of the buildings. However, in most cases, there should be no points over the roofs.
There are several buildings sparsely dotting the study site and can easily be mistaken as trees. From all above, the removal of building points from the high vegetation points starts with the de-termination of the section widthwwhich depends on the average distancedof the ground points classified from the original points. In order to exclude the building points completely, the sections of the whole study area are selected both along the X-axis and Y-axis. And the section number can be defined asNx andNy respectively. The parameters mentioned above can be calculated by formula (1), (2) and (3).
where w= the section width
d= the average distance of the ground points Nx= the section number along X direction Ny= the section number along Y direction Xmax= the maximum X value of the study site Xmin= the minimum X value of the study site Ymax= the maximum Y value of the study site Ymin= the minimum Y value of the study site
Take the jsection along the Y direction as an example. In a certain section, the Y value of each points can be regarded as a constant value. The building points are excluded using decision-tree-based method following the steps below:
1. Assume the total points in thejsection isN. Assort all the points by the X value of the ground points, and calculate the distance in X direction, ifdi,i+1> dthreshold, then theXi andXi+1is defined as the edge points. (see Figure 4)
di,i+1=Xi+1−Xi, Xi+1>Xi (4)
2. DivideXiandXjintonsub-segments. To detect the wall points of the buildings, let the edge pointsXi=Xi−d
2.n
is calculated as formula (5).
n=(di,i+1+ d
2)
d (5)
3. Take clusterCtreeinto processing. Attain all the tree points in the range of current sub-segmentS ofXiXi+1. Count
the number Ns of tree points and assort tree points by Z-ascending, then all theZtminandZtmaxof tree points in currentS should be calculated next. If the edge points are in the current sub-segment, the current sub-segment can be called as edge-sub-segment.
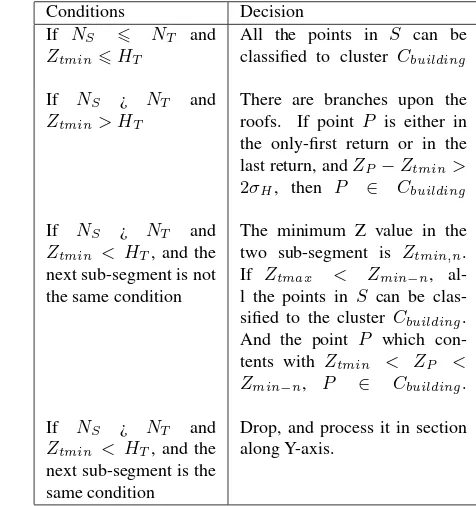
4. Finally the building points can be excluded by following rules shown in Table 1. By adding the parameters mentioned above, the normal roof points number threshold valuesNT, the elevation calibration standard deviationσHand the min-imum building heightHTare also concerned.
Conditions Decision
If NS 6 NT and Ztmin6HT
All the points in S can be classified to cluster Cbuilding
If NS ¿ NT and Ztmin> HT
There are branches upon the roofs. If point P is either in the only-first return or in the last return, andZP−Ztmin>
The minimum Z value in the two sub-segment is Ztmin,n. If Ztmax < Zmin−n, al-l the points in S can be clas-sified to the cluster Cbuilding. And the point P which con-tents with Ztmin < ZP <
Drop, and process it in section along Y-axis.
Table 1. The conditions to exclude the buildings in sub-segment
Figure 4. Section display
Picture shows the division of sub-segment in section, the original clusters of points and the related parameters
3.2 Tree Top Location
3.2.1 Generating Tree Point Grid: After removing all the building points, the ground pointsCgroundand tree pointsCtree are used to derive the tree locations. In the airborne LiDAR data, the tree points are mostly scattered on top of the tree crowns. As a result, the absolute CHM is calculated by subtracting the height value of DTM at each point from the height value of DSM. Thus, tree heights can be taken directly from the CHM.
The CHM maps are the rough surface of the canopy. Assume the highest point of a tree can be regarded as the location of the tree, then generate the grids of crown points first. The size of each cell is defined depending on the average ground point distanced. Put all the tree points to the grids according to the geographical range of the grid, and the value of each grid (GV) can be defined by following formula (6).
GV =
0, m= 0
ZCHM, m= 1
max(Zi
CHM), m >1, i= 1,2, . . . , m (6)
where GV = the height of grid cell m= tree point amount in current grid ZCHM= the height of tree points
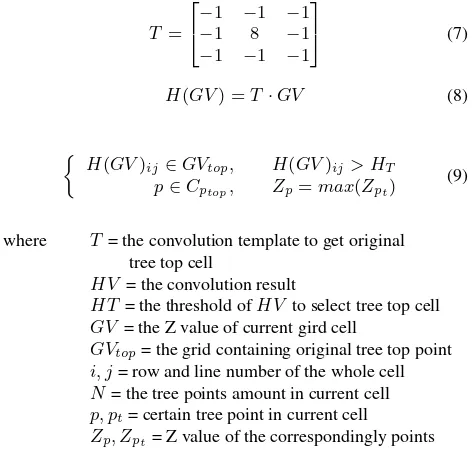
3.2.2 Initial Estimation of Tree Location: The cell contain-ing the tree top point should have the biggest value among all the eight neighboring cells. As a result, the template as defined by formula (7) and formula (8), will be used to derive the tree top gridsGVtop. After all theGVtop, theP which has the biggest high value can be seen as the original tree top pointPtop, and all thePtopcluster can be signed asCPtop, .
T=
−1 −1 −1 −1 8 −1 −1 −1 −1
(7)
H(GV) =T·GV (8)
H(GV)ij∈GVtop, H(GV)ij> HT p∈Cptop, Zp=max(Zpt)
(9)
where T= the convolution template to get original tree top cell
HV = the convolution result
HT= the threshold ofHV to select tree top cell GV = the Z value of current gird cell
GVtop= the grid containing original tree top point i, j= row and line number of the whole cell N= the tree points amount in current cell p, pt= certain tree point in current cell Zp, Zpt= Z value of the correspondingly points
3.2.3 Point segmentation of individual: In section above, the size of grid cell is small enough to identify all of the tree tops in small scale and therefore, there must some neighboring small tree tops belong to one large tree. As the assumption that the topmost tree points stands for the tree location, theCPtopwill be assorted descending by Z-values.
Every tree is approximately axisymmetric. Take the tree peak point as the center of the section rectangle in the top view. And as the complex location relationship between the trees shown in Figure 5, two more directional section profiles will be added to extract the topmost tree following similar process to building re-moval. In the forest area, most of the tree location relationships fall into the categories as (c)-(f) in Figure 5. In the area with hu-man activity, the trees will usually follow the condition (a) and (b) in Figure 5. It is worth noting that condition (d) and (e) are the most common and only in dense forest.
Figure 5. The location relationship between the trees
The tree points can be projected onto the profiles which are de-fined by the center of the section, like Figure 6 shows. The more directional sections we use the more accurate the results will be.
Figure 6. Top view of one tree with four different section profiles The red point stands for the location of the tree top, and different color refers to different directional section profiles respectively
The tree parameters can be extracted from four directional section profiles such asS1, S2, S3 andS4(see Figure 6). From figures
in profile, the complex location conditions of different tree lead to different decision parameter and method. In order to identify palm tree precisely, the parameters (see Figure 7) can be extracted by analyzing the four section profiles in the steps detailed below:
1. Assort all the tree top pointsCPtopdescending by Z-values, and the first pointP in the newCPtop will be defined as the highest tree in the study area. If it is not the first point to locate the tree, the kth point P is the highest in the remainedCPtoppoints.
formula (10). Compute all the section profiles of the curren-t curren-tree curren-top and gecurren-t all curren-the curren-tree edge poincurren-ts. Then curren-there will be nine points to describe the current tree including tree top point, can be describe as theT Rk, andkis the tree top ID in theCPtop.
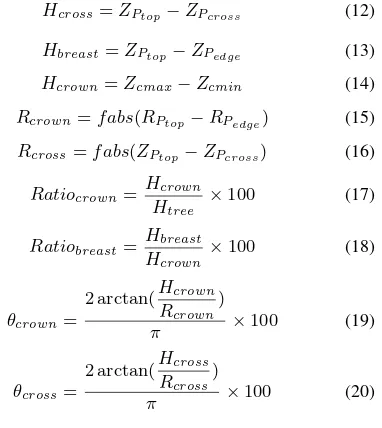
Figure 7. The parameters in tree section profile
where Pcross= the cross point of neighboring tree Pedge= the edge point of the tree
Htree= the height of the tree Hcrown= the height of the tree crown Hcross= the height fromPcrosstoPtop Rcrown= the radius of the crown Rcross= the radius fromPcross
The definition ofPcrossandPedge.
Pt−i=
Pt= tree top point in current section profile Pt−i= theithpoint on left side ofPt Zt−i= the Z value ofPt−i
3. Delete the fake tree tops around current tree point P by judging whether the remained tree top points are included in the new octagon which will define the original tree boundary.
4. After all the tree top points computed, the tree number can be derived simultaneously. Most of the tree points can be added to the corresponding original tree boundary. And some tree points in the gap between trees are still not added to any tree boundary. The nearest distance to the tree stem is used to classify the remaining tree points to their right trees, as the formula (11) shows.
Premain∈T rlef t, if dlef t6dright
Premain∈T rright, if dlef t>dright (11)
where Premain= one of the unclassified points T rlef t= tree points cluster at left segment T rright= tree points cluster at right segment dlef t= 3d distance ofPremaintoT rlef t dright= 3d distance ofPremaintoT rright
3.3 Identification of Palm Tree
Generate necessary parameters for cluster analysis method to i-dentify the palm tree species classify based on the key tree points and the segmented tree points. For each tree segments points, the extraction and definitions of the parameters are calculated by the following formula (12)-(20). In order to make the parameter-s more diparameter-stinctive, it iparameter-s neceparameter-sparameter-sary to parameter-stretch the parameter to the interval (0-100).
where Pi= any tree point in current tree segment Htree=ZPtop
Zcmax=ZPtop Zcmin=min(ZPi) ZPi= Z value of the pointPi
All of the cluster analysis methods for the traditional image anal-ysis is available for the tree species classification but not identifi-cation. With parameters above, we enable the traditional cluster analysis to identify tree species using parameters as prior knowl-edge. Notice,θcrownandθcrosscan not be used together, thus, the first classification/identification processing begins with the Pedge. If there is a Pedge in the tree segment, the parameter Ratiocrown, Ratiobreast andθcrown are used the most in ar-eas with human activities. For four sections profiles for each tree segment points, there will be eight sets of parameters. If there is more than oneθcrownorθcrossvalues, then the average values are taken.
4. RESULT
Using the approach presented above, parameters in sub-segment after excluding buildings from analysis are shown as table be-low. In the flat area where the trees are sparse, most of the palm trees can be identified by the parameters trained by the Maximum Likelihood method.
Ratiocrown Ratiobreast θcrown θcross
Min 42.18 56.92 54.85 45.33
Max 57.68 87.17 72.65 61.17
To examine the identification accuracy, the sample Area 1, Area 2 and Area 3 chose from the study area with different level of tree density are used. Area 1 is flat with sparsely located palm trees, Area 2 is tropical forest area and Area 3 in between Area 1 and Area 3. Palm trees data measured on the ground and the de-tected are shown as follows. Table 2 indicates that the total error identification percentage in the Area 1 is 2.44%, in the Area e is 9.52%. Surprisingly, the accuracy in Area 2 is 0, which clearly shows that the tree is much more difficult to detect in the natural tropical forest area because the high density make tree are fused closely. But for all of the conditions, the identification accuracy of palm tree specie is 91.51% while the total error identification percentage is 8.49%.
Area Measured Detected Error Accuracy
Area 1 41 40 1 97.56%
Area 2 2 0 2 0.00
Area 3 63 57 6 90.48%
Table 3. Accuracy assessment in different area
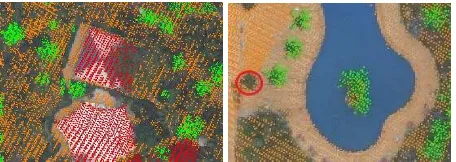
The identification result of partly study site in Area 3. Ground points are orange, building points are red and palm tree points are green. Points in red circle of the second figure are of one palm tree points being missed.
Figure 8. Identification Result
5. DISCUSSION
In this paper, the relative height from the ground is important to derive possible tree points. The height threshold is usually set around 1.0 2.0mdepending on the forest condition of study site. Given that more than 90% of the Wuzhizhou island is covered by forest, the threshold is set to 1.0m.
As the roofs and walls of the buildings affecting the tree points identification analysis, most of the buildings extraction approach-es only removapproach-es the points reprapproach-esenting the roofs while in our study, we have a further research on removing the wall points completely as well with the echo information in use.
For the purpose of deriving each individual tree location, the reso-lution of the Tree Points Grid is significant determining the num-ber of the palm trees we can detect. Two typical sample test area are selected to test the section based methodology. Area 1 is the area with human activities, and Area 2 is located in the hilly for-est. Considering that the point density is 4 per square meters, the average distance between points is 0.5m. In Area 1, the man-ual counted number of tree is 109, and in the Area 2, it is 73. The raster grid resolution is changed from 0.2mto 10mto attain the best resolution for the tree point grid, and the length of the tree point grid (see Figure 9). The original tree location detection method is very sensitive to the grid resolution, and decision-tree-based method can maintain the final tree location and numbers.
From the chart below, 0.4mof grid length is suitable to detext almost all the trees, and the method is more effective in the Area 1 where the trees are located relatively sparsely.
Figure 9. Relationship between detection amount and grid size
5.1 Conclusion
According to Table 3 above, we conclude that section profile based decision tree method benefits the separated located area (Area 1) where most of the palm trees can be detected and iden-tified, while palm trees in the forest area with high density (Area 2) of tree are much harder to be detected. As most of the trees of study area are in natural forest, and the location relationship between trees is very complex. Given that palm trees generally distribute scattered and under a few condition they are conjoin-t buconjoin-t sconjoin-till much more recognizable conjoin-than conjoin-the shrubs, Therefore, tree species identification is supposed to be applied combining the condition of their growth environment. In the condition like the Area 1, most of the tree crown segment always has aPedge, but in the Area 2, the tree crown segment rarely has aPedgeunless there is an obvious high tree among the shrubs, and the parameter-s parameter-such aparameter-sRatiocrown,Ratiobreastandθcrossare used frequent-ly instead ofRatiocrown, Ratiobreast andθcrown. Moreover, parameters are suggested to be generated and adopted based on practical conditions since the location relationship among trees is quite complex.
In order to get all the trees species class, ground-based LiDAR da-ta is needed to get more deda-tails under the top crowns, but it is still a challenging work because of the rocky terrain. Furthermore, the biomass and the law of tree distribution can be researched. Besides, neural network algorithm is a promising method to be applied if it trains with structural parameters.
In summary, LiDAR data can provide density precisely 3D point data sensitive to the changes of altitude, and it is quite useful to attain the profile data of all the objects on the ground. Geom-etry characteristics, frankly, the parameters calculated using the decision-tree-based method, are valuable to detect and identify the structure and classification of objects.
ACKNOWLEDGEMENTS
REFERENCES
Alt, F., 1962. Digital pattern recognition by moments.Journal of
the ACM9(2), pp. 240–258.
Brandt berg, T., 1999. Automatic individual tree-based analy-sis of high spatial resolution remotely sensed data. PhD theanaly-sis, Swedish University of Agricultural Sciences.
Brandtberg, T.and Warner, T., Landenberger, R. and McGraw, J., 2003a. Detection and analysis of individual leaf-off tree crown-s in crown-small footprint, high crown-sampling dencrown-sity lidar data from the eastern deciduous forest in north america.Remote Sensing of En-vironment85(3), pp. 290–303.
Charaniya, A., Manduchi, R. and Lodha, S., 2004. Supervised parametric classification of aerial lidar data. In: Proceedings of the IEEE 2004 Conference on Computer Vision and Pattern Recognition Workshop, Baltimore, Vol. 3, pp. 1–8.
Holmgren, J. and Persson, ., 2004. Identifying species of in-dividual trees using airborne laser scanner. Remote Sensing of
Environment90(4), pp. 415–423.
Hyypp, J.and Inkinen, M., 1999. Detecting and estimating at-tributes for single trees using laser scanner. Photogrammetric Journal of Finland16(2), pp. 27–42.
Moffiet, T.and Mengersen, K., Witte, C., King, R. and Denham, R., 2005. Airborne laser scanning: exploratory data analysis in-dicates potential variables for classification of individual trees or forest stands according to species.ISPRS Journal of
Photogram-metry and Remote Sensing59(5), pp. 289–309.
Nilsson, M., 1996. Estimation of tree heights and stand volume using an airborne lidar system. Remote Sensing of Environment
56(1), pp. 1–7.
Nsset, E., 2005. Assessing sensor effects and effects of leaf-off and leaf-on canopy conditions on biophysical stand properties de-rived from small-footprint airborne laser data.Remote Sensing of
Environment98(23), pp. 356–370.
P., A., 2012. Processing of laser scanner data-algorithms and ap-plications.ISPRS Journal of Photogrammetry and Remote Sens-ing54, pp. 138–147.
Popescu, S. C. and Zhao, K., 2008. A voxel-based lidar method for estimating crown base height for deciduous and pine trees.
Remote Sensing of Environment(112), pp. 767–781.
Reitberger, J., Krzystek, P. and Stilla, U., 2008. Analysis of full waveform lidar data for the classification of deciduous and conif-erous trees. International Journal of Remote Sensing29(5), p-p. 1407–1431.