Practical
Hive
A Guide to Hadoop’s Data Warehouse System
—
Scott Shaw
Andreas Francois Vermeulen
Ankur Gupta
Practical Hive
A Guide to Hadoop’s
Data Warehouse System
Scott Shaw
Andreas François Vermeulen
Ankur Gupta
David Kjerrumgaard
Scott Shaw Andreas François Vermeulen
Saint Louis, Missouri, USA West Kilbride North Ayrshire, United Kingdom
Ankur Gupta David Kjerrumgaard
Uxbridge, United Kingdom Henderson, Nevada, USA
ISBN-13 (pbk): 978-1-4842-0272-2 ISBN-13 (electronic): 978-1-4842-0271-5 DOI 10.1007/978-1-4842-0271-5
Library of Congress Control Number: 2016951940
Copyright © 2016 by Scott Shaw, Andreas François Vermeulen, Ankur Gupta, David Kjerrumgaard
This work is subject to copyright. All rights are reserved by the Publisher, whether the whole or part of the material is concerned, specifically the rights of translation, reprinting, reuse of illustrations, recitation, broadcasting, reproduction on microfilms or in any other physical way, and transmission or information storage and retrieval, electronic adaptation, computer software, or by similar or dissimilar methodology now known or hereafter developed. Exempted from this legal reservation are brief excerpts in connection with reviews or scholarly analysis or material supplied specifically for the purpose of being entered and executed on a computer system, for exclusive use by the purchaser of the work. Duplication of this publication or parts thereof is permitted only under the provisions of the Copyright Law of the Publisher’s location, in its current version, and permission for use must always be obtained from Springer. Permissions for use may be obtained through RightsLink at the Copyright Clearance Center. Violations are liable to prosecution under the respective Copyright Law.
Trademarked names, logos, and images may appear in this book. Rather than use a trademark symbol with every occurrence of a trademarked name, logo, or image we use the names, logos, and images only in an editorial fashion and to the benefit of the trademark owner, with no intention of infringement of the trademark.
The use in this publication of trade names, trademarks, service marks, and similar terms, even if they are not identified as such, is not to be taken as an expression of opinion as to whether or not they are subject to proprietary rights. While the advice and information in this book are believed to be true and accurate at the date of publication, neither the authors nor the editors nor the publisher can accept any legal responsibility for any errors or omissions that may be made. The publisher makes no warranty, express or implied, with respect to the material contained herein.
Managing Director: Welmoed Spahr Acquisitions Editor: Robert Hutchinson Developmental Editor: Matt Moodie
Technical Reviewer: Ancil McBarnett, Chris Hillman
Editorial Board: Steve Anglin, Pramila Balen, Laura Berendson, Aaron Black, Louise Corrigan, Jonathan Gennick, Robert Hutchinson, Celestin Suresh John, Nikhil Karkal, James Markham, Susan McDermott, Matthew Moodie, Natalie Pao, Gwenan Spearing
Coordinating Editor: Rita Fernando Copy Editor: Kezia Endsley Compositor: SPi Global Indexer: SPi Global
Cover Image: Designed by FreePik
Distributed to the book trade worldwide by Springer Science+Business Media New York, 233 Spring Street, 6th Floor, New York, NY 10013. Phone 1-800-SPRINGER, fax (201) 348-4505, e-mail [email protected] , or visit www.springer.com . Apress Media, LLC is a California LLC and the sole member (owner) is Springer Science + Business Media Finance Inc (SSBM Finance Inc). SSBM Finance Inc is a Delaware corporation. For information on translations, please e-mail [email protected] , or visit www.apress.com .
Apress and friends of ED books may be purchased in bulk for academic, corporate, or promotional use. eBook versions and licenses are also available for most titles. For more information, reference our Special Bulk Sales–eBook Licensing web page at www.apress.com/bulk-sales .
Any source code or other supplementary materials referenced by the author in this text is available to readers at www.apress.com . For detailed information about how to locate your book’s source code, go to
I dedicate this book to my family. Th
ey put up with me being on the computer everyday
and yet they have no idea what I do for a living. Love you!
—Scott Shaw
I dedicate this book to my family and wise mentors for their support. Special thanks
to Denise and Laurence.
—Andreas Franç ois Vermeulen
I would like to express my gratitude to the many people who saw me through this book.
Above all I want to thank my wife, Jasveen, and the rest of my family, who supported and
encouraged me in spite of all the time it took me away from them.
—Ankur Gupta
“By perseverance, study, and eternal desire, any man can become great.” —George S. Patton
v
Contents at a Glance
About the Authors ...xv
About the Technical Reviewers ...xvii
Acknowledgments ...xix
Introduction ...xxi
■
Chapter 1: Setting the Stage for Hive: Hadoop ... 1
■
Chapter 2: Introducing Hive ... 23
■
Chapter 3: Hive Architecture ... 37
■
Chapter 4: Hive Tables DDL ... 49
■
Chapter 5: Data Manipulation Language (DML) ... 77
■
Chapter 6: Loading Data into Hive ... 99
■
Chapter 7: Querying Semi-Structured Data ... 115
■
Chapter 8: Hive Analytics ... 133
■
Chapter 9: Performance Tuning: Hive ... 219
■
Chapter 10: Hive Security ... 233
■
Chapter 11: The Future of Hive ... 245
■
Appendix A: Building a Big Data Team ... 249
■
Appendix B: Hive Functions ... 253
vii
Contents
About the Authors ...xv
About the Technical Reviewers ...xvii
Acknowledgments ...xix
Introduction ...xxi
■
Chapter 1: Setting the Stage for Hive: Hadoop ... 1
An Elephant Is Born ... 2
Hadoop Mechanics ... 3
Data Redundancy ... 6
Traditional High Availability ... 6
Hadoop High Availability ... 8
Processing with MapReduce ... 11
Beyond MapReduce ... 16
YARN and the Modern Data Architecture ... 17
Hadoop and the Open Source Community ... 18
Where Are We Now ... 22
■
Chapter 2: Introducing Hive ... 23
Hadoop Distributions ... 24
Cluster Architecture ... 26
Hive Installation ... 29
Finding Your Way Around ... 31
viii
■
Chapter 3: Hive Architecture ... 37
Hive Components ... 37
HCatalog ... 38
Hiveserver2 ... 41
Client Tools ... 43
Execution Engine: Tez ... 46
■
Chapter 4: Hive Tables DDL ... 49
Schema-on-Read ... 49
Hive Data Model ... 50
Schemas/Databases ... 50
Why Use Multiple Schemas/Databases ... 50
Creating Databases ... 50
Altering Databases ... 51
Dropping Databases ... 51
List Databases ... 52
Data Types in Hive ... 52
Primitive Data Types ... 52
Choosing Data Types... 52
Complex Data Types ... 53
Tables ... 54
Creating Tables ... 55
Listing Tables ... 55
Internal/External Tables ... 56
Internal or Managed Tables ... 56
External/Internal Table Example ... 57
Table Properties ... 61
Generating a Create Table Command for Existing Tables ... 62
Partitioning and Bucketing ... 62
Partitioning Considerations ... 64
■ CONTENTS
ix
Bucketing Considerations ... 66
Altering Tables ... 68
ORC File Format ... 69
Altering Table Partitions ... 70
Modifying Columns ... 74
Dropping Tables/Partitions ... 74
Protecting Tables/Partitions ... 75
Other Create Table Command Options ... 75
■
Chapter 5: Data Manipulation Language (DML) ... 77
Loading Data into Tables ... 77
Loading Data Using Files Stored on the Hadoop Distributed File System ... 78
Loading Data Using Queries ... 80
Writing Data into the File System from Queries ... 83
Inserting Values Directly into Tables ... 85
Updating Data Directly in Tables ... 86
Deleting Data Directly in Tables ... 88
Creating a Table with the Same Structure ... 89
Joins ... 90
Using Equality Joins to Combine Tables ... 90
Using Outer Joins ... 91
Using Left Semi-Joins ... 94
Using Join with Single MapReduce ... 95
Using Largest Table Last ... 96
Transactions ... 97
What Is ACID and Why Use It? ... 97
Hive Confi guration ... 97
■
Chapter 6: Loading Data into Hive ... 99
Design Considerations Before Loading Data ... 99
Loading Data into HDFS... 100
Ambari Files View ... 100
x
HDFS NFS Gateway ... 102
Sqoop... 103
Apache Nifi ... 106
Accessing the Data in Hive ... 111
External Tables ... 111
Load Data Statement ... 112
Loading Incremental Changes in Hive ... 113
Hive Streaming ... 113
Summary ... 114
■
Chapter 7: Querying Semi-Structured Data ... 115
Clickstream Data ... 117
Ingesting Data ... 119
Creating a Schema ... 122
Loading Data ... 123
Querying the Data ... 123
Ingesting JSON Data ... 126
Querying JSON with a UDF ... 128
Accessing JSON Using a SerDe ... 129
■
Chapter 8: Hive Analytics ... 133
Building an Analytic Model ... 133
Getting Requirements Using Sun Models ... 133
Converting Sun Models to Star Schemas ... 138
Building the Data Warehouse ... 149
Assessing an Analytic Model ... 152
Assess the Sun Models... 152
Assess the Aggregations ... 155
Assess the Data Marts ... 155
Master Data Warehouse Management ... 156
Prerequisites... 157
■ CONTENTS
xi
Assess Database ... 160
Process Database ... 175
Transform Database ... 201
What Have You Mastered ... 209
Organize Database ... 209
Report Database ... 213
Example Reports ... 214
Advanced Analytics ... 216
What’s Next? ... 217
■
Chapter 9: Performance Tuning: Hive ... 219
Hive Performance Checklist ... 219
Execution Engines ... 220
MapReduce ... 220
Tez ... 220
Storage Formats ... 222
The Optimized Row Columnar (ORC) Format ... 222
The Parquet Format ... 224
Vectorized Query Execution ... 225
Query Execution Plan ... 226
Cost-Based Optimization ... 227
The Execution Plan ... 230
Performance Checklist Summary ... 232
■
Chapter 10: Hive Security ... 233
Data Security Aspects ... 233
Authentication ... 234
Authorization ... 234
Administration ... 234
Auditing ... 234
xii
Hadoop Security ... 235
Hive Security ... 235
Default Authorization Mode ... 235
Storage-Based Authorization Mode ... 236
SQL Standards-Based Authorization Mode ... 237
Managing Access through SQL ... 238
Hive Authorization Using Apache Ranger ... 239
Accessing the Ranger UI ... 240
Creating Ranger Policies ... 240
Auditing Using Apache Ranger ... 243
■
Chapter 11: The Future of Hive ... 245
LLAP (Live Long and Process) ... 245
Hive-on Spark ... 246
Hive: ACID and MERGE ... 246
Tunable Isolation Levels ... 246
ROLAP/Cube-Based Analytics ... 247
HiveServer2 Development ... 247
Multiple HiveServer2 Instances for Different Workloads ... 247
■
Appendix A: Building a Big Data Team ... 249
Minimum Team ... 249
Executive Team ... 249
Business Team ... 249
Technical Team ... 250
Expanded Team ... 250
Business Team ... 250
Technical Team ... 251
■ CONTENTS
xiii
■
Appendix B: Hive Functions ... 253
Built-In Functions ... 253
Mathematical Functions ... 253
Collection Functions ... 255
Type-Conversion Functions ... 255
Date Functions ... 256
Conditional Functions ... 257
String Functions ... 257
Miscellaneous Functions ... 260
Aggregate Functions ... 260
User-Defi ned Functions (UDFs) ... 262
xv
About the Authors
Scott Shaw has over 15 years of data management experience. He has worked as an Oracle and SQL Server DBA. He has worked as a consultant on Microsoft business intelligence projects utilizing Tabular and OLAP models and co-authored two T-SQL books by Apress. Scott also enjoys speaking across the country about distributed computing, Big Data concepts, business intelligence, Hive, and the value of Hadoop. Scott works as a Senior Solutions Engineer for Hortonworks and lives in Saint Louis with his wife and two kids.
Andreas François Vermeulen is Consulting Manager of Business Intelligence, Big Data, Data Science, and Computational Analytics at Sopra-Steria, doctoral researcher at University of Dundee and St. Andrews on future concepts in massive distributed computing, mechatronics, Big Data, business intelligence, and deep learning. He owns and incubates the “Rapid Information Factory” data processing framework. He is active in developing next-generation processing frameworks and mechatronics engineering with over 35 years of international experience in data processing, software development, and system architecture. Andre is a data scientist, doctoral trainer, corporate consultant, principal systems architect, and speaker/author/columnist on data science, distributed computing, Big Data, business intelligence, and deep learning. Andre received his Bachelor’s degree at the North West University at Potchefstroom, his Master of Business Administration at the University of Manchester, Master of Business Intelligence and Data Science at University of Dundee, and Doctor of Philosophy at the University of Dundee and St. Andrews.
xvi
Ankur Gupta is a Senior Solutions Engineer at Hortonworks. He has over 14 years of experience in data management, working as a Data Architect and Oracle DBA. Before joining the world of Big Data, he worked as an Oracle Consultant for Investment Banks in the UK. He is a regular speaker on Big Data concepts, Hive, Hadoop, Oracle in various events, and is an author of the Oracle Goldengate 11g Complete Cookbook . Ankur has a Master’s degree in Computer Science and International Business. He is a Hadoop Certified Administrator and Oracle Certified Professional and lives in London with his wife.
David Kjerrumgaard is a systems architect at Hortonworks. He has 20 years of experience in software development and is a Certified Developer for Apache Hadoop (CCDH). Kjerrumgaard is the author of Data Governance with Apache Falcon and Cloudera Developer Training for Apache Hadoop . He received his bachelor’s and master’s degrees in Computer Science from Kent State University.
xvii
About the Technical Reviewers
Ancil McBarnett has been in the IT industry for over 20 years, where he initially began his “small data” career as an Oracle consultant and DBA in the Caribbean and Latin America. Ancil possesses an MBA with emphasis in Finance and a BSc. in Computer Science/Management.
Prior to working at Hortonworks he was the Architect Manager for a state agency responsible for sharing secure and sensitive data among first responder and justice systems and at Oracle, and was championing several Big Data and next generation Data Integration initiatives in a pre-sales capacity.
Since joining Hortonworks he has worked mainly with health providers who are looking to utilize Hadoop as the ideal platform to store and analyze secure data and to create modern data applications, with Hive as a pivotal tool to accomplish this.
You can find some of his articles on Hive and Tez tuning on the Hortonworks Community Connection.
Chris Hillman is Principal Data Scientist in the International Advanced Analytics team at Teradata. He has 20+ years of experience working in the business intelligence industry, mainly in the Retail and CPGN vertical, working as Solution Architect, Principal Consultant, and Technology Director. Chris works with the Teradata Aster Centre of Expertise and is involved in the pre-sale and start-up activities of Teradata Aster projects, helping customers understand whether MapReduce or SQL is an
appropriate technique to use. Chris is currently studying part-time for a PhD in Data Science at the University of Dundee, applying Big Data analytics to the data produced from experimentation into the Human Proteome.
xix
Acknowledgments
Even before I joined Hortonworks I wanted to write a book on Hive. At the time there weren’t many and the ones I saw where technically sound but not for the average users and especially not for someone coming from the relational database world. Once I began working at Hortonworks I figured it would be easy to sit down and write the book. I had all the best resources at my fingertips and access to some of the brightest people I’ve ever met. I had Hive committers like Alan Gates who never hesitated to answer an e-mail or spend a moment to talk to you at a conference. I had the friendship and support of the best Solution Engineering team in the world. Yet almost 2 and a half years later, there was still no book.
What I didn’t predict was the incredible pace of this market and the herculean time commitment all of us on the team endure to provide solutions to our customers. It is truly a labor of love, but between work and family, the book had to wait. It waited a long time. I think any other publisher would have kicked me out the door and looked elsewhere, but Apress held steady (although I cannot honestly say they didn’t push back a little and deservedly so) and trusted that someday we would have a book.
The struggle with writing a book on Hive is if you wait six months between writing then you’re writing a new book. I came to terms that this was not the job of one person and I needed help. Ankur was one of the first to step up. If not for Ankur’s perseverance and commitment, this book would not be in your hands right now. It was also Ankur who put us in touch with Andre and, I’m certain Ankur would agree, without Andre’s incredible writing output and knowledge, you would also not have a book in your hands or, at the very least, it would be smaller and you would be much less informed. Finally, thank you to David, who has truly provided the technical exclamation point on the book and was vital to rounding out the edges and moving us forward.
There are countless other people who have helped in any way they could with little time they had. Cindy Gross from the Microsoft CAT team was an early participant and helped to keep the project moving forward. Thank you to Ancil for stepping up and helping with much needed technical reviews—especially on my chapters. But most especially thank you to Hortonworks for not only supporting the book but being downright excited about it. The greater Hortonworks team wasn’t excited about the book just because it is a Hive book; they were excited for us, the team of authors, for our accomplishment. I never was forced to choose between my work and the book; it was my choice to focus on work.
Finally, thank you to my family. My kids may never have a need for Hive but I know they think it’s pretty cool that dad help write a book. It’s been a long journey from the days I was an English major to now being a Solutions Engineer for an open source Big Data company writing technical books, but I really do still look around me and count my blessings. I’ll say it again I work with some of the brightest people in the industry and although I can’t hold a candle to their intelligence, I do know their collective knowledge and insight makes me a better person.
xxi
Introduction
When I first learned about Hive I was working as a consultant on two data warehousing projects. One of them was in its sixth month of development. We had a team of 12 consultants and we were showing little progress. The source database was relational but, for some unknown reason, all the constraints such as primary and foreign key references had been turned off. For all intents and purposes, the source was non-relational and the team was struggling with moving the data into our highly structured data warehouse. We struggled with NULL values and building constraints as well as master data management issues and data quality. The goal at the end of the project was to have a data warehouse that would reproduce reports they already had.
The second project was smaller but involved hierarchical relationships. For example, a TV has a brand name, a SKU, a product code, and any number of other descriptive features. Some of these features are dynamic while others apply to one or more different products or brands. The hierarchy of features would be different from one brand to another. Again we were struggling with representing this business requirement in a relational data warehouse.
The first project represented the difficulty in moving from one schema to another. This problem had to be solved before anyone could ask any questions and, even then the questions had to be known ahead of time. The second project showed the difficulty in expressing business rules that did not fit into a rigid data structure. We found ourselves telling the customer to change their business rules to fit the structure.
When I first copied a file into HDFS and created a Hive table on top of the file, I was blown away by the simplicity of the solution yet by the far-reaching impact it would have on data analytics. Since that first simple beginning, I have seen data projects using Hive go from design to real analytic value built in weeks, which would take months with traditional approaches. Hive and the greater Hadoop ecosystem is truly a game-changer for data driven companies and for companies who need answers to critical business questions.
Setting the Stage for Hive: Hadoop
By now, any technical specialist with even a sliver of curiosity has heard the term Hadoop tossed around at the water cooler. The discussion likely ranges from, “Hadoop is a waste-of-time,” to “This is big. This will solve all our current problems.” You may also have heard your company director, manager, or even CIO ask the team to begin implementing this new Big Data thing and to somehow identify a problem it is meant to solve. One of the first responses I usually get from non-technical folks when mentioning Big Data is, “Oh, you mean like the NSA”? It is true that with Big Data comes big responsibility, but clearly, a lack of knowledge about the uses and benefits of Big Data can breed unnecessary FUD (fear, uncertainty, and doubt).
The fact you have this book in your hands shows you are interested in Hadoop. You may also know already how Hadoop allows you to store and process large quantities of data. We are guessing that you also realize that Hive is a powerful tool that allows familiar access to the data through SQL. As you may glean from its title, this book is about Apache Hive and how Hive is essential in gaining access to large data stores. With that in mind, it helps to understand why we are here. Why do we need Hive when we already have tools like T-SQL, PL/SQL, and any number of other analytical tools capable of retrieving data? Aren’t there additional resource costs to adding more tools that demand new skills to an existing environment? The fact of the matter is, the nature of what we consider usable data is changing, and changing rapidly. This fast-paced change is forcing our hand and making us expand our toolsets beyond those we have relied on for the past 30 years. Ultimately, as we’ll see in later chapters, we do need to change, but we also need to leverage the effort and skills we have already acquired.
Synonymous with Hadoop is the term Big Data . In our opinion, the term Big Data is slowly moving toward the fate of other terms like Decision Support System (DSS) or e-commerce. When people mention “Big Data” as a solution, they are usually viewing the problem from a marketing perspective, not from a tools or capability perspective. I recalled a meeting with a high-level executive who insisted we not use the term Big Data at all in our discussions. I agreed with him because I felt such a term dilutes the conversation by focusing on generic terminology instead of the truly transformative nature of the technology. But then again, the data really is getting big, and we have to start somewhere.
My point is that Hadoop, as we’ll see, is a technology originally created to solve specific problems. It is evolving, faster than fruit flies in a jar, into a core technology that is changing the way companies think about their data—how they make use of and gain important insight into all of it—to solve specific business needs and gain a competitive advantage. Existing models and methodologies of handling data are being challenged. As it evolves and grows in acceptance, Hadoop is changing from a niche solution to something from which every enterprise can extract value. Think of it in the way other, now everyday technologies were created from specialized needs, such as those found in the military. Items we take for granted like duct tape and GPS were each developed first for specific military needs. Why did this happen? Innovation requires at least three ingredients: an immediate need, an identifiable problem, and money. The military is a huge,
CHAPTER 1 ■ SETTING THE STAGE FOR HIVE: HADOOP
2
complex organization that has the talent, the money, the resources, and the need to invent these everyday items. Obviously, products the military invents for its own use are not often the same as those that end up in your retail store. The products get modified, generalized, and refined for everyday use. As we dig deeper into Hadoop, watch for the same process of these unique and tightly focused inventions evolving to meet the broader needs of the enterprise.
If Hadoop and Big Data are anything, they are a journey. Few companies come out of the gate requesting a 1,000-node cluster and decide over happy hour to run critical processes on the platform. Enterprises go through a predictable journey that can take anywhere from months to years. As you read through this book, the expectation is that it will help begin your journey and help elucidate particular steps in the overall journey. This first chapter is an introduction into why this Hadoop world is different and where it all started. This first chapter gives you a foundation for the later discussions. You will understand the platform before the individual technology and you will also learn about why the open source model is so different and disruptive.
An Elephant Is Born
In 2003 Google published an inconspicuous paper titled “The Google Filesystem” ( http://static. googleusercontent.com/media/research.google.com/en/us/archive/gfs-sosp2003.pdf ). Not many outside of Silicon Valley paid much attention to its publication or the message it was trying to convey. The message it told was directly applicable to a company like Google, whose primary business focused on indexing the Internet, which was not a common use case for most companies. The paper described a storage framework uniquely designed to handling the current future technological demands Google envisioned for its business. In the spirit of TL&DR, here are its most salient points:
• Failures are the norm
• Files are large
• Files are changed by appending, not by updating
• Closely coupled application and filesystem APIs
If you were a planning to become a multi-billion dollar Internet search company, many of these assumptions made sense. You would be primarily concerned with handling large files and executing long sequential reads and writes at the cost of low latency. You would also be interested in distributing your gigantic storage requirements across commodity hardware instead of building a vertical tower of expensive resources. Data ingestion was of primary concern and structuring (schematizing) this data on write would only delay the process. You also had at your disposal a team of world-class developers to architect the scalable, distributed, and highly available solution.
One company who took notice was Yahoo. They were experiencing similar scalability problems along Internet searching and were using an application called Nutch created by Doug Cutting and Mike Caffarella. The whitepaper provided Doug and Mike a framework for solving many problems inherent in the Nutch architecture, most importantly scalability and reliability. What needed to be accomplished next was a re-engineering of the solution based on the whitepaper designs.
3
When we think of Hadoop, we usually think of the storage portion that Google encapsulated in the GFS whitepaper. In fact, the other half of the equation and, arguably more important, was a paper Google published in 2004 titled “MapReduce: Simplified Data Processing on Large Clusters” ( http://static. googleusercontent.com/media/research.google.com/en/us/archive/mapreduce-osdi04.pdf ). The MapReduce paper married the storage of data on a large, distributed cluster with the processing of that same data in what is called an “embarrassingly parallel” method.
■
Note
We’ll discuss MapReduce (MR) throughout this book. MR plays both a significant role as well as an
increasingly diminishing role in interactive SQL query processing.
Doug Cutting, as well as others at Yahoo, saw the value of GFS and MapReduce for their own use cases at Yahoo and so spun off a separate project from Nutch. Doug named the project after the name of his son’s stuffed elephant, Hadoop. Despite the cute name, the project was serious business and Yahoo set to scale it out to handle the demands of its search engine as well as its advertising.
■
Note
There is an ongoing joke in the Hadoop community that when you leave product naming to
engineering and not marketing you get names like Hadoop, Pig, Hive, Storm, Zookeeper, and Kafka. I, for one,
love the nuisance and silliness of what is at heart applications solving complex and real-world problems. As far
as the fate of Hadoop the elephant, Doug still carries him around to speaking events.
Yahoo’s internal Hadoop growth is atypical in size but typical of the pattern of many current
implementations. In the case of Yahoo, the initial development was able to scale to only a few nodes but after a few years they were able to scale to hundreds. As clusters grow and scale and begin ingesting more and more corporate data, silos within the organization begin to break down and users begin seeing more value in the data. As these silos break down across functional areas, more data moves into the cluster. What begins with hopeful purpose soon becomes the heart and soul or, more appropriately, the storage and analytical engine of an entire organization. As one author mentions:
By the time Yahoo spun out Hortonworks into a separate, Hadoop-focused software
company in 2011, Yahoo’s Hadoop infrastructure consisted of 42,000 nodes and hundreds
of petabytes of storage (
http://gigaom.com/2013/03/04/the-history-of-hadoop-from-4-nodes-to-the-future-of-data/
).
Hadoop Mechanics
Hadoop is a general term for two components: storage and processing. The storage component is the Hadoop Distributed File System (HDFS) and the processing is MapReduce.
CHAPTER 1 ■ SETTING THE STAGE FOR HIVE: HADOOP
4
When we consider normal filesystems we think of operating systems like Windows or Linux. Those operating systems are installed on a single computer running essential applications. Now what would happen if we took 50 computers and networked them together? We still have 50 different operating systems and this doesn’t do us much good if we want to run a single application that uses the compute power and resources of all of them.
For example, I am typing this on Microsoft Word, which can only be installed and run on a single operating system and a single computer. If I want to increase the operational performance of my Word application I have no choice but to add CPU and RAM to my computer. The problem is I am limited to the amount of RAM and CPU I can add. I would quickly hit a physical limitation for a single device.
HDFS, on the other hand, does something unique. You take 50 computers and install an OS on each of them. After networking them together you install HDFS on all them and declare one of the computers a master node and all the other computers worker nodes. This makes up your HDFS cluster. Now when you copy files to a directory, HDFS automatically stores parts of your file on multiple nodes in the cluster. HDFS becomes a virtual filesystem on top of the Linux filesystem. HDFS abstracts away the fact you’re storing data on multiple nodes in a cluster. Figure 1-1 shows a high level view of how HDFS abstracts multiple systems away from the client.
Figure 1-1 is simplistic to say the least (we will elaborate on this in the section titled “Hadoop High Availability”). The salient point to take away is the ability to grow is now horizontal instead of vertical. Instead of adding CPU or RAM to a single device, you simply need to add a device, i.e., a node. Linear scalability allows you to quickly expand your capabilities based on your expanding resource needs. The perceptive reader will quickly counter that similar advantages are gained through virtualization. Let’s take a look at the same figure through virtual goggles. Figure 1-2 shows this virtual architecture.
5
Administrators install virtual management software on a server or, in most cases, a cluster of servers. The software pools resources such as CPU and memory so that it looks as if there is a single server with a large amount of resources. On top of the virtual OS layer we had guests and divide the available pool of resources to each guest. The benefits include maximization of IO resources, dynamic provisioning of resources, and high availability at the physical cluster layer. Some problems include a dependency on SAN storage, inability to scale horizontally, as well as limitations to vertical scaling and reliance on multiple OS installations. Most current data centers follow this pattern and virtualization has been the primary IT trend for the past decade.
■
Note
Figure
1-2
uses the term ESX. We certainly don’t intend to pick on VMWare. We show the
virtualization architecture only to demonstrate how Hadoop fundamentally changes the data center paradigm
for unique modern data needs. Private cloud virtualization is a still a viable technology for many use cases and
should be considered in conjunction with other architectures like appliances or public cloud.
Figure 1-2. Virtualization architecture
CHAPTER 1 ■ SETTING THE STAGE FOR HIVE: HADOOP
6
Data Redundancy
Data at scale must also be highly available. Hadoop stores data efficiently and cheaply. There are mechanisms built into the Hadoop software architecture that allow us to use inexpensive hardware. As stated in the GFS whitepaper, the original design assumed nodes would fail. As clusters expand horizontally into the 100s, 1,000s, or even 10s of thousands, we are left with no option but to assume at least a few servers in the cluster will fail at any given time.
To have a few server failures jeopardize the health and integrity of the entire cluster would defeat any other benefits provided by HDFS, not to mention the Hadoop administrator turnover rate due to lack of sleep. Google and Yahoo engineers faced the daunting task of reducing cost while increasing uptime. The current HA solutions available were not capable of scaling out to their needs without burying the companies in hardware, software, and maintenance costs. Something had to change in order to meet their demands. Hadoop became the answer but first we need to look at why existing tools were not the solution.
Traditional High Availability
When we normally think of redundancy, we think in terms of high availability (HA). HA is an architecture describing how often you have access to your environment. We normally measure HA in terms of nines. We might say our uptime is 99.999, or five nines. Table 1-1 shows the actual downtime expected based on the HA percentage ( http://en.wikipedia.org/wiki/High_availability ).
Cost is traditionally a ratio of uptime. More uptime means higher cost. The majority of HA solutions center on hardware though a few solutions are also software dependent. Most involve the concept of a set of passive systems sitting in wait to be utilized if the primary system fails. Most cluster infrastructures fit this model. You may have a primary node and any number of secondary nodes containing replicated application binaries as well as the cluster specific software. Once the primary node fails, a secondary node takes over. Table 1-1. HA Percentage Summary
Availability Percent
Downtime Per Year
Downtime Per Month
Downtime Per Week
90% (“one nine”) 36.5 days 72 hours 16.8 hours
95% 18.25 days 36 hours 8.4 hours
97% 10.96 days 21.6 hours 5.04 hours
98% 7.30 days 14.4 hours 3.36 hours
99% (“two nines”) 3.65 days 7.20 hours 1.68 hours
99.5% 1.83 days 3.60 hours 50.4 minutes
99.8% 17.52 hours 86.23 minutes 20.16 minutes
99.9% (“three nines”) 8.76 hours 43.8 minutes 10.1 minutes
99.95% 4.38 hours 21.56 minutes 5.04 minutes
99.99% (“four nines”) 52.56 minutes 4.32 minutes 1.01 minutes
99.995% 26.28 minutes 2.16 minutes 30.24 seconds
99.999% (“five nines”) 5.26 minutes 25.9 seconds 6.05 seconds
99.9999% (“six nines”) 31.5 seconds 2.59 seconds 0.605 seconds
7
■
Note
You can optionally set up an active/active cluster in which both systems are used. Your cost is still
high since you need to account for, from a resource perspective, the chance of the applications from both
systems running on one server in the event of a failure.
Quick failover minimizes downtime and, if the application running is cluster-aware and can account for the drop in session, the end user may never realize the system has failed. Virtualization uses this model. The physical hosts are generally a cluster of three or more systems in which one system remains passive in order to take over in the event an active system fails. The virtual guests can move across systems without the client even realizing the OS has moved to a different server. This model can also help with maintenance such as applying updates, patches, or swapping out hardware. Administrators perform maintenance on the secondary system and then make the secondary the primary for maintenance on the original system. Private clouds use a similar framework and, in most cases, have an idle server in the cluster primarily used for replacing a failed cluster node. Figure 1-3 shows a typical cluster configuration.
The cost for such a model can be high. Clusters require shared storage architecture, usually served by a SAN infrastructure. SANs can store a tremendous amount of data but they are expensive to build and maintain. SANs exist separate from the servers so data transmits across network interfaces. Furthermore, SANs intermix random IO with sequential IO, which means all IO becomes random. Finally, administrators configure most clusters to be active/passive. The passive standby server remains unused until a failure event. In this scenario hardware costs double without doubling your available resources.
Storage vendors use a number of means to maintain storage HA or storage redundancy. The most common is the use of RAID (Redundant Array of Independent Disks) configurations. Table 1-2 shows a quick overview of the most common RAID configurations.
Figure 1-3. Two-node cluster configuration with shared storage
Table 1-2. The Most Common RAID Levels
RAID Level
Description
Fault Tolerance
RAID 0 Stripe array None
RAID 1 Mirror array One disk
RAID 5 Stripe with parity One disk
CHAPTER 1 ■ SETTING THE STAGE FOR HIVE: HADOOP
8
RAID is popular due to the fact it provides data protection as well as performance enhancements for most workloads. RAID 0 for example supplies no data protection but speeds up write speed due to the increased amount of spindles. RAID, like clusters, come at a cost. In the case of mirrored RAID configuration you are setting aside a dedicated disk solely for the purpose of data recovery. Systems use the secondary disk only to replicate the data on write. This process slows down writes as well as doubling cost without doubling your storage capacity. To implement 5 TB of mirrored disk RAID, you would need to purchase 10 TB of storage. Most enterprises and hardware vendors do not implement RAID 0 or RAID 1 in server architectures.
Storage vendors such as EMC and NetApp configure their SAN environments with RAID 1+0 (RAID “ten”). This supplies the high-availability storage requirements as well as the performance capabilities. This works well for large SAN environments where arrays may consist of six or more drives and there may be dozens of arrays on the SAN. These arrays are carved up into LUNs (logical unit numbers) and presented to servers for use. These then become your mount points or your standard Windows drive letters.
■
Note
Bear with me. The discussion around SANs and RAID storage may seem mundane and unimportant
but understanding traditional storage design will help you understand the Hadoop storage structure. The use
of SANs and RAID has been the de facto standard for the last 20 years and removing this prejudice is a major
obstacle when provisioning Hadoop in data centers.
So, in essence SANs are large containers holding multiple disk arrays and managed by a central console. A company purchases a server, and then the server is provisioned in the data center with minimal storage (usually on a small DAS (direct attached storage) disk for the OS and connected via network links to the SAN infrastructure. Applications, whether point of sale applications or databases, request data from the SAN, which then pulls through the network for processing on the server. SANs become a monolithic storage infrastructure handing out data with little to no regard to the overarching IO processing. The added HA, licensing, and management components on SANs add significantly to the per-TB cost.
A lot of enhancements have been made in SAN technologies, such as faster network interconnects and memory cache, but despite all the advances the primary purpose of a SAN was never high performance. The cost per TB has dramatically dropped in the last 15 years and will continue to drop, but going out and buying a TB thumb drive is much different than purchasing a TB of SAN storage. Again, as with the virtualization example, SAN has real-world uses and is the foundation for most large enterprises. The point here is that companies need a faster, less expensive means to store and process data at scale while still maintaining stringent HA requirements.
Hadoop High Availability
Hadoop provides an alternative framework to the traditional HA clusters or SAN-based architecture. It does this by first assuming failure and then building the mechanisms to account for failure into the source code. As a product Hadoop is highly available out of the box. An administrator does not have to install additional software or configure additional hardware components to make Hadoop highly available. An administrator can configure Hadoop to be more or less available, but high availability is the default. More importantly, Hadoop removes the cost to HA ratio. Hadoop is open source and HA is part of the code so, through the transitive property, there is no additional cost for implementing Hadoop as an HA solution.
9
Based on the configuration settings, these blocks can range between 128 MB and 256 MB!
■
Note
These are exceptionally large block sizes for a filesystem. As a reference point, the largest Windows
block size, i.e. the largest size that can be read from disk into memory, is 4K. This is also the standard for most
Linux-based OSs.
Large block sizes influence much of Hadoop’s architecture. Large blocks sizes are core to how Hadoop is deployed, managed, and provisioned. Take into consideration the following factors influenced by large block sizes:
• Large files are more efficiently processed than smaller files
• There are fewer memory requirements on the master server (this will be discussed in
the next section)
• Leads to more efficient sequential read and writes
• The seek rate is reduced as a percentage of transfer time
CHAPTER 1 ■ SETTING THE STAGE FOR HIVE: HADOOP
10
spent by the aperture arm looking for data, this is called the seek rate. The two primary disk bottlenecks, and standard disks will always be the primary bottleneck, are seek rate and transfer time. The transfer time is the time it takes for the data to be moved from the disk into system memory. When compared to transfer time, seek rate is much slower. Hadoop reduces seek rate as a percentage of transfer time.
Storing large blocks may seem inefficient or restrictive on the surface, but Hadoop also has the concept of data locality to make the redundancy more useful. As mentioned earlier, Hadoop consists of a master node and worker nodes. We refer to the master node as the NameNode (NN) and we refer to the worker nodes as DataNodes (DN). The NameNode performs the following functions:
• Tracks which blocks in the cluster belong to which file
• Maintains where in the cluster each block is located
• Determines where to place blocks based on node location
• Tracks overall health of cluster through block reports
The NameNode not only breaks the file into blocks but it tracks where those blocks are placed in the cluster. Hadoop knows all the available DataNodes and on which rack the DataNodes are located. Knowing what rack nodes are on is called “rack awareness”. Figure 1-5 takes the previous figure and expands it to include rack awareness.
11
Here are the steps Hadoop uses to write files:
1. A block is written to node 1 in rack 1
2. A copy of the block is written to node 2 in rack 2
3. A copy is written to node 3 in rack 2
Even if there were more than two racks, the third block would still be written to the same rack as the second block. The order by which the blocks are written maximizes availability while reducing network traffic. By writing the second block to rack 2, HDFS immediately allows for the failure of an entire rack without affecting file recovery. The final write is to reduce network traffic because IO is much faster between nodes within a rack than between nodes in different racks. Files are large in HDFS so Hadoop has a number of different mechanisms to reduce network traffic. We will see more of this concept when we talk about processing.
Keep in mind that neither blocks nor files are stored on the NameNode. Data is only stored on the DataNodes. A client contacts the NameNode to determine where to write the blocks or where the blocks are located for read, after which the client talks directly to the DataNode. The NameNode stores the block information in memory. This is why large block sizes are important. The more blocks to track, the more memory the NameNode needs to store the information.
Only the NameNode knows where all blocks are located and to which file the blocks belong. If you lose a NameNode, you lose your cluster. This used to be a SPOF (single point of failure) factor for Hadoop, but now a NameNode can be effectively clustered for HA as you would with any other critical system. When building out your NameNode, you want to make sure the system has enough memory to handle the anticipated amount of blocks as well as having redundant hardware. DataNodes, on the other hand, do not need the additional hardware redundancy due to Hadoop’s built-in redundancy. You will still want your DataNodes to have enough storage, memory, and CPU to hold and process the data.
Processing with MapReduce
Storage is only part of the equation. Data is practically useless if we cannot process or analyze the data. Enterprises would be slow to adopt if they felt they were unable to derive insight from their mounds of stored data. We also do not want node failures negatively affecting our processing. Again, if we begin a job process on the cluster it would be unacceptable to have to restart the entire job five hours into processing simply because a single node became unavailable.
The first critical point to understand when discussing Hadoop processing is that Hadoop is a Java environment. Engineers who wrote Hadoop used the Java programming language. Hadoop processing, MapReduce, is also written in Java. In the early days of Hadoop, in order to do anything you had to have strong Java development skills. Luckily, for most of us, this is no longer the case. It can still be helpful to know and understand Java and how Java works both for writing MapReduce (MR) code as well as troubleshooting Hadoop, but as a business analyst or end user, you can now perform complex processing and analysis without ever having to touch Java code. As we will discuss further in the next chapter, engineers created Hive specifically to abstract away the necessity to write Java code.
CHAPTER 1 ■ SETTING THE STAGE FOR HIVE: HADOOP
12
■
Note
YARN stands for “Yet Another Resource Negotiator”. YARN was developed by Arun Murthy at
Hortonworks and is labeled as the “OS for Hadoop”. It takes the resource administration away from the original
MapReduce framework and allows MapReduce to focus on distributed processing instead of resource and task
management. Cluster resource management is now generalized under YARN, which opens up other applications
with different access patterns (interactive, real-time, as well as batch) to run simultaneously on the same
cluster. YARN was introduced in Hadoop 2.x. Hadoop versions prior to 2.x are labeled as traditional Hadoop.
Pre-YARN MapReduce is referred to as MRv1, while post-YARN MapReduce is referred as MRv2. YARN is discussed
further in this chapter, but to dive deeper into YARN, we recommend reading
Apache Hadoop YARN
by Arun
Murthy, Vinod Vavilapalli, Douglas Eadline, Joseph Niemiec, and Jeff Markham (Addison-Wesley, 2014).
As mentioned, Hadoop uses MapReduce specifically for processing data on a distributed network of computers. It does this by being what is called “embarrassingly parallel.” This means the initial processing of the data occurs on separate nodes in parallel. This differs from traditional processing, which runs processing on a single computer or, in the case of database processing, pulls data from disk and stores it in memory for processing.
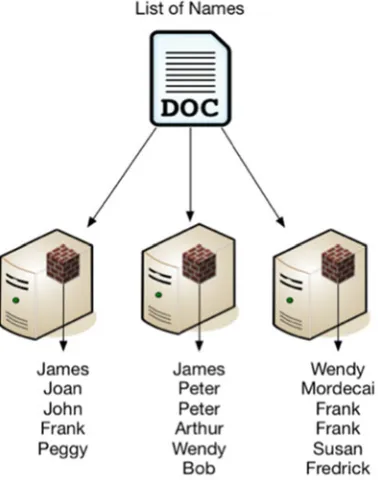
The Map phase is the first part of MapReduce parallel processing. Looking back on how Hadoop stores data on disk we remember it breaks a single file into multiple blocks. Each block contains a portion of the total data. So, if you have a 1 TB file with a list of names, that file will be broken into a large number of blocks with each block containing a subset of the names and these subsets stored on various nodes in the cluster. Figure 1-6 shows how a file containing names might be dispersed on a three-node cluster.
13
Mapping in MapReduce is actually a Java function. It takes input and produces a new output. The output is a key/value pair.
■
Note
As you continue your journey into the Hadoop ecosystem, you will come across a lot of examples of
the key/value pair concept. NoSQL focuses primarily on key/value structures. The reason this is important is
because the key/value schema works great for distributed processing as well as processing semi-structured
data not easily schematized into traditional RDBM systems.
In our example, a separate Map() function runs on each DataNode and processes all the blocks on that DataNode associated with the file. It does this independently of all the other blocks located on the other DataNodes. For the first node it will take the name James as input and output ( James, 1 ). It will do this for each name in the block for each node so you would get the following output:
(James,1), (Joan,1), (John,1), (Frank,1), (Peggy,1)
(James,1), (Peter,1), (Peter,1),(Arthur,1),(Wendy,1),(Bob,1) (Wendy,1),(Mordecai,1),(Frank,1),(Frank,1),(Susan,1),(Fredrick,1)
Keep in mind Hadoop processes each of these in parallel . There is no need for communication between nodes during the Map phase. This is critical when dealing with large data sets because you do not want inter-system communication or data transfer occurring between nodes. Introducing dependencies in processing can cause issues such as race conditions and deadlocks. By processing in parallel, Hadoop takes full advantage of dedicated IO resources in what is called shared nothing architecture.
Another key factor is the concept of taking the processing to the data. In our scenario, the Map task runs on the node where the data resides. The Map phase never pulls the data into a central location for processing. Again, this is key to processing large data sets since moving multi-terabytes or even petabytes amounts of data over the network would be impracticable. We want processing to occur on the nodes next to the data and utilize the full memory, disk, and CPU resources available to that node.
Once the Map phase completes, we have an intermediary phase called Shuffle and Sort. This phase takes all the key/value pairs from the Map phase and assigns them to a reducer. Each reducer receives all data associated with a single key. The Shuffle and Sort phase is the only time data is physically moved within the cluster and communication occurs between processes.
■
Caution
As we dig deeper into Hive performance we will want to focus on avoiding the reduce phase.
This phase can be a bottleneck because it requires moving data over the network as well as communication
between nodes. Also, the reduce phase cannot run until all mapping has completed.
CHAPTER 1 ■ SETTING THE STAGE FOR HIVE: HADOOP
14
The Shuffle and Sort phase is responsible for sorting the data by keys and sending the data to the reducer tasks. Each reducer will receive all the data from a single key. For example, this means that one reducer will receive all the data from the name James. If there are 2 or 200 people named James, a single reduce job will still receive all the data associated with the key James. Notice the name Peter. The name occurs twice and each occurrence is on a single block of data. In the case of Peter, the data does not have to move to another node but can be mapped and reduced on the same node.
15
■
Caution
Know your data! If you have a data set with a disproportionate number of values for a single key,
for example 50% of names in your file are Bob, then a single reducer may get overwhelmed.
The final stage is the Reduce phase. Reduce takes each key/value pair as input and produces a count aggregation based on the key. Those familiar with SQL can compare the reduce phase with a GROUP BY clause. The reducer will take ( Frank,1,Frank,1,Frank,1 ) and convert it to ( Frank,3 ). Figure 1-8 shows the final results.
At the end of all our processing, we get a list of names and the total occurrence of each name in the file. This may seem trivial, but we can potentially run this MapReduce example on a 10 TB file with 100 or more nodes. As we add more nodes to the cluster our performance will improve. Traditional RDBMs just do not scale to this level.
CHAPTER 1 ■ SETTING THE STAGE FOR HIVE: HADOOP
16
Beyond MapReduce
Mention has been made throughout this chapter on how MapReduce is not the only means to process data on Hadoop. MapReduce is an extraordinarily flexible parallel processing framework but, as scalable and flexible as it is, it also has many limitations. MapReduce processes data in batch. It exceeds at taking large data sets, processing them in parallel, and then aggregating the results. MapReduce does not work well with ad hoc or real-time query patterns. For example, if you want to get all sales for a product from every store in the past decade, and this query traverses 10 TB of data and you are willing to wait 10 hours for the results, MapReduce would be an excellent choice. But, if you want to get the top two items sold for five stores in Missouri and ten stores in Michigan, and you need that data in less than 10 seconds, then MapReduce is not a good solution. In reality, most organizations center around an ad hoc or near real-time processing business intelligence architecture of which MapReduce does not belong. Even simple SQL transactions using a small number of joins or GROUP BY clauses can take a long time to compute, especially when processing large amounts of data. We take for granted the speeds in which RDBMs process joins, GROUP BY , ORDER BY , and other computations and lose sight of the fact that the processing speeds are due to the upfront cost of constraining and conforming the data to specific schema structures and rules.
Hadoop is a schema-on-read as opposed to a schema-on-write framework. Ingesting data into traditional RDBMs involves transforming the data to fit into a relational structure comprising of tables, rows, and columns. Other structures also exist such as data types: int , varchar , date , as well as relational constraints between tables. The ETL (extract, transform, load) process works well, though still painful, when the source system is also relational. But what if your data is non-structured, or semi-structured? Log file data does not generally lend itself to a table structure. It is possible to transform the data into a relational model but at the cost of slowing down the data ingestion rate, as well as breaking the data ingestion process when simple domain constructs change, such as the adding columns or changing an integer value to a string. There is plenty of literature around the volume, velocity, and variety of modern data so I will not dive deeply into those ideas, but keep in mind that Hadoop is a framework conscious of the tradeoff between the traditional relational structure and the free-form process of ingesting data into a system that does not initially demand structure. Where we lose structure we gain flexibility. This is where Hadoop moves away from a simple storage environment and into a flexible and scalable compute environment that breaks down limitations between developers and rigid relational data structures.
Programmers write MapReduce tasks in Java. MapReduce handles the runtime complexities as well as the management and scheduling of jobs on the cluster. MapReduce requires a strong knowledge of Java and the MapReduce APIs. As Hadoop moves more mainstream, the product has had to move away from a Java development tool and cater more strongly to the areas of the business such as traditional ETL and business analytics which have dominated data analysis for the past 30 years. Adoption is key to the success of Hadoop and if everyone needs to learn Java to analyze data stored in Hadoop, overall adoption would be slow and difficult.
YARN has broadened the scope and flexibility of the Hadoop framework. YARN allows MapReduce to become only one method for accessing data stored on the Hadoop storage system. Other applications such as machine learning with Mahout and more recently Spark MLib, ad hoc querying with Hive and Tez, data flowing processing with Pig, and others can now execute side-by-side with MapReduce without any one application consuming all the cluster resources. YARN becomes fundamental to the adoption of Hadoop as an enterprise data store.
17
and toward a more scalable and adaptable framework like YARN to allow for interactive and near real-time usage, in addition to batch.
YARN and the Modern Data Architecture
So far we have discussed architectures around virtualization, SANs, traditional HA configurations, as well as disk configurations. These are fundamental concepts around data center design and standardization. Hadoop disrupts the notion of virtual servers, SAN storage, and RAID configuration. Vendors, data center administrators, as well as security administrators sometimes get nervous when asked to embark on this new way of storing and processing data. Let us also not forget the analysts who visualize and access the data for key business processes. The activities they perform are the gears moving the enterprise. They bring revenue and key insights to the business to drive new revenue channels and provide competitive advantage. Disrupting their activity means lost productivity and lost revenue.
A disruptive technology such as Hadoop inevitably stirs up backlash and FUD in many camps. Vendors will fight, and rightfully so, to maintain their data center footprint and argue for the advantages of their technology and the disadvantages of others. Other vendors try to embrace the inevitable implementation while assuming a key role in the play. While the storm of feature/function and risk/reward rages in the trenches, CIOs, CTOs, as well as business analysts just want the data efficiently and cheap as well as with minimal disruption.
The primary job of the Hadoop community and the vendors in the space (we will discuss vendors and distributions in more detail in the next chapter) is making minimal disruption a reality. Vendors, salespeople, and solution engineers can easily get mired in the feature debate and lose sight of the reason why Hadoop was created. Hadoop, at its essence, is a platform or architecture driving modern analytics. Industry refers to this as the Modern Data Architecture .
Figure 1-9 shows components of the Modern Data Architecture.
CHAPTER 1 ■ SETTING THE STAGE FOR HIVE: HADOOP
18
The architecture incorporates additional sources into the data flow that were previously untapped due to the restrictions of traditional RDBMs. We can now include sources such as clickstream, web and social, sensor and machine, logs, and images. As we pull this data into Hadoop as streaming inputs or batch, we stage them in HDFS for direct analysis or movement into other systems. This approach optimizes the RDBMs, EDW, and MPP resources by offloading resource intensive and time-consuming extract, transform, and load operations onto the much more economical Hadoop platform. You essentially move from an ETL model to a ELT model. You extract and load everything into Hadoop but only transform the data appropriate to your given platform or analytical needs.
YARN is the driving force behind this architecture. As previously mentioned, prior to the introduction of YARN the only computation engine for Hadoop was MapReduce. MapReduce has many benefits but also many restrictions. Traditional Hadoop places MR jobs into a queue and a job cannot run until the previous job finished. This was due to the notion of slots and how many of these slots were available for an MR job to run. MR jobs were batch operations taking hours or days to finish. MR is great if you use your cluster for answering singular Big Data questions, but if you wanted to analyze daily sales at the same time you are drilling through a dashboard, you were out of luck.
YARN introduces the idea of containers. Containers are a pool of resources such as CPU, storage, and memory dedicated to a specific application process. A ResourceManager schedules jobs and arbitrates application resources based on assigned policies. These policies may or may not include such things as “Marketing gets a maximum of 50% of the cluster memory” or “50% of the cluster memory is assigned to marketing and HR and of that HR gets 30%”. These key constraints allow for cluster resource provisioning on a user or group basis.
■
Note
The example given in the text would be an example of the Capacity Scheduler. This scheduler allows
for the granular allocation of resource on a per group or user level. Another example scheduler would be the
Fair Scheduler, which behaves as a FIFO (first-in-first-out) scheduler or, more simply, an equal opportunity
scheduler. The default scheduler for YARN is the Capacity Scheduler.
DataNodes run an ApplicationMaster whose purpose is to control each container on a per-application basis. The ApplicationMaster acts as the messenger for the ResourceManager, more specifically a
component of the RM called the ApplicationManager, and controls resource allocation locally on each node. This allows the YARN framework to scale better than if the ResourceManager were a central manager of all node resources and did not have the benefit of local resource negotiators.
The ApplicationMaster adds a benefit in that third-party products can write applications that utilize the AM design and their application will run in conjunction with other AM applications. As seen in Figure 1-9 , the introduction of the YARN framework and the AM daemon allows for multi-use query access such as batch, interactive, and real-time processing. We refer to this as multi-tenancy and it is the foundation of the Modern Data Architecture and why enterprises can now begin building a data lake to stage their data for whichever analytical tool they choose to swim in its waters. Integration is key to companies adopting Hadoop and to the implementation of the Modern Data Architecture. The original spirit of Hadoop and of YARN drives this integration in that the development of both is open and available for the benefit of all.
Hadoop and the Open Source Community
19
a distinct software development project within ASF. This distinction is important because it can cause confusion when determining compatible versions as well which features are available for which product versions. Luckily for us all project development for each product is executed in the open and we are able to freely follow conversations around feature enhancements as well as bug fixes. Besides the lack of software licensing, this is what makes open source software truly “open”. Development is not hidden away due to proprietary nondisclosure, in fact anyone can add to the discussion or recommend features that should be included in future product releases.
A number of large software companies like Microsoft have contributed open source code. Companies that have large Hadoop installations have also contributed code back into the product. What incentivizes them to make code public? The driver behind open source software development is the idea that by contributing code back to the project, the product innovates faster and everyone benefits from the innovations of the community. In addition, becoming a committer to an open source project is not a bad thing to have on your resume.
As you begin your Hive journey, you will be spending a majority of time on the ASF home page for Hive. This page can be found at http://hive.apache.org . Figure 1-10 shows the home page.