32 Agroland : The Agriculture Science Journal, 2018 June 5 (1) 32 - 43 ISSN : 2407 – 7585
E-ISSN : 2407 – 7593
CONVERSION OF AGRICULTURAL LAND AND ITS IMPACT ON
RICE PRODUCTION IN SIGI REGENCY
Al Alamsyar ¹), Muhammad Basir²), Lien Damayanti2)
1)
Agribusiness Program Faculty of Agriculture Tadulako University Palu, Email :alalamsyar@gmail.com
2)Faculty of Agriculture Tadulako University Palu Email :lien_damayanti@ymail.com
ABSTRACT
This research aims to assess the rate of agricultural land conversion, analyze factors affectagricultural land conversion, and analyze the impact of land conversion on rice production in Sigi District. Data analysis used is analysis of conversion rate, logistic regression analysis, and analysis of impact production. Result obtained Conversion of paddy field that happened in Sigi District from year 2009 until year 2016 which is about 20,75% or 4,499 Ha. with average value of depreciation every year equal to 2,96% or equal to 645,57 Ha.Based on the results of logistic regression analysis obtained from 7 independent variables, only 3 variables that significantly affect the land conversion that occurred. The influential variables are land area, land selling price, and
number of family dependents with Prob value. <α (10%). Variables that have no effect on land
conversion are length of stay, duration of farming, yield, and selling price of paddy. Based on the results of production impact analysis, obtained the lost production capacity of 39,719.81 tons of dry milled grain or about 4,467.97 tons of dry milled grain per year.
Keywords: Factors of Conversion, Land Conversion, Land Conversion Impact.
INTRODUCTION
Land conversion is an inevitable phenomenon both in underdeveloped, developing and developed countries, in line with economic growth and population growth (Azadi et al., 2010). Indonesia as a developing country is inseparable from land conversion issues. Land conversion issues generally occurs in the agricultural sector whose role declines in line with changes in economic structure. Over time, development in Indonesia has managed to spur economic growth and changes in economic structure. The growth of development indirectly changed the structure of Indonesian economy towards more industrial and service economy and impacted other sectors, especially the agricultural sector.
The economic growth signed by one of the most widespread agricultural land
conversion issues and anticipated is the conversion of paddy field. Paddy field is agricultural lands that has a greater chance of conversion than dry land (Irawan 2005).
For an agrarian country like Indonesia, the role of the agricultural sector is very important in supporting the national economy and is always a top priority, in this case as a provider of food, clothing and shelter for all residents, as well as producers of non-oil and gas export commodities to attract foreign exchange. That's because the number of Indonesians working in the agricultural sector and supported by the climate conditions of Indonesia and agricultural land potential.
33 award in agriculture is relatively low
compared to other sectors such as industry, mining and trade (Adimihardja, 2006).
Gross Regional Domestic Product Growth is one of economic indicator that can explain economic progress or development of a region. Based on data on the value and contribution of GDP based on current prices according to the field of business from 2010 to 2014, the agricultural sector provides the greatest value and contribution with of of 37.73%, it can be seen in Table 1 (Central Sulawesi BPS, 2015). The contribution provides the illustration that the agricultural sector contributes to the Central Sulawesi economy, this is supported by the increasing of conducive over all security in Central Sulawesi, price stability, the more effective implementation of post-crisis development of the implementation of regional autonomy.
Agricultural land which is the main factor of agricultural production system is not well maintained and guaranteed sustainability properly. If agricultural production is expected to offset the need of the population continues to increase then the broad and productivity of agricultural land is also continuously improved. However, reality shows another thing. Paddy field that are relied upon as major food crops tend to decline broadly in default due to conversion of agricultural land to non-agricultural land.
Central Sulawesi itself has a vast agricultural land of 6.184.129 Ha area of Central Sulawesi province with forest area of 3.964.840 ha which is approximately of 148.759 Km2 is paddy field farm and 713.509H ha is agricultural land of secondary crop, vegetable, fruit. The area of agricultural land in 2016 Central Sulawesi Province has a rice production surplus of 280,000 Ton. However, policies issued by the local government on investment in Central Sulawesi will threaten the sustainability of agricultural land in Indonesia.
One of the areas in Central Sulawesi encountering land use change due to
development is Sigi Regency. Although the government in this case has regulated the control of agricultural land in Law No. 41 of 2009 on Sustainable Land Protection of Food Agriculture, but local government
doesn’t control the process of land use
change as happened in Sigi regency today. Sigi Regency experienced a fairly rapid growth in its development. This is due to its strategic location, close to the capital development of the non-agricultural sector becomes one of the indicators in the development of regional development that pushes over the use of agricultural land to non-agricultural.
Sigi Regency , especially in Sigi Biromaru district, which is adjacent with Palu City, is the main target for investors to develop property business in the form of commercialized. People are more interested in selling land because it is considered to be able to make money faster than managing considered more profitable economically. While waiting for the buyer, the farmland turned into aabandoned land.
34 of food in the region as well as the
surrounding areas that depend on the production of paddy from the region that converts the land
This study aimed to examine the rate of conversion, analyze the factors that affect the conversion of agricultural land, and analyze the impact of land conversion on rice production in Sigi District.
MATERIALS AND METHOD
This research was conducted in SigiBiromaru district Sigi Regency, Central Sulawesi Province which directly borders with Palu City from July to December 2017 for six months. Selection of Sigi Regency as the location The study was conducted purposively with some considerations that used as the basis for the selection of Sigi Regency as a research area:
1. Sigi regency is the 3rd largest rice production area in Central Sulawesi Province.
2. Sigi Regency is a buffer area of Palu City which will be projected as a resettlement area from Palu City. 3. Sources of PAD income in Sigi
Regency of the agricultural sector where the majority of its people work as farmers.
The samples in this research were the farmers who were still working on their agricultural land. The research was conducted by using the non-probability sampling method because the number of population studied was not known for certain. The sample respondents in this study amounted to 40 people. Primary data was collected through interview technique by using questionnaire to respondent.
The data used in this research were primary data and secondary data. Primary data were used to find out factors influencing land conversion, the impact of land conversion to farmer income and the impact of land conversion impact to paddy production. The primary data were obtained from direct interview with land owner either
through questionnaires or in-depth interviews. Secondary data were used to determine the rate of land conversion. Secondary data were obtained from the Central Bureau of Statistics (BPS) of Central Sulawesi Province and BPS of Sigi Regency as well as from interviews with several related Office Device Organizations. Secondary data in the form of data on land conversion policy applicable, land price, and population, and other data that were considered to support in answering research questions.
Data analysis used in this research was qualitative analysis and quantitative analysis. Qualitative analysis was used to find out general illustration in research location which was descriptively described. Quantitative analysis used was land conversion rate analysis, logistic linear regression analysis, and analysis of production impact estimation
The rate of land conversion can be determined by calculating partial and continuous conversion rates (Sandi, 2009 in Astuti, 2011). Partial land conversion rate can be explained as follows:
V = 𝐿𝑡−𝐿𝑡−1
The rate of land conversion (%) can be determined by the value of the difference land area in year t to the previous year's land area, divided by the previous year's land area, then multiplied by 100%. This can be done in previous years so that the results can be obtained annual conversion rate.
Logistic regression analysis is used to estimate the factors that affect farmers in converting paddy field. According to Nachrowiet all (2002), the logit model is a non-linear model, both in parameters and in variables.
𝑌𝑖 =𝛼+𝛽1𝑋1+𝛽2𝑋2+𝛽3𝑋3+𝛽4𝑋4
35
NQ = The value of lost rice production Pt =
Qt = Production of loss rice production per year
type of technical irrigation of rice field, semi-technical , simple, and rain-fed.
Qi= Σ(Si. Hm ) Where :
Si = Paddy field area area with converted type of irrigation. Hm = The productivity of farming during
the planting season from the rice field with the type of irrigation. m = 1, 2, 3, Each number shows the
first, second, and last planting season.
The impact of land conversion on rice production was not calculated separately based on the type of rice field, due to the limited available data. The value of the productivity of agricultural land is also multiplied by the pattern of cultivation in one year, so that the value of harvested area of lost land in one year was obtained. It was assumed that all land had two cropping patterns with the productivity of all types of paddy field and the entire planting period in one year is the same.
RESULTS AND DISCUSSION
Description of Sigi Regency. This area was
36 make the investors glance at this region to
become new developing area that has the potential to be developed into the area of settlement.Not only that, Sigi Biromaru District status as the capital city of Sigi Regency also makes its own attraction for the development of trade and business services.
Land Conversion Rate in Sigi District. Land conversion in Sigi Regency now looks very apprehensive especially in productive paddy field. The conversion of paddy field is of course unfavorable for agriculture sector especially in fulfillment of main foodstuff for Sigi Regency and Palu City because it can decrease rice production capacity.
The Research that was conducted using secondary data from 2009 to 2016 was intended to know the rate of land conversion in Sigi Regency partially. Partial rate is an analysis showing the change of land use from year to year that encountered land change referring from the previous year. The conversion of paddy field to non-agricultural in Sigi Regency almost happens every year. This land shifting mainly occurs
in paddy field that switch the function of its use into settlements, shops, and other infrastructure facilities. The rate of land conversion can be seen in the following Figure.
Figure 1 Figure 1 shows the area of rice field that was relatively decreased from 2014 until 2016, while before 2013 the area of paddy field inSigi Regency was relatively increasing. The decrease of rice field area each year was fluctuating from year to year, such as in the year of 20011 and 2013 the area of paddy field had increased. Increased converted paddy field area in Sigi Regency most of the land used as residential area or settlement and trade area.
Generally, in the last 8 years there had been a decrease of 4,499 Ha or an average of about 642,71 Ha per year. The existence of land conversion that occurred resulted in the area of paddy field in Sigi Regency changed from 21,380 Ha in the year 2009 to 16,861 Ha in 2016. The rate of depreciation of paddy field area can be seen in the following table below.
Figure1. Land Conversion Rate Trend in Sigi Regency in 2009-2016
Secondary Data of Land Statisctic in 2009-2016 Ministry of Agriculture After Processed, 2018.
0 3000 6000 9000 12000 15000 18000 21000 24000
2009 2010 2011 2012 2013 2014 2015 2016
Lan
d
A
r
e
a
37 The land conversion rate signed
negative indicates that there was no shrinkage of paddy field due to land conversion function. Conversion of paddy field that occurred in Sigi District from 2009 to 2016 can be quite large, with a total of about 20.75% or equal to 4,499 Ha.
Depreciation of paddy field area was seen starting in 2012 where the land decreased by 1,075 Ha or depreciated by 4.93% from 21,838 ha of paddy field which then became 20,762 Ha. The highest decrease of rice field area occurred in 2014 that was equal to 4,473 Ha from 22,355 Ha of paddy field which then become 17,882 Ha or experienced depreciation of 20.01%. Increasing the number of rice fields areain Sigi Regency in 2011 increased by 478 Ha. The land had increased, which previously had an area of 21,380 Ha to be 21,838 ha or an increase of 2.24%. In 2013 there was also an increase of rice field area of 7.67% or 1,593 Ha from the area of 20,762 Ha in the previous year, to 22,355 Ha. The overall accumulation from 2009 to 2016 wetland area in Sigi Regency has depreciated every year with an average value of 2.96% or equal to 642,71 Ha. Based on the results of interview with the Secretary of Food Crops and Horticulture of Central Sulawesi Province the increase of the area of rice fields that occurred in 2013 because at
that time the provincial government implemented a program of optimizing unfilled fields or sleeping land in the entire province of Central Sulawesi in Sigi Regency.
According to Sumaryo and Tahlim (2005) in Shriwinanti (2013), there are two patterns of agricultural land conversion. First, land conversion is done directly by the landowner concerned or farmers, such as making a house for his family or warehouse for storage.Second, conversion of agricultural land begins with land acquisition. Farm owners sell their land to others who will use it for non-agricultural purposes. The landowners are indirectly considered to be converting to the agricultural land.
Factors affecting Land Conversion. Case
study of factor analysis affecting land conversion was done in Sigi Biromaru District with reason that SigiSubdistrict is the capital city of Sigi Regency and territory which is directly adjacent to Palu City which is the economic center of Central Sulawesi Province. There were 40 farmers who owned the land that was the respondent consisting of 24 farmer respondents who had sold the land and 16 farmers respondents who did not sell land. Farmers' decisions in land conversion are Table1. Area and Rate of Paddy Field Conversion in Sigi Regency, 2009-2016.
Years Land Area (Ha) Converted Land Area
(Ha) Conversion Rate (%)
2009 21.360 0 0
2010 21.360 0 0
2011 21.838 478 2,24
2012 20.762 -1.076 -4,93
2013 22.355 1.593 7,67
2014 17.882 -4.473 -20,01
2015 16.905 -977 -5,46
2016 16.861 -44 -0,26
Total -4.499 -20,75
Average -642,71 -2,96
38 influenced by factors such as length of stay,
length of farming, land area, yield, rice sale price, land selling price, and number of family dependents.
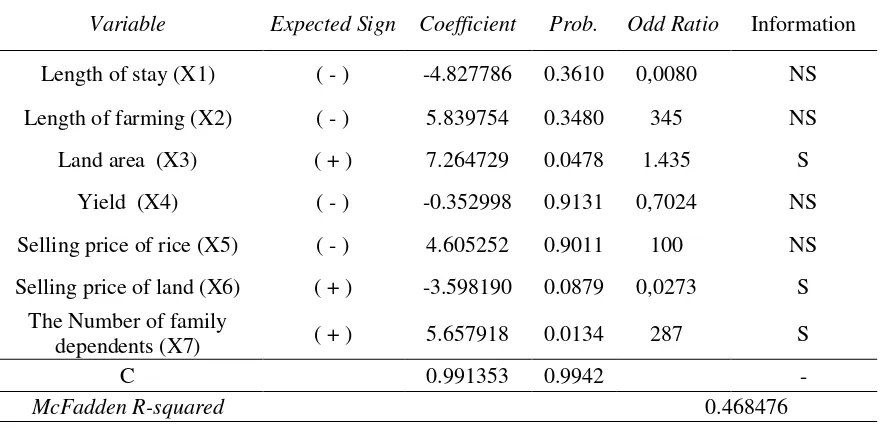
The method that can be taken in knowing the factors that influence the farmer's decision to convert the land used logistic regression analysis method by entering the independent variable into the dependent variable. The dependent variable used there were two possibilities. For the respondents who converted the agricultural land was given a value of 0 (Y = 0) and for the repondent who did not convert the land was given a value of 1 (Y = 1). The independent variables that affected the farmer to convert land were: length of stay, length of farming, land area, production, rice sale price, land selling price, and the number of family dependents. The results of data management are presented in the following table 2.
Based on the results of logistic regression analysis using e-views application 8 obtained from 7 independent variables,
only 3 variables that had real effect on land conversion happened. The variables that have significant effect were land area, land selling price, and the number of family dependents. The variables that had no effect on land conversion were length of stay, duration of farming, yield, and selling price of paddy. The significance or not significance of an independent variable is seen from the value of Prob. <Α. The value of McFadden R-squared on this analysis was 0.468476 indicating that only 46.8% of the paddy field conversion in Sigi Regency was affected by land variables, land selling price, and the number of family dependents, while the remaining 53.2% was affected by another variable that was not examined in this study.
The model obtained from the logistic regression analysis is as follows:
Y = 0,991353 – 4.827786 X1 + 5.839754 X2 + 7.264729 X3 - 0.352998 X4 + 4.605252 X5 - 3.598190 X6 + 5.657918 X7
Table 2. Estimation Result of Factors Affecting Farmers Converting Land.
Variable Expected Sign Coefficient Prob. Odd Ratio Information Length of stay (X1) ( - ) -4.827786 0.3610 0,0080 NS
Length of farming (X2) ( - ) 5.839754 0.3480 345 NS
Land area (X3) ( + ) 7.264729 0.0478 1.435 S
Yield (X4) ( - ) -0.352998 0.9131 0,7024 NS
Selling price of rice (X5) ( - ) 4.605252 0.9011 100 NS Selling price of land (X6) ( + ) -3.598190 0.0879 0,0273 S
The Number of family
dependents (X7) ( + ) 5.657918 0.0134 287 S
C 0.991353 0.9942 -
McFadden R-squared 0.468476
Primary data after processed 2018.
Description :
39 Figure2. Trend of Rice Production Based on Harvested Area in Sigi Regency,
2009-2016
Secondary data after processed 2018
Variable selling price of farmers land hadProb value of 0.0879 which means that this independent varaibel significantly affect the chances of land conversion on the level of real α = 10% (0.0879 <0.1). The coefficient of the obtained output was positive (-) and the value of Exp (β) or odds ratio obtained was 0.0273 which indicates that the farmers' chance of not doing the land conversion will be less. This indicates that the lower the selling price of the land, the smaller the farmers' opportunity to convert the land by 0.0273 times compared to land conversion. High land prices were offered by investors of their own interest to the farmers. The higher the selling price of the offered land will give greater benefits to the farmers, so that the farmers willing to sell their land for later converted to function as a residential area.
The findings of Rusastra dan Budhi (1997) in South Kalimantan, the reason for the practice of land conversion is the need and high price of land, the scale of the business is always efficient to be sought. In the same year the study of ethnicity (1995) in Nyak et al, (2005) found that the reason for the land conversion because of the need, the land is in the industrial estate, and the price of land. X
Other independent variables that significantly affected the occurrence of
wetland conversion was the number of family dependents. The family dependents variable had Prob value. of 0.0134 which means that this independent varaibel significantly affected the chances of land conversion on the level of real α = 10% (0.0134 <0.1). The coefficient of output obtained positive (+) and the value Exp (β) or odds ratio obtained by 287 which showed the chance of farmer did land conversion will be greater. This indicates that the more number of dependent family members, the farmers' opportunity in the conversion of land 287 times than not convert the land. The number of dependents of the family is closely related to the number of family needs. The more members of the dependent family means more needs which must be met. Families with large household sizes will ultimately increase the burden of households to meet their daily needs so that farmers are forced to sell the land and convert it into non-agricultural land.
A study conducted by Astuti (2011) stated that the regression results show the number of dependents have a positive relationship with the value of coefficient 69.851 and had P-value of 0.087 which means that the variable gave a real effect on the converted land area with the level of confidence 85% (α = 0.15) . Regression 179,846
190,275 194,199
163,960
164,668
144,199
142,045
120,243
0 50,000 100,000 150,000 200,000 250,000
40 results have an effect because the more
number of dependents in a family then the need to be fulfilled will be increased so that the land owner will be interested in selling the land due to not having other sources, so the higher the number of dependents then the area of converted land will increase in line with the needs required.
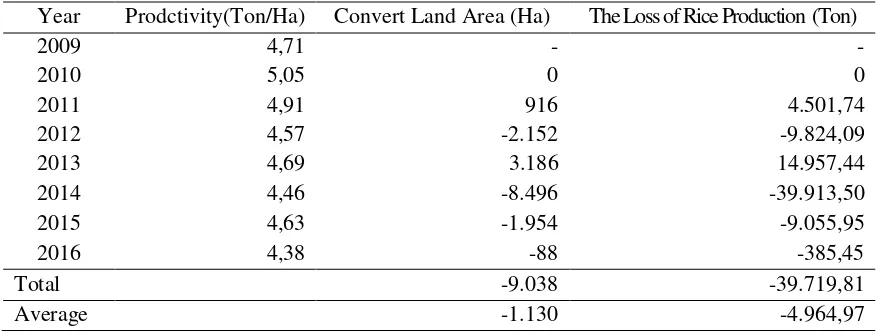
Impact of Land Conversion to Paddy
Production.Based on the development of
paddy field conversion in Sigi Regency can be said to have an impact on decreased rice production due to the decrease in the quantity of one of the factors of production that is reduced land area. The reduction of the value of one of these inputwas very potential in the decline of rice production.
Figure 2 above shows the negative trend of rice production in SigiRegency since 2009 until 2016. One of the causes of rice production is caused by the conversion of large agricultural land. When calculated based on the results of the analysis conducted can also note the large capacity of rice production on the condition of paddy field area that encountered land conversion as the following table 3.
The table above shows that the conversion of paddy field in SigiRegency during the period of 2009 to 2016 or within 8 years resulted in the loss of production capacity of 39,719.81 tons of dry milled grain or about 4,467.97 tons of dry milled grain every year. When converted is
equivalemt the conversion value of dried unhulled paddy grain of 62.74%, then during the period of 2009 to 2016 or the period of 8 years is equal to 24,920 tons of rice or about 3,115 tons of rice annually :
The value of rice production loss will result in the loss value of the rupiah. The value of the rupiah loss due to land conversion based on loss rice production can be calculated using the assumption that the price of 1 ton of dry milled grain was Rp. 4.485.000, -. The value of the rupiah loss during the period 2009 to 2016 or the period of 8 years amounted to Rp. 111.767.097.000, - or about 111.75 billion rupiahs. The average value loss each year was Rp. 13,970,909,550, - or about 13.97 billion rupiahs.
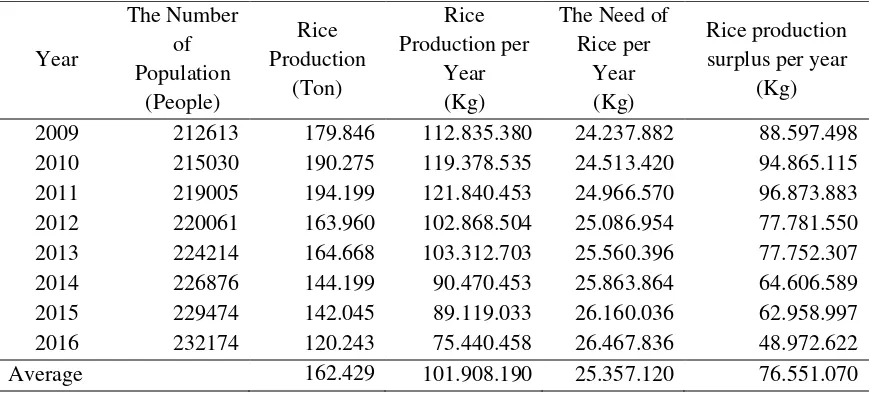
Impact of Land Conversion through
Food Availability. Estimation of the impact
of land conversion on food availability can be done by comparing the production and the total consumption of the population annually in Sigi Regency. The yield of rice production is obtained from the production of dried unhulled rice which is converted to rice with a conversion value of 62.74%. The amount of rice needed by the population was obtained from the consumption of population rice which is assumed to be 114 Kg / person / year based on per capita consumption data of Central Bureau of Statistics multiplied by population of Sigi Regency.
Table 3.The Loss of Rice Production
Year Prodctivity(Ton/Ha) Convert Land Area (Ha) The Loss of Rice Production (Ton)
2009 4,71 - -
2010 5,05 0 0
2011 4,91 916 4.501,74
2012 4,57 -2.152 -9.824,09
2013 4,69 3.186 14.957,44
2014 4,46 -8.496 -39.913,50
2015 4,63 -1.954 -9.055,95
2016 4,38 -88 -385,45
Total -9.038 -39.719,81
Average -1.130 -4.964,97
41 Table 4. Estimation of Rice Population Consumption Needs of Sigi Regency, 2009-2016.
Year
The Number of Population
(People)
Rice Production
(Ton)
Rice Production per
Year (Kg)
The Need of Rice per
Year (Kg)
Rice production surplus per year
(Kg)
2009 212613 179.846 112.835.380 24.237.882 88.597.498
2010 215030 190.275 119.378.535 24.513.420 94.865.115
2011 219005 194.199 121.840.453 24.966.570 96.873.883
2012 220061 163.960 102.868.504 25.086.954 77.781.550
2013 224214 164.668 103.312.703 25.560.396 77.752.307
2014 226876 144.199 90.470.453 25.863.864 64.606.589
2015 229474 142.045 89.119.033 26.160.036 62.958.997
2016 232174 120.243 75.440.458 26.467.836 48.972.622
Average 162.429 101.908.190 25.357.120 76.551.070
Secondary data after processed 2018
Figure 3. Rice Production Trend in Sigi Regency, Year 2009-2016
Secondary Data AfterProcessed 2018
The amount of difference value generated in the calculation of the table above can mean that the availability of food for public consumption in Sigi Regency was still surplus and can meet the needs of the community well. In fact, the availability of food that surplus can be supplied for the fulfillment of food needs for the city of Palu. However, if observed the difference in the need each year tend to decrease. The decrease was due to the increasing community demand for rice because of the continued increase in population, meanwhile, the decrease of yearly rice production caused by the continuing shifitng of paddy field due to conversion of agricultural land to non-agricultural land.
Figure 3 above shows the decrease in the amount of rice production that occurred in Sigi Regency was very apprehensive. The decrease of rice production was caused by continued shirnking of productive agricultural land resulting from the conversion of agricultural land that continues to occur.
Based on the estimation of the calculation of rice consumption requirement of Sigi Regency population, the average consumption of rice for the population during the period of 2009 to 2016 or the period of 8 years was 25,357,120 Kg or about 25,357 tons per year. Meanwhile, the average rice production in Sigi Regency
112,835,380
119,378,535 121,840,453
102,868,504
103,312,703
90,470,453
89,119,033
75,440,458
0 20,000,000 40,000,000 60,000,000 80,000,000 100,000,000 120,000,000 140,000,000
42 during the period of 2009 to 2016 or the
period of 8 years amounted to 101,908,190 Kg or about 101,109 tons per year. The comparison between the consumption needs of rice and the production of rice produces a rice surplus available. The average rice surplus was 76,551,070 per year or about 76,551 tons per year.
A substantial decrease in rice surplus with a percentage decrease rate of up to 40% from the base year of calculation looked very worrying. The value of rice surplus which was originally 88,597,498 Kg decreased to 48,972,662 Kg. The trend of continuous downward trend was feared to get worse. That is not impossible with the continued increase in the number of people who accompanied the continued conversion of paddy field that resulted in the decrease in the amount of paddy rice production 10 to 20 years ahead.
CONCLUSION AND SUGGESTION
Conclusion. Based on the results of
research and discussion that had been implemented, it can be concluded as follows:
1. Conversion of paddy field that occurred in Sigi District from year 2009 until year 2016 which was about 20,75% or equal to 4,499 Ha. The overall accumulation from 2009 to 2016 wetland area in Sigi Regency had depreciated every year with an average value of 2,96% or equal to 9645.57 Ha. 2. Based on the results of logistic
regression analysis obtained from 7 independent variables, only 3 variables that significantly affected the land conversion occurred. The influential variables were land area, land selling
price, and number of family dependents with Prob value <α (10%). Variables that had no effect on land conversion were length of stay, duration of farming, yield, and selling price of paddy.
3. Based on the results of production impact analysis, obtained the lost production capacity of 39,719.81 tons of dry milled grain or about 4,467.97 tons of dry milled grain per year. When converted rice equivalent to the conversion value of dried unhulled paddy grain of 62.74%, then during the period of 2009 to 2016 or the period of 8 years is equal to 24,920 tons of rice or about 3,115 tons of rice annually.
Suggestion. Based on the results and
discussion that had been implemented, there are some recommended suggestions for consideration, as follows:
1. It needs the role of central and local governments in strictly implementing regulations and policies in protecting productive food lands so that the conversion of agricultural land can be reduced primarily on productive lands. 2. The need for a policy review on the
development permit for residential, industrial, and service areas on productive agricultural land referring to the regulations and policies in accordance with the spatial pattern established in RTRW
3. Direction of the construction of new residential areas in areas that have no longer productive fields or in existing abandoned areas.
4. Extension of other food consumption diversification programs was necessary to avoid dependency on rice consumption.
REFERENCES
Adimihardja A. 2006. Strategi Mempertahankan Multifungsi Pertanian di Indonesia. Jurnal Penelitian dan Pengembangan Pertanian. Departemen Pertanian. 25(3):231-245.
43 Azadi H, Ho P, Hasfiati L. 2010. Agricultural Land Conversion Drivers: A Comparison Between Less Developed, Developing and Develoved Countries. land degradation & development. [internet]. [diacu 2016 Februari 25]. Published online in Wiley Online Library (wileyonlinelibrary.com). DOI: 10.1002/ldr.1037.
Badan Pusat Statistik, 2017. Kabupaten Sigi Dalam Angkatahun 2017.Kabupaten Sigi. Badan Pusat Statistik, 2015. Sulawesi Tengah Dalam Angka tahun 2015.Sulawesi Tengah.
Irawan B. 2005. Konversi lahan sawah: Potensi Dampak, Pola Pemanfaatannya dan Faktor Determinan. Jurnal Forum Penelitian Agro Ekonomi, Vol 23 No 1 Juli, Tahun 2005.Hlm 1-18.
Nachrowi ND, Hardius U. 2002. Penggunaan Teknik Ekonometrika. Rajawali Pers, Jakarta.
Nyak I, Yusman S, Supena F, 2005. Perkembangan Dan Faktor-Faktor Yang Mempengaruhi Konversi Lahan Sawah Serta Dampak Ekonominya. Jurnal OCA (SOCIO-ECONOMIC OF AGRICULTURRE AND AGRIBUSINESS), Vol. 5, No. 2 tahun 2005.
Pingkan W, Amalia R, Lambombangn M, 2015. Identifikasi Lahan Tidur di Kabupaten Sigi. Badan Perencanaan Pembangunan Daerah (BAPPEDA). UniversitasTadulako
Rusastra, I W. dan G.S. Budhi. 1997. Konversi Lahan Pertanian dan Strategi Antisipatif dalam Penanggulangannya. Jurnal Penelitian dan Pengembangan Pertaanian. Vol XVI, No 4, Hal 107 – 113. Badan Penelitian dan Pengembangan Pertanian, Departemen Pertanian. Bogor.
Shriwinanti L, 2013. Analisis Faktor-Faktor Yang Mempengaruhi Konversi Lahan Pertanian Serta Dampak Ekonomi Di Kabupaten Tangerang. Skripsi Departemen Ekonomi Sumberdaya dan Lingkungan Fakultas Ekonomi dan Manajemen Institut Pertanian Bogor, Bogor.