WATERSHED HYDROLOGICAL ANALYSIS
OF JAKARTA EXTREME FLOODS
Anastasia Yunika, Mukand Singh Babel, Satoshi Takizawa
Civil Engineering Department, Faculty of Engineering, University of Atma Jaya Yogyakarta, Jl. Babarsari 44, Yogyakarta 55281, Indonesia
E-mail: [email protected]
Abstract:Jakarta flood is a routine event. It occurs annually in rainy seasons while extreme flood takes place approximately every five years. Various factors, from natural to man-induced and technical to non-technical ones, are involved in causing the detrimental impacts of the flood. Among those factors, the existence of Ciliwung as the main river flowing across Jakarta leads to the complication of the problem. This study analyzed the main hydrologic parameters, i.e. rainfall and river discharge in Ciliwung’s catchment area, to assess the extreme floods in Jakarta. Three extreme flood events, i.e. two events in 1996 and one event in 2002 were analyzed based on the rainfall data at five stations overall area of Jakarta and river discharge at four stations along Ciliwung. The result of analysis revealed the factors of main causes of the extreme events. Furthermore, it is expected that by considering the past record of similar events in various study reports, precautions could be developed to anticipate predictable impacts from such events in the future, and recommendations could be provided as alternatives to overcome the problem.
Keywords: discharge, flood, hydrological analysis, rainfall, watershed
INTRODUCTION
Flooding in Jakarta has been continuously problematic. Annual floods routinely take place every rainy season. In the last two decades, three big floods occurred, i.e. in 1996, 2002, and 2007. Various studies have been conducted to identify the causes, analyze the situation, and finally come up with the recommendation of solutions. However, the problem still exists up to date due to its complexity. This study describes two main hydrological parameters, i.e. rainfall and river discharge, then analyzes them. It is expected that the details of three flood events, i.e. two events in 1996 and one event in 2002, can be clearly explained and then be used together with the results from earlier studies to provide recommended solutions to overcome the problem.
Profile Of Jakarta
Being located in the north side of West Java Province and situated at 106°22`42"E to 106°58`18"E and -5°19`12"S to -6°23`54"S, Jakarta covers 661.52 km2 land area and 6,997.5 km2 sea area. Hence, the climate is tropical with average daily temperature of 27C, humidity of 80-90% and influenced by seasonal wind as its location is around the equator. The west season wind blows in November to April (i.e. rainy season) while the east season wind on May to October (i.e. dry
season). Its daily temperature is affected by the sea wind as it is a coastal city that is located along the shore. The average annual rainfall is 2,000 millimeters with the highest one is in January and the lowest one is in September.
(BPS Propinsi DKI Jakarta, 2002).
Length = 109 km
original width = 60 m
existing width = 15 m
minimum elevation = 6.3 m above MSL maximum elevations = 1,500 m above MSL
average slope = 1/70
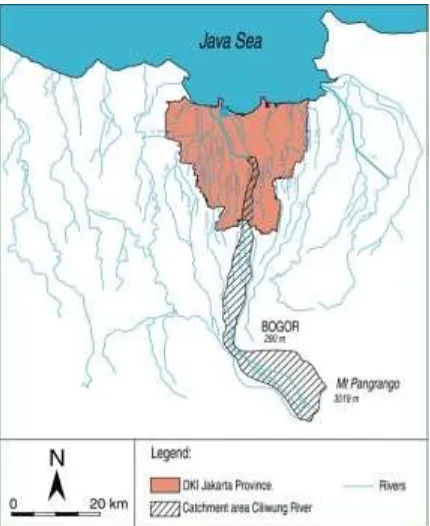
catchment area = 337 km2
Topography = mountainous
flood plain present land use =urban area
design scale =100 years
design 1-day rainfall =134 mm design discharge =570 m3/s specific discharge =1.69 m3/s/km2 present discharge capacity =120 m3/s required discharge capacity =360 m3/s carrying capacity (bankful) =200-1,700 m3/s carrying capacity (freeboard) =175-1,450 m3/s
Figure 1.Ciliwung River and its catchment area at the upstream of Manggarai Weir (ACF 2004; NEDECO, 2002)
There were three big flood events in Jakarta in the last two decades, i.e. in 1996, 2002, and 2007. However, some mass media reported that the 2002 flood was the worst one in Jakarta’s history in terms of the area affected and number of people displaced. At least 57 people were dead and 365,000 had been made homeless, 114,441 were accommodated in temporary shelters. Torrential rains began pounding Indonesia on January 29 and continued unabated for days, causing widespread flooding in the greater Jakarta area and surrounding municipalities. By February 2, the floodwaters had reached the heart of the capital, inundating the Presidential Palace and central business district. The city of around 12 million ground to a halt as major thoroughfares were blocked and
of rotting garbage and thick mud, increasing the danger of epidemics.
METHODOLOGY
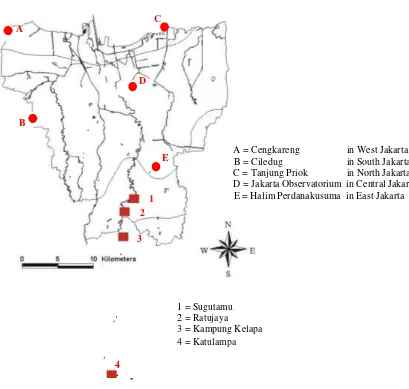
Figure 2. Location of rainfall stations and
2003 was then conducted as a comparison. A discussion based on other similar studies followed the analysis.
RAINFALL ANALYSIS
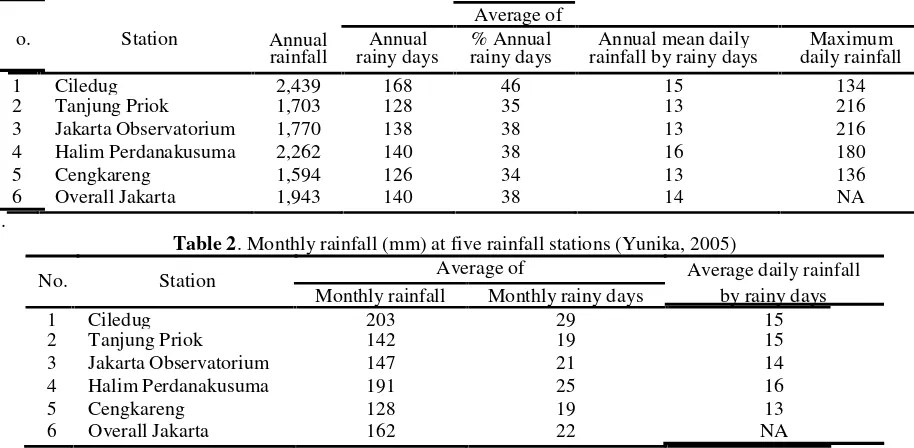
The average rainfall data from five rainfall stations used in this study results 1,943 mm as shown in Table 1. The minimum annual rainfall is of 1,232 mm in 1997 at Cengkareng Station and the maximum annual rainfall is 2,585 mm in 1992 at Ciledug Station. The highest annual rainfalls were mostly recorded at Ciledug and
Halim Perdanakusuma Stations. The number of rainy days shows that 1,943 mm rainfall occurred in a shorter period of rainy season, which theoretically should be half-year period. In other words, it is understandable that there are relatively high daily rainfalls in some concentrating days; the days that are prone for flood to occur. The minimum and maximum numbers of rainy days were recorded at Cengkareng and Ciledug Stations of 36 and 207 days respectively. The highest rainy day were mostly recorded at Ciledug Station.
C A
D
B
A = Cengkareng in West Jakarta
E B = Ciledug in South Jakarta
C = Tanjung Priok in North Jakarta
D = Jakarta Observatorium in Central Jakarta
1 E = Halim Perdanakusuma in East Jakarta
2
3
1 = Sugutamu 2 = Ratujaya
3 = Kampung Kelapa 4 = Katulampa
4
Average of
o. Station Annual Annual % Annual Annual mean daily Maximum
rainfall rainy days rainy days rainfall by rainy days daily rainfall
1 Ciledug 2,439 168 46 15 134
2 Tanjung Priok 1,703 128 35 13 216
3 Jakarta Observatorium 1,770 138 38 13 216
4 Halim Perdanakusuma 2,262 140 38 16 180
5 Cengkareng 1,594 126 34 13 136
6 Overall Jakarta 1,943 140 38 14 NA
Monthly rainfall Monthly rainy days by rainy days
1 Ciledug 203 29 15
2 Tanjung Priok 142 19 15
3 Jakarta Observatorium 147 21 14
4 Halim Perdanakusuma 191 25 16
5 Cengkareng 128 19 13
6 Overall Jakarta 162 22 NA
Table 1.Annual rainfall (mm) at five rainfall stations (Yunika, 2005)
.
Table 2. Monthly rainfall (mm) at five rainfall stations (Yunika, 2005)
No. Station Average of Average daily rainfall
The monthly rainfall analysis shows that at all stations, the two highest average rainfalls occurs in January and February, two wettest months. These two months are the prone months of flooding in Jakarta. The recorded flood events mostly occurred in these months. The result of monthly rainfall analysis is shown in Table 2The average daily rainfall during rainy days varies from 12 to 18 mm with the average of 14 mm for the whole Jakarta as shown in Table 1. The lowest and highest local rainfalls are 9 mm at Cengkareng and 22 mm Halim Perdanakusuma Stations respectively. Despite the highest annual rainfall is at Ciledug Station, the highest average daily rainfalls are mostly present at Halim Perdanakusuma Station. Two same values were recorded as maximum daily rainfalls, i.e. 216 mm at Tanjung Priok Station in 1990 and Jakarta Observatorium Station in 1996. This value far exceeds the mean daily rainfall of 14 mm. Daily rainfall analysis related to the flood events is conducted prior to, during and after flood events as follow.
DISCHARGE ANALYSIS
Going in line with the result of daily rainfall analysis, the result of river discharge analysis shows two highest average values, i.e. in
daily river-discharge help to understand the flood events better.
EXTREME FLOOD ANALYSIS
As reported by some mass media, the flood occurred in Jakarta in 2002 was the worst one in Jakarta’s history in terms of the area affected and number of people displaced. At least 57 people are dead and 365,000 had been made homeless, 114,441 were accommodated in temporary shelters. Torrential rains began pounding Indonesia on January 29 and continued unabated for days, causing widespread flooding in the greater Jakarta area and surrounding municipalities. By February 2, the floodwaters had reached the heart of the capital, inundating the Presidential Palace and central business district. The city of around 12 million ground to a halt as major thoroughfares were blocked and shops, schools and factories closed. At the peak, about a quarter of Jakarta was under water. As the water receded it left behind piles of rotting garbage and thick mud, increasing the danger of epidemics.
Flood events in 1996
D
It is apparent that the rainfall depth prior to the events is relatively high especially the one in February. Hence, it can be said that the local condition increases the risk of flood to occur even regarding the one in January which was claimed to be caused by upstream condition. The high-accumulated 7 days rainfall prior to the flood event by showing three out of five stations is approximately 200 mm, even it is more than 200 mm at Jakarta Observatorium Station. Figure 3 depicts that one day prior the event in February, i.e. 9 February, again the rainfall recorded at Jakarta Observatorium Station is more than 200 mm. The accumulated 7 days rainfall prior to the flood event results more than 370 mm at Jakarta Observatorium Station.
The Ciliwung River discharge at four stations at the time of those events is presented in Figures 4. It is clearly shown that they are significantly increased from the previous sequent. In January it reaches the peak in the first day of inundation, i.e. 6 January, similarly in February it reaches the peak also in the first day of inundation, i.e 10 February. The discharge in January is relatively higher than the February discharge. The river discharge stations are located in the middle to upstream reach of Ciliwung while the rainfall stations are located more in the downstream area of the river. When the extreme rainfalls in February are higher than the ones in January, it is not the case of the river discharge. This indicates that they did not stand alone, but were interrelated to each other in causing the floods.
Ciledug Tanjung Priok Jakarta Observatorium Halim Perdanakusuma Cengkareng Ciledug Tanjung Priok Jakarta Observatorium Halim Perdanakusuma Cengkareng
Figure 3.Daily rainfall in January and February 1996 at five stations in Jakarta (Yunika, 2005)
800
Katulampa Kampung Kelapa Ratujaya Sugutamu Katulampa Kampung Kelapa Ratujaya Sugutamu
D
Ciledug Tanjung Priok Jakarta Observatorium Halim Perdanakusuma Cengkareng Ciledug Tanjung Priok Jakarta Observatorium Halim Perdanakusuma Cengkareng
Figure 5.Daily rainfall in January and February 2002 at five stations in Jakarta (Yunika, 2005)
800
Katulampa Kampung Kelapa Ratujaya Sugutamu Katulampa Kampung Kelapa Ratujaya Sugutamu
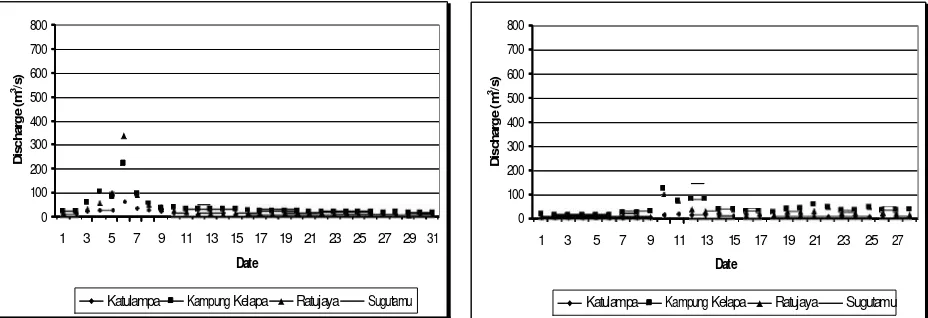
Figure 6.Daily discharge in January and February 2002 at four stations along Ciliwung River (Yunika, 2005)
Flood event in 2002
The event lasted from 25 January-10 February (Nedeco, 2002). The point rainfalls at five stations in Jakarta are drawn in Figures 5 to present the local hydrological condition around the flood event in 2002. The rainfall graph shows the high rainfall on 13-14 January and again on 22 January to 1 February. The continuous rainfall finally caused the river flow overtopping the bank. The daily discharge in Ciliwung River is presented in Figures 5.12 and 5.13. They shows that at the time of the first flood in the mid of January, the river flow is relatively low. Then it starts increasing and reaches its peak on 30 January and 1 February. All these facts support the above analysis and conclusion stated by NEDECO study (2002). Similar to the events in 1996, the discharge of Ciliwung in the middle to upstream reach of the
was not the case of the river discharge. At that time no extreme flood was reported in Jakarta.
DISCUSSIONS
Table 3.Jakarta flooding in 1996 and 2002 (Yunika, 2005)
Parameters 1996, First Flood 1996, Second Flood 2002 Flood
Occurrence 6-7 January 10-11 February 25 January-10 February
Flood cause High rainfall at the High local rainfall intensity Heavy rainfall in Jakarta and
upstream of Ciliwung in Jakarta surrounding areas (Depok,
River Tangerang, Bekasi) for 10
consecutive days of 5 years return period but the flood was of 20 years return period
Hydrological facts
Katulampa rainfall =
141 mm/4 hours
hours (equals 1000 years return period)
Normal rainfall = 80
mm
185 mm/24 hrs = 100
yrs return period
Rainfall at some posts: Tanjung Priok = 231 mm BMG Office = 216 mm Cawang = 172 mm PA Pulogadung = 175 mm
Katulampa discharge =
240 m3/s
On 30 Jan, rainfalls in some places (for 24 hours duration):
Bekasi = 250 mm (100 years
return period)
Tanjung Priok = 147 mm
Depok = 148 mm
Gunung Mas (Puncak) = 147
mm
Manggarai discharge = 400 m3/s Manggarai water level = +10.5 m
Inundation cause
Rivers flooding Various problems of the
urban drainage and the daily rainfall intensity which exceeded the designed capacity
Insufficient O&M to the rivers and drainage system
Inundated areas
15 villages of 3,000 Ha Depth = 0.5-3.0 m
65 points of 5,200 Ha (8% of Jakarta)
Depth = 1-2 m
On 2 February:
63.4% of villages of 2.5 m deep and 16,041 Ha (almost 24.7% of DKI Jakarta)
381,296 evacuated estimated loss = almost 10 quadrillion rupiahs
Reported by JICA, March 1997 JICA, March 1997 NEDECO, July 2002
rainfall than the coastal plain in proportion to those annual rainy days. This goes in line with the general condition that monthly rainfall in mountainous area is, generally not so less in dry
upstream Ciliwung basin was much while it was less rainfall around the Jakarta area of
lower Ciliwung basin. In contrary, on 10-11 February, it occurred oppositely.
Similar to the 1996 flood event, in 2002 the flood occurred on 26-27 January and 11-14 February. The Netherlands Engineering Consultants (NEDECO, 2002) justified that the fundamental difference with the 1996 flood was that both the peak flows from upstream and the local heavy precipitations occurred simultaneously in a couple of days. This time the water level passed through Manggarai gate was 400 m3/s which was lower than the one in 1996, i.e. 500 m3/s. In 1996, the flood return period was 50 years and it was 20 years in 2002. The rainfall was similar to the one in 1996, which the maximum point rainfall also occurred in Bekasi, i.e. 250 mm and its return period was approximately 100 years but this time it occurred for ten consecutive days. At the beginning of the second flood, the springtide also happened simultaneously but immediately lost its peak.
Hence, it had nothing to do when the peak occurred in 4 February. The top flow in Katulampa, the upstream of the Ciliwung River, did not have anything to do with the flood peak as well, since it took place one week earlier than the flood peak time. Furthermore, the Ciliwung top flow on 4 February must have been caused by the intense rains in the middle reach of the catchment area, i.e. along Depok to Manggarai. On the other hand, the rainfall analysis concluded that February 2002 daily rains may have a return period of approximately five years only, whereas the river peak flows had a return period of approximately 20 years.
Assessing those return period values, the study claimed that a 20-years flood normally must not have caused any large-scale urban inundation as the one experienced during the other floods.
Although the magnitude of the flood in 2002 was lower than the one in 1996, the inundated area was much larger than the one 1996. It was
CONCLUSIONS
Hydrologically, the extreme floods in Jakarta occurred mainly due to heavy rainfalls in the downstream area. The river flooding represented by high discharge recorded in the middle to upstream reach of Ciliwung contributed to worsen the condition. However, the severity of flood impact in terms of inundated area, number of victims and loss was also resulted from the complexity of various factors other than just hydrologic variables, such as location of residential and commercial areas. Therefore, the solution to overcome the problem of flooding in Jakarta requires not only technical measures. In fact, it should be an integrated watershed management that also covers the non-technical aspects, such as social and politics
REFERENCES
ACF (Action Contre la Faim), 2004, Profile of
Kampung Melayu,Jakarta.
BPS (Biro Pusat Statistik) Propinsi DKI Jakarta, 2002, Jakarta Dalam Angka 2002, Jakarta.
JICA, 1997, Directorate General of Water Resources Development, Ministry of Public Works, the Republic of Indonesia,
The Study on Comprehensive River Water
Management Plan in Jabotabek. Final
Report, Volume III, Main Report-Feasibility Study,Jakarta.
JICA, 1997, Directorate General of Water Resources Development, Ministry of Public Works, the Republic of Indonesia,
The Study on Comprehensive River Water
Management Plan in Jabotabek, Final
Report, Volume III, Main Report-Master Plan, Jakarta.
JICA, 1997, Directorate General of Water Resources Development, Ministry of Public Works, the Republic of Indonesia,
The Study on Comprehensive River Water
Management Plan in Jabotabek, Final
Report, Volume IV, Annexes I, Jakarta. NEDECO, 2002, Ministry of Transport, Public
NEDECO, 2002, Ministry of Transport, Public Works and Water Management of the Kingdom of the Netherlands, Departemen Permukiman dan Prasarana Wilayah, Pemerintah DKI Jakarta, Final Report
Quick Reconnaissance Study, Flood
Jabodetabek 2002, Appendix Report,
Jakarta.
Yunika, A., 2005, Public Health Impact of Urban Flooding: A Case Study of Jakarta,
Indonesia, Master Thesis, Thailand.