IMPROVING SPATIAL RESOLUTION OF AGRICULTURAL WATER USE
ESTIMATION USING ALOS AVNIR-2 IMAGERY
T.K. Alexandridis (1), Y. Chemin (2), I. Cherif (1), G. Tsakoumis (1), G. Galanis (3), G. Arampatzis (4), G.C. Zalidis (3), N.G. Silleos (1), and E. Stavrinos (5)
(1)
Lab of Remote Sensing and GIS, School of Agriculture, Aristotle University of Thessaloniki, Thessaloniki 54124, Greece, Email: [email protected]
(2)
Geography Lab, International Rice Research Institute, Metro Manila, Philippines, e-mail: [email protected] (3)
Lab of Applied Soil Science, School of Agriculture, Aristotle University of Thessaloniki, Thessaloniki 54124, Greece, Email: [email protected]
(4)
Land Reclamation Institute, Sindos Thessaloniki, Greece, e-mail: [email protected] (5)
Ministry of Rural Development and Food, Directorate of Land Reclamation Works, Athens, Greece, e-mail: [email protected]
ABSTRACT
Estimating agricultural water use is an issue of primary importance in the Mediterranean. At the same time, several advanced algorithms have been developed, which couple Earth Observation data in thermal, visible and near-infrared wavelengths with a few meteorological measurements to provide a close approximation to the actual water use. However, due to the detailed cropping pattern of the Greek agricultural landscape, higher resolution satellite imagery is necessary, a demand which may not be met by the available thermal infrared imagery (Landsat 5 TM and Terra/ASTER). This study investigates the contribution of ALOS AVNIR-2 images to estimate agricultural water consumption in high spatial resolution. Two methods were tested, the Surface Energy Balance Algorithm for Land and the remote sensing crop coefficient method. The results were compared against similar products derived with Terra/MODIS and Landsat TM images, used as reference. Comparisons were based on a pixel level, with a random dataset for pixel to pixel comparison and on a canal command area level, with statistical comparison of the water use estimations. Merging of the two datasets was based on the modified Brovey technique, which has the advantage of maintaining the original values, but redistributes them in a higher resolution space. Concluding, ALOS AVNIR-2 significantly underestimated agricultural water use with the crop coefficient method, but was successful in providing the element of high spatial detail to the MODIS derived result, proving to be a useful input in modelling water use of irrigated Greek basins.
1. INTRODUCTION
Agricultural water use is estimated to exceed 70% of freshwater consumption in the Mediterranean (www.fao.org). Although precise information is necessary for water managers, gross measurements are
only available for large regions, and rough estimations for areas without organized irrigation systems. As a result, water savings in the Mediterranean are in preliminary phase only. At the same time the European Water Framework Directive 2000/60/EC (WFD) states that Member States shall estimate and recover the costs of water services, including environmental and resource costs, and in accordance with the polluter pays principle.
Balancing the limited water resources to match the human needs is a challenge to be faced in the coming years. Water resources have to be managed from the water basin to the irrigated crops, eventually reaching to smaller areas and users. Measuring the evapotranspiration is of the highest importance to understanding and eventually intervening into the water cycle of natural systems; especially in the water balance of the different critical users of water, such as irrigated areas. Remote sensing has been able, over the last 15 years, to provide methods for calculating the actual evapotranspiration (ETa) [1, 2].
meteorological data to integrate ETa and crop growth, respectively, between satellite image data from the Indus Basin of Pakistan.
Despite the technological advance of remote sensors and the ability to detect finer objects on the ground, higher accuracy is always desirable. Technological restrictions confine satellite design to high resolution but low revisit frequency, or else low resolution and high revisit frequency. A combination of both qualities would be preferable, and therefore, techniques to merge satellite images of different spatial resolutions have been developed. [6] have used an Intensity-Hue-Saturation (IHS) transformation to merge SPOT (Satellite Pour l’Observation de la Terre) panchromatic and Landsat multispectral satellite images, while [7] have used the same technique to merge airborne digital data with digitized aerial photography. Other techniques include the Principal Components transformation [8], and merging of the spatial frequency content [9]. Except for the need for spatial detail, another reason for this merge is that high resolution images are often costly, while low resolution are of low cost, or even are freely distributed. It is possible that remote sensing work can be performed using low-resolution satellite images that are later spatially enhanced using a high spatial resolution image.
In previously published work [10, 11], NOAA AVHRR (National Oceanographic and Atmospheric Administration – Advanced Very High Resolution Radiometer) images have provided a frequent source of data to calculate the volume of evapo-transpired water that has been consumed over a study area in central China, combining high resolution Landsat ETM+ images. The aim of this follow-up study is to use ALOS AVNIR-2 imagery to further improve the spatial distribution of estimated agricultural water use in a Greek river basin (up to 10m). Specific objectives are (i) to compare evapotranspiration estimates from methods based on thermal infrared imagery (such as SEBAL) with those based on AVNIR-2 imagery (such as the modified Penman-Monteith), and (ii) to merge the two datasets for improved results.
2. MATERIALS AND METHODS 2.1.Description of study area
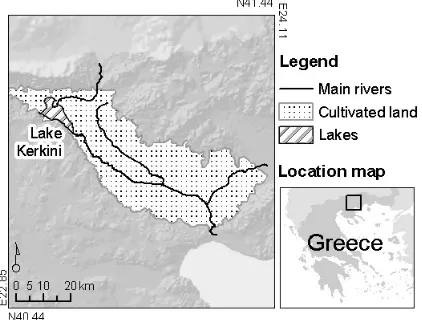
The study area is the Greek part of the Strimonas river basin (Fig. 1). The total basin of the trans-boundary river covers an area of 17,250 km2, with its upstream areas situated in Bulgaria (65% of total area). A large reservoir (artificial lake Kerkini) was constructed in the 1930's immediately upstream of the Strimonas plain in Greece, to store water for irrigation and to prevent flood events. With progressive drainage works, agricultural
land has been reclaimed from the wetlands and temporary lakes that had been dominating the floodplain of Strimonas. By the 1960’s, an extended irrigation system had been developed in the plain (the largest in Greece), which taps water from the reservoir and river diversion dams. Water is distributed mainly by open canals, which are predominantly lined but often badly maintained, thus with low conveyance efficiencies. Local groundwater pumping stations provide supplementary water to account for the inefficient operation of the irrigation system. The large quantities of drainage water are reused for irrigating downstream regions. The total irrigated area is estimated to exceed 800 km2, including the areas irrigated by privately operated pump wells (upper reaches). The main agricultural crops are irrigated maize, cotton, rice, beetroot, alfalfa, and rain-fed winter cereals. Agricultural and livestock production are the main economic activities in the site.
Artificial lake Kerkini has been recognised as a wetland of international importance (Ramsar site code 58, area 109.9 km2). It is also part of a Special Protected Area (site code GR1260008, area 277.1 km2) and a Site of Community Importance (site code GR1260001, area 783.2 km2). Due to the lake’s operation as an irrigation reservoir, its water level fluctuates by 5 m during the irrigation season (May to September) and its surface decreases from 75 km2 in spring to 50 km2 in early autumn. As a result, the riparian forest and other key wetland habitats have decreased drastically. It is a case of upstream ecosystems receiving the impact of downstream agricultural activities. Another Site of Community Importance (site code GR1260002, area 12.9 km2) is the Strimonas estuary, which suffers from low water quality due to agricultural drainage and low discharge during the irrigation season, which is not sufficient to sustain the coastal ecosystem.
2.2.Datasets used multispectral content (blue, green, red, near infrared, middle infrared, thermal infrared and short wave infrared bands), however at lower spatial resolution than the ALOS AVNIR-2 sensor: 30m (120m for the thermal band). The high spatial content of these satellite images was sufficient to cover the detailed cropping pattern of the study area. However, their cost was significantly high to prevent more acquisitions in the irrigation season.
Being based on archived data, the frequency of acquisition and archiving becomes an issue. Landsat TM images are collected and archived every 16 days, thus we had the opportunity to select a single image that covered the study area and was acquired in the peak of the irrigation season. However, few only ALOS AVNIR-2 images are made available every year. Taking into account that two ALOS AVNIR-2 images were required to cover the study area, those closest to the peak of the summer irrigation season were selected. The temporal content necessary to cover the irrigation season in the study area (from beginning of April to end of September) was provided by frequent, free of charge acquisitions from the Terra/MODIS sensor. Three Terra/MODIS products were required for the selected algorithms: Surface Reflectance (MOD09Q1 at 250 m and MOD09A1 at 500m resolution), Land Surface Temperature (LST) and Emissivity products (MOD11A2 at 1 km resolution). All products have a level 3 of processing and provide 8-day composite images. Altogether, 23 8-day composites products were downloaded using the Earth Observing System (EOS) data gateway of the Land Processes Distributed Active Archive Center (LP DAAC) (http://edcimswww.cr. usgs.gov/pub/imswelcome/).
Daily meteorological data were required to describe the fluctuation of evapotranspiration from day to day. These were Tmin and Tmax, daily solar radiation, and air temperature, wind speed and RH at the satellite overpass time acquired from three automatic meteorological stations located in the irrigated area. Due to the close location of the stations it was not possible to perform spatial interpolation, thus the readings were averaged and meteorological conditions were considered uniform across the study area.
2.3.Estimating agricultural water use with SEBAL The actual evapotranspiration (ETa) in the study area was calculated by applying the Surface Energy Balance Algorithm for Land (SEBAL) on the satellite images an output of SEBAL, and was calculated as:
0
where, Rnet is the instantaneous net radiation (W.m-2), G0 is the instantaneous soil heat flux (W.m-2), H is the instantaneous sensible heat flux (W.m-2) and λE is the instantaneous latent heat of vaporization (W.m-2). The underlying assumption is that the partitioning ratio is constant over the day, or said differently: the instantaneous partition of λE and H is equal to the average diurnal partitioning ratio. [13] considered the difference between Λ at the moment of satellite overpass and Λ derived from the 24-hour integrated energy balance as non significant.
λΕ was calculated based on Λ, multiplied by the diurnal net radiation at earth surface (Rnday), calculated spatially from the surface broadband albedo data (ρ0, calculated from the satellite images) and the single-way transmissivity of the atmosphere (τsw=0.75).
(
)
Moreover, the SEBAL algorithm has been initialised with a set of parameters that characterise the conditions at the meteorological stations: height of wind measurement (4m), wind speed at satellite overpass time (average value between stations), and vegetation height around the meteorological station (0.5m).
The suggested methods for ETa estimation on certain sample dates during the cropping season, give a very good indication of its spatial distribution, but cannot be used directly in water balance studies. The reason behind is the wide fluctuation of ETa from day to day, depending on meteorological conditions and availability of water. Therefore, in order to obtain an accurate estimation of the seasonal ETa, daily values have to be simulated.
for the time period between two consecutive satellite images, and the seasonal ETa (ETs) could be simulated with the following equation:
where tj and tj+1 delimit each 8-day period.
The above mentioned equation is using the time component (ETo) to calibrate the spatial component of ETa calculation (ETrF) in order to better describe the daily fluctuation, which is dependent on meteorological conditions. ETa also depends on the availability of water. Spatial variation of water availability can be described by the 8-day interval of the satellite images, which were assumed representative for each period. 2.4.Estimating agricultural water use with Kc
method
The crop coefficient methods (Kc) allow to derive the crop evapotranspiration (ETc) from the reference evapotranspiration (ETo) by using specific coefficients called crop coefficients (Kc) and water stress coefficient (Ks) using the below formula:
ETc = Kc ETo
ETo is based on the FAO 56 method [15], which is the approach recommended by the FAO for the estimation of the crop water requirements. It is based on the modified Penman-Monteith equation for the computation of the reference crop evapotranspiration (ETo). The crop evapotranspiration under standard conditions (ETc) is then obtained by multiplication of evaporation, and the crop growth stage [15]. Finally the ETcadj (for crop surfaces under non-standard conditions) is derived from ETc using a water stress coefficient (Ks). After temporal integration during the irrigation season, ETs can be derived. Required inputs are radiation, air temperature, air humidity and wind speed data collected from weather stations. The main advantage of this method is that it is considered as standard, thus it has been widely used leading to a subsequent availability of support material and results for comparison purposes.
However, this method is designed for the field scale. To extend its application on a river basin level, it can be combined with a crop distribution map, which would provide the required spatial distribution of Kc. In this work, the ALOS AVNIR-2 images were subjected to a
maximum likelihood spectral classification, using field surveyed training data. The resulting initial crop map was further refined using knowledge based classification and incorporating additional information layers, such as the outline of agricultural blocks, which are continuous portions of homogeneous land use, delimited by geographic irregularities, roads, or other elements of discontinuity, and identified on 1:5,000 scale photomaps [16]. Together with the CORINE Land Cover layer (scale 1:100,000), the agricultural blocks were used to define the boundary between agricultural and natural vegetation, which was finely interweaved because of the dense drainage network in the study area. The classes of the final crop map were assigned to ETs for each crop, which had been estimated using the FAO 56 method in a worksheet.
2.5.Resolution improvement
The spatial resolution of ETs-MODIS is limited by the resolution of the MODIS sensor (250-1000 m at nadir). Considering the detailed crop pattern in Greece and the interspersion of irrigated with non-irrigated fields towards the fringe of the irrigated area, it is suggested that higher resolution would be desirable. This can be achieved by merging high resolution data of similar content. In previous studies [10, 11] ETs estimated from NOAA AVHRR images (at 1.1 km resolution) were merged with a single day ETa estimated from a Landsat ETM+ image (30-60 m resolution) using the modified Brovey method. According to this method, the detailed pattern of the ETa map was used as a weight to spatially redistribute the ETs calculated for each 1.21 km2 pixel of the NOAA AVHRR satellite using the formula:
while in the case of ETa-Landsat the detailed pattern is based on the spatial distribution of a single day ETa.
3. RESULTS
In this work, the seasonal evapotranspiration estimated with the SEBAL method and a time series of Terra/MODIS images is considered as the closest approximation to the agricultural water use in the study area. Resolution improvement of this product using a single day Landsat ETa (estimated with SEBAL), carefully selected in the peak of the irrigation season, is considered as the closest approximation to the detailed pattern of agricultural water use on the field level. Using the methods described in the previous sections, similar products were estimated using ALOS AVNIR-2, and were compared against the MODIS and Landsat reference products for assessment.
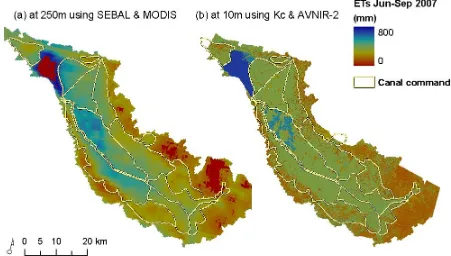
The seasonal evapotranspiration during the irrigation season (equivalent to agricultural water use) using the SEBAL method (with MODIS data) and the Kc method (and AVNIR-2 data) is displayed in Fig. 2. Visual assessment revealed that water consumption in several
parts of the irrigated land close to the lake and along the river were underestimated with ETs-ALOS. The two products were compared (a) on a pixel level, using a random dataset of 1000 points, and (b) on a canal command area level, using a vector dataset. Statistical comparison was performed with paired T-test and correlation analysis.
Pixel level comparison revealed that the mean difference between the two sampled datasets was statistically significant (mean difference of 24.62 mm, P<0.0001), and displayed low positive correlation (r = 0.59). Area based comparison of the canal command area level revealed that the mean difference between the two datasets was statistically significant (mean difference of 3436 Mm3, P=0.0411), but displayed a strong positive correlation (r = 0.98). These differences show that the ETs-ALOS method significantly underestimate the agricultural water use, however when averaged over canal command areas, they show a very similar pattern to the reference data. Therefore, the ETs-ALOS map was subsequently used only for improving the spatial resolution of the ETs-MODIS map.
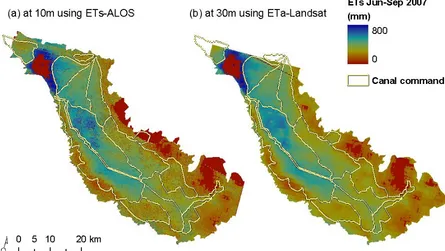
Figure 3. Resolution improved ETs-MODIS using ETs-ALOS at 10m (a), and ETa-Landsat at 30m (b). The resolution improvement of ETs produced by
MODIS using the detailed spatial pattern provided by ETs-ALOS and ETa-Landsat is displayed in Fig. 3. Visual assessment did not reveal any differences, and the two products were again compared on a pixel and on an area level.
Pixel level comparison revealed that the mean difference between the two sampled datasets was not statistically significant (mean difference of 2.34 mm, P=0.4013), and displayed strong positive correlation (r = 0.86). Area based comparison of the canal command area level revealed that the mean difference between the two datasets was not statistically significant (mean difference of 77 Mm3, P=0.7505, and displayed a very strong positive correlation (r = 0.99). These very low differences show that the spatial resolution of ETs produced by MODIS data can be improved using the ETs-ALOS or ETa-Landsat with comparable quality. Table 1. Total agricultural water use (ETs) in Strimon plain using various datasets for resolution improvement Resolution
improvement dataset
ETs (Mm3) pixel size (m)
original pixel size 422171 250
ETs-ALOS 416356 10
ETa-Landsat 409300 30
The total agricultural water use (ETs) in Strimon plain from June to September 2007, as estimated using
various datasets for resolution improvement is displayed in Table 1. Compared with the result produced at the original spatial resolution of MODIS, the resolution improvement using ETs-ALOS provided the closest estimate.
4. DISCUSSION AND LIMITATIONS: EVALUATION OF THE USEFULNESS OF ALOS DATA
In this work, the contribution of ALOS AVNIR-2 images to estimate agricultural water consumption was evaluated. The results were compared against similar products derived with Terra/MODIS and Landsat TM images, used as reference.
An estimate of ETs (seasonal evapotranspiration) using Kc methods and ALOS AVNIR-2 images was consistently underestimating the agricultural water use. The main reasons for this difference are:
factor was not considered due to the difficulty of its estimation at a large scale.
• Operational: The remote sensing with crop coefficient method is more laborious than the SEBAL method as it requires a detailed crop map (derived through spectral classification of satellite images). Especially if surrounding natural vegetation is to be considered, then the number of classes for the classification algorithm may be prohibiting, and specialized techniques might be required [17].
The improvement of spatial resolution of agricultural water use with ALOS AVNIR-2 images and the modified Brovey method was successful to provide the detailed spatial pattern needed for the study area. The result was comparable to the standard method using Landsat TM, and did not deviate from the original data. The main differences between the two efforts are:
• Methodological: The modified Brovey method is designed for continuous data (ETa and ETs maps). However, it was applied successfully using the ETs-ALOS, which is a thematic map, being a secondary product from the crop map. An expected problem is the appearance of abrupt changes basin. Similarly, ETs-ALOS maybe inaccurate in cases of misclassification in the crop distribution map. Also, if results are to be derived on a field level in Greek conditions, the medium spatial resolution of Landsat TM may not be sufficient, and the high resolution of ALOS AVNIR-2 may be preferable.
The results presented in this work allow water managers to assess more accurately the performance and the water balance of irrigation systems under operational conditions. Improvement of the water efficiency at different levels of water supply and distribution can find suitable support in such technique for planning processes. The enhanced information content at a low cost is very attractive for water managers and decision support system applications, especially in the sub-system level of irrigated areas where high resolution ET data is not spatially and temporally available simultaneously.
ACKNOWLEDGEMENTS
ALOS data were provided by the European Space Agency (ESA). The meteorological data were provided by the Water Directorate of the Region of Central
Macedonia. The work presented was supported by the extension of ESA's GSE-Land project in Greece.
REFERENCES
1. Vidal, A. & Perrier, A. (1989). Analysis of a simplified relation for estimating daily evapotranspiration from satellite thermal IR data.International Journal of Remote Sensing. 10(8), 1327-1337.
2. Bastiaanssen, W.G.M. (1998). Remote sensing in water resources management: The state of
the art. Colombo, Sri-Lanka: International
Water Management Institute. 118.
3. Droogers, P. & Bastiaanssen, W. (2002). Irrigation performance using hydrological and remote sensing modeling.Journal of Irrigation
and Drainage Engineering. 128(1), 11-18.
4. Bastiaanssen, W.G.M., Ahmad, M.U.D. & Chemin, Y. (2002). Satellite surveillance of evaporative depletion across the Indus Basin.
Water Resources Research. 38(12), 91-99.
5. Bastiaanssen, W.G.M. & Ali, S. (2003). A new crop yield forecasting model based on satellite measurements applied across the Indus Basin, Pakistan. Agriculture, Ecosystems and
Environment. 94(3), 321-340.
6. Welch, R. & Ehlers, M. (1987). MERGING MULTIRESOLUTION SPOT HRV AND LANDSAT TM DATA. Photogrammetric Engineering and Remote Sensing. 53(3), 301-303.
7. Ambrosia, V.G., Myers, J.S., Ekstrand, R.E. & Fitzgerald, M.T. (1991). Integration of airborne Thematic Mapper Simulator (TMS) data and digitized aerial photography via an ISH transformation. Geocarto International. 6(2), 45-48.
8. Chavez Jr, P.S., Sides, S.C. & Anderson, J.A. (1991). Comparison of three different methods to merge multiresolution and multispectral data: Landsat TM and SPOT panchromatic. Photogrammetric Engineering & Remote Sensing. 57(3), 295-303.
9. Schowengerdt, R.A. (1980). Reconstruction of multispatial, multispectral image data using spatial frequency content. Photogrammetric Engineering & Remote Sensing. 46(10), 1325-1334.
10. Chemin, Y. & Alexandridis, T. (2006). Water productivity at different geographical scales in Zhanghe Irrigation District, China. International Journal of Geoinformatics. 2(2), 9-19.
irrigated rice in Zhanghe, China. Asian J. Geoinf. 5(1), 3-11.
12. Bastiaanssen, W.G.M., Menenti, M., Feddes, R.A. & Holtslag, A.A.M. (1998). A remote sensing surface energy balance algorithm for land (SEBAL): 1. Formulation. Journal of
Hydrology. 212-213(1-4), 198-212.
13. Brutsaert, W. & Sugita, M. (1992). Application of self-preservation in the diurnal evolution of the surface energy budget to determine daily evaporation.Journal of Geophysical Research. 97(D17), 18,377-18,382.
14. Waters, R., Allen, R., Tasumi, M., Trezza, R. & Bastiaanssen, W.G.M. (2002). SEBAL (Surface Energy Balance Algorithms for Land): Advanced Training and Users Manual.
Idaho Department of Water Resources. p. 98. 15. Allen, R.G., Pereira, L.S., Raes, D. & Smith,
M. (1999). Crop evapotranspiration-guidelines for computing crop water requirements. FAO Irrig. and Drain. Paper No. 56.
16. Masson, J. (2002). Report of the JRC activities on Olive GIS in the 5 Member States (FR, GR, I, SP, PO). Annual report v1.2. Institute for the Protection and the Security of the Citizen, Joint Research Centre: Ispra, Italy. p. 38.