Buletin Statistik Bulanan
Monthly Statistical Bulletin
Economic Indicators
INDIKATOR
EKONOMI
BADAN PUSAT STATISTIK
Statistics Indonesia
Indeks Harga /
Price Indices
Keuangan /
Finance
Perbankan /
Banking
Penanaman Modal /
Investment
Produksi /
Production
Neraca Pembayaran dan Perdagangan Luar Negeri /
Balance of Payments and International Trade
Perhubungan /
Transportation
Hotel dan Pariwisata /
Hotel and Tourism
Pendapatan Nasional /
National Income
2015
Desember
December
Desember
December
ISSN 0126-2319
9 770126 231008
2015
Januari /
January
2015
INDIKATOR
EKONOMI
Statistics Indonesia Jl. dr. Sutomo No. 6-8 Jakarta 10710
Telp.: (021) 3841195, 3842508, 3810291-4, Fax.: (021) 3857046
Homepage: http://www.bps.go.id E-mail: [email protected]
Katalog/Catalog: 9201001
Economics Indicators Bulletins is a publication of BPS-Statistics Indonesia which
is published monthly. The first publication was established on January 1970 with
simple contains. In line with the current condition and data needed, this
publication was containing more various and actual data appropriate with the
demand.
Especially, this publication provide statistical that describe Indonesia Economic
Indicators. Economic aspect that is provide are; consumer price indices,
wholesale price indices, currency exchange, finances and banking, capital
investment, balance of payments, national income, export and import,
transportation, hotel and tourism, agriculture production and mineral production.
Indikator Ekonomi merupakan publikasi BPS yang diterbitkan setiap bulan.
Publikasi ini pertama kali terbit pada bulan Januari 1970 dengan isi yang masih
sederhana. Secara bertahap, seiring perkembangan keadaan dan kebutuhan,
publikasi ini menyajikan data yang semakin beragam untuk memenuhi tuntutan
yang ada.
Publikasi ini secara khusus menyajikan statistik yang merupakan indikator
ekonomi Indonesia. Aspek ekonomi yang disajikan antara lain: indeks harga
konsumen, indeks harga perdagangan besar, nilai tukar valuta, keuangan dan
perbankan, penanaman modal, neraca pembayaran, pendapatan nasional,
ekspor dan impor, perhubungan, perhotelan dan pariwisata, produksi pertanian,
serta produksi bahan tambang.
h
tt
p
:/
/ w
w
w
. b
p
s.
g
o
h
tt
p
:/
/ w
w
w
. b
p
s.
g
o
Buletin Statistik Bulanan
INDIKATOR EKONOMI
Desember 2015
Monthly Statistical Buletin
Economics Indikator
December 2015
ISSN.
0126-2319
No. Publikasi
/
Publication Number
: 07330.1603
Katalog
/
Catalog
: 9201001
Ukuran Buku
/
Book Size
: 29 x 21 cm
Jumlah Halaman
/
Total Pages
: xv
i
ii
+ 180
halaman
/
pages
Naskah
/
Manuscript
:
Badan Pusat Statistik
Statistic
s
Indonesia
Penyunting
/
Editor
:
Subdirektorat Indikator Statistik
Subdirectorate of Statistics Indicator
Gambar Kulit
/
Cover Design
:
Subdirektorat Publikasi Statistik
Subdirectorate of Statistical Publication
Diterbitkan oleh
/
Published by
:
©
Badan Pusat Statistik, Indonesia
©
Statistic
s
Indonesia
Dicetak oleh
/
Printed by
:
Badan Pusat Statistik
/
Statistic
s
Indonesia
Dilarang mengumumkan, mengomunikasikan, dan/atau menggandakan sebagian atau seluruh isi buku ini untuk tujuan
komersial tanpa izin tertulis dari Badan Pusat Statistik
Prohibitted to announce, distribute, communicate, and/or copy part or all of this book for commercial purposes without permission
from Statistics Indonesia
h
tt
p
:/
/ w
w
w
. b
p
s.
g
o
KATA PENGANTAR
Publikasi INDIKATOR EKONOMI merupakan publikasi bulanan Badan Pusat Statistik (BPS) yang terbit sejak bulan Januari 1970, yang terus mengalami
penyempurnaan secara bertahap. Publikasi ini berisi tabel-tabel yang memuat statistik ekonomi yang dibutuhkan para pemakai data untuk berbagai keperluan pengamatan
dan analisa ekonomi.
Data statistik yang disajikan dalam INDIKATOR EKONOMI dihimpun dan disiapkan oleh unit kerja-unit kerja yang ada di BPS, namun beberapa statistik diperoleh
dari instansi lain, seperti Bank Indonesia, Badan Koordinasi Penanaman Modal (BKPM), dan lain-lain.
Setelah mulai edisi Maret 1993, INDIKATOR EKONOMI dilengkapi dengan ulasan singkat tentang beberapa indikator ekonomi yang dianggap cukup menonjol,
maka mulai edisi Januari 2006, ulasan singkat sudah mencakup hampir seluruh sub bab yang ada.
Akhirnya, penghargaan dan ucapan terima kasih disampaikan kepada semua pihak yang telah memungkinkan tersusunnya publikasi INDIKATOR EKONOMI.
Kepada para pemakai publikasi ini diharapkan kritik dan saran yang bersifat konstruktif untuk penyempurnaan publikasi INDIKATOR EKONOMI, agar lebih
memudahkan para pemakai data untuk memperoleh gambaran umum mengenai perkembangan ekonomi Indonesia.
KEPALA BADAN PUSAT STATISTIK
Dr. Suryamin, M.Sc
h
tt
p
:/
/ w
w
w
. b
p
s.
g
o
P R E F A C E
ECONOMIC INDICATORS is a monthly publication issued by BPS – Statistics Indonesia since 1970, which has undergone gradual improvement. This publication
contains statistical economic data in the form of tables needed for economic observations and analyses.
ECONOMIC INDICATORS presents the statistical economic data collected and prepared by several divisions at BPS and other institutions such as Bank
Indonesia and the Capital Investment Coordinating Board (BKPM).
Since the March 1993 edition, ECONOMIC INDICATORS has been completed with highlights for several important indicators. And then, starting with the January
2006 edition, the highlights have covered almost all indicators presented.
Finally, appreciation and thanks are conveyed to all parties involved in preparing this publication.
Constructive critiques and suggestions are welcomed to improve this publication, in order for users to be able to get a general picture of the development of the
Indonesian economy easily.
The Director General of
BPS – Statistics Indonesia
Dr. Suryamin, M.Sc
h
tt
p
:/
/ w
w
w
. b
p
s.
g
o
DAFTAR ISI
Halaman
PRAKATA ... iii - iv
DAFTAR ISI ... v - xii
PENJELASAN ... xiii
ULASAN SINGKAT INDIKATOR EKONOMI ... xiv - xvii
I.
INDEKS HARGA
PENJELASAN TEKNIS ...1 - 3
1.1
Indeks Harga Konsumen Gabungan 82 Kota di Indonesia
(2012 = 100 )... 4
1.2
Indeks Harga Konsumen Gabungan 82 Kota di Indonesia dan
Perubahannya (2012 = 100) ...5 - 6
1.3
Laju Inflasi 82 Kota di Indonesia (2012 = 100) ... 7 - 10
1.4
Indeks Harga Konsumen di 82 Kota di Indonesia dan
Perubahannya (2012 = 100) ... 11 - 27
1.5.1 Rata-rata Harga Produsen Gabah Menurut Kualitas dan Observasi
Transaksi Tingkat Penggilingan di Indonesia ... 28
1.5.2 Indeks Harga Produsen dan Inflasi Harga Produsen Triwulanan
(2010=100) ... 29 - 32
1.6
Upah Nominal dan Riil Buruh Tani, Konstruksi, Potong Rambut Wanita
dan Pembantu Rumah Tangga di Indonesia, (Rupiah) (2007 =100) .... 33
1.7.1 Indeks Harga yang Diterima Petani (IT), Indeks Harga yang Dibayar
Petani (IB) dan Nilai Tukar Petani Tanaman Pangan (NTPP) Serta
Perubahannya (2012 = 100) ... 34
1.7.2 Indeks Harga yang Diterima Petani (IT), Indeks Harga yang Dibayar
Petani (IB) dan Nilai Tukar Petani Hortikultura (NTPH) Serta
Perubahannya (2012 = 100) ... 35
1.7.3 Indeks Harga yang Diterima Petani (IT), Indeks Harga yang Dibayar
Petani (IB) dan Nilai Tukar Petani Tanaman Perkebunan
Rakyat (NTPR) Serta Perubahannya (2012 = 100) ... 36
CONTENT
Page
PREFACE ... iii - iv
CONTENTS ... v - xii
EXPLANATION ... xiii
HIGHLIGHT OF ECONOMIC INDICATORS ... xiv - xvii
I.
PRICE INDICES
TECHNICAL NOTE ... 1 - 3
1.1
Composite Consumer Price Indices of 82 Cities in Indonesia
(2012 = 100) ... 4
1.2
Composite Consumer Price Indices of 82 Cities in Indonesia and
Their Changes (2012 = 100) ... 5 - 6
1.3
Inflation Rate of 82 Cities in Indonesia (2012 = 100) ... 7 - 10
1.4
Consumer Price Indices (CPI) for Each of the 82 Cities and Their
Changes (2012 = 100) ... . 11 - 27
1.5.1 Average Producer Price of Paddy by Quality and Number of
Transaction at Huller Level in Indonesia ... 28
1.5.2 Producer Price Indices and Inflation Quarterly (2010=100) ... 29 - 32
1.6
Real and Nominal Wage for Farmworker, Constraction Worker, Woman’s
Haircut and Household Servant in Indonesia, (Rupiahs) (2007 = 100) .. 33
1.7.1 Indices of Prices Received by Farmers, Indices of Prices Paid by
Farmers, and Food Crops Farmers’ Terms of Trade (FFTT) and Their
Changes, (2012 = 100) ... 34
1.7.2 Indices of Prices Received by Farmers, Indices of Prices Paid by
Farmers, and Horticulture Farmers’ Terms of Trade (HFTT) and Their
Changes, (2012 = 100) ... 35
1.7.3 Indices of Prices Received by Farmers, Indices of Prices Paid by
Farmers, and Smallholder Plantantion Estate Crops Farmers’ Terms of
Trade (SFTT) and Their Changes, (2012 = 100) ... 36
h
tt
p
:/
/ w
w
w
. b
p
s.
g
o
1.7.4 Indeks Harga yang Diterima Petani (IT), Indeks Harga yang Dibayar
Petani (IB) dan Nilai Tukar Petani Peternakan (NTPT) Serta
Perubahannya (2012 = 100) ...37
1.7.5 Indeks Harga yang Diterima Nelayan/Pembudidaya Ikan (IT), Indeks
Harga yang Dibayar Nelayan/Pembudidaya Ikan (IB) dan Nilai Tukar
Nelayan/Pembudidaya Ikan (NTNP) Serta Perubahannya
(2012 = 100) ...38
1.7.6 Indeks Harga Yang Diterima Nelayan (IT), Indeks Harga Yang Dibayar
Nelayan (IB) Dan Nilai Tukar Nelayan (NTN) Serta Perubahannya
(2012 = 100) ...39
1.7.7 Indeks Harga yang Diterima Pembudidaya Ikan (IT), Indeks Harga yang
Dibayar Pembudidaya Ikan (IB) dan Nilai Tukar Pembudidaya Ikan
(NTPI) Serta Perubahannya (2012 = 100) ...40
1.7.8 Indeks Harga yang Diterima Petani (It), Indeks Harga yang Dibayar Petani
(Ib) dan Nilai Tukar Petani (NTP) Serta Perubahannya (2012 = 100) ....41
1.7.9 Indeks Harga yang Diterima Petani (IT), Indeks Harga yang Dibayar
Petani (IB) dan Nilai Tukar Petani (Ntp) Tanpa Perikanan Serta
Perubahannya (2012 = 100) ...42
1.8.1 Indeks Harga yang Diterima Petani (IT), Indeks Harga yang Dibayar
Petani (IB) dan Nilai Tukar Petani Tanaman Pangan (NTPP) Menurut
Provinsi (2012 = 100) ... 43
1.8.2 Indeks Harga yang Diterima Petani (IT), Indeks Harga yang Dibayar
Petani (IB) dan Nilai Tukar Petani Hortikultura (NTPH) Menurut Provinsi
(2012 = 100) ...44
1.8.3 Indeks Harga yang Diterima Petani (IT), Indeks Harga yang Dibayar
Petani (IB) dan Nilai Tukar Petani Tanaman Perkebunan
Rakyat (NTPR) Menurut Provinsi (2012 = 100) ...45
1.8.4 Indeks Harga yang Diterima Petani (IT), Indeks Harga yang Dibayar
Petani (IB) dan Nilai Tukar Petani Peternakan (NTPT) Menurut Provinsi
(2012 = 100) ...46
1.7.4 Indices of Prices Received by Farmers, Indices of Prices Paid by
Farmers, and Animal Husbandry Farmers’ Terms of Trade (AFTT) and
Their Changes, (2012 = 100) ... 37
1.7.5 Indices Of Prices Received yy Fishermen/Fish Farmers, Indices Of Prices
Paid by Fishermen/Fish Farmers and Fishermen/Fish Farmers Terms Of
Trade (FTT) And Their Changes, (2012 = 100) ... 38
1.7.6 Indices Of Prices Received by Fishermen, Indices Of Prices Paid by
Fishermen and Fishermen Terms Of Trade (FTT) and Their Changes,
(2012 = 100) ... 39
1.7.7 Indices Of Prices Received by Fish Farmers, Indices Of Prices Paid by
Fish Farmers and Fish Farmers Terms Of Trade (FTT) and Their Changes
(2012 = 100) ... 40
1.7.8 Indices Of Prices Received by Farmers, Indices Of Prices Paid by
Farmers and Farmers' Terms Of Trade (FTT) and Their Changes,
(2012 = 100) ... 41
1.7.9 Indices Of Prices Received by Farmers, Indices Of Prices Paid by
Farmers and Farmers' Terms Of Trade (Ftt) Without Fishery and Their
Changes (2012 = 100) ... 42
1.8.1 Indices of Prices Received by Farmers, Indices of Prices Paid by
Farmers, and Food Crops Farmers’ Terms of Trade (FFTT)
by Province, (2012 = 100) ... 43
1.8.2 Indices of Prices Received by Farmers, Indices of Prices Paid by
Farmers, and Horticulture Farmers’ Terms of Trade (HFTT)
by Province, (2012 = 100) ... 44
1.8.3 Indices of Prices Received by Farmers, Indices of Prices Paid by
Farmers, and Smallholder Plantantion Estate Crops Farmers’
Terms of Trade (SFTT) by Province, (2012 = 100) ... 45
1.8.4 Indices Of Prices Received by Livestock, Indices Of Prices Paid by Live
Stock and Animal Husbandry Farmers' Terms Of Trade (Aftt) by
1.8.5 Indeks Harga yang Diterima Nelayan/Pembudidaya Ikan (IT), Indeks
Harga yang Dibayar Nelayan/Pembudidaya Ikan (Ib) dan Nilai Tukar
Nelayan/Pembudidaya Ikan (NTNP) Menurut Provinsi (2012 = 100)...47
1.8.6 Indeks Harga yang Diterima Nelayan (IT), Indeks Harga yang Dibayar
Nelayan (IB) dan Nilai Tukar Nelayan (NTN) Menurut Provinsi
(2012 = 100) ...48
1.8.7 Indeks Harga yang Diterima Pembudidaya Ikan (IT), Indeks Harga yang
Dibayar Pembudidaya Ikan (IB) dan Nilai Tukar Pembudidaya Ikan (NTPI)
Menurut Provinsi (2012 = 100) ...49
1.8.8 Indeks Harga yang Diterima Petani (IT), Indeks Harga yang Dibayar
Petani (IB) dan Nilai Tukar Petani (NTP) Menurut Provinsi
(2012 = 100) ...50
1.8.9 Indeks Harga yang Diterima Petani (IT), Indeks Harga yang Dibayar
Petani (IB) dan Nilai Tukar Petani (NTP) Tanpa Perikanan Menurut
Provinsi (2012 = 100) ...51
1.9
Indeks Harga Perdagangan Besar, Sektor Pertanian,
Pertambangan dan Penggalian (2010=100) ... ………..52
1.10 Indeks Harga Perdagangan Besar, Sektor Industri
(2010=100) ... 53 - 56
1.11 Indeks Harga Perdagangan Besar Kelompok Barang Impor,
(2010=100) ... 57 - 60
1.12 Indeks Harga Perdagangan Besar Kelompok Barang Ekspor
(2010=100) ... 61 - 64
1.13 Indeks Harga Perdagangan Besar (2010=100) ...65
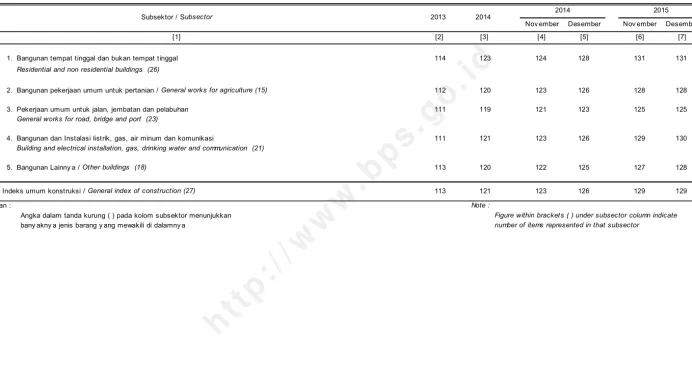
1.14 Indeks Harga Perdagangan Besar Bahan Bangunan/Konstruksi
Menurut Jenis Konstruksi/Bangunan, (2010=100) ...66
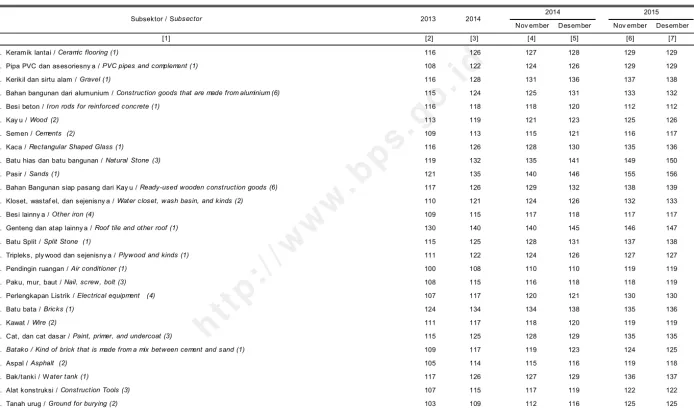
1.15 Indeks Harga Perdagangan Besar Bahan Bangunan/Konstruksi
Indonesia Menurut Kelompok Jenis Barang (2010=100) ...67
1.8.5 Indices Of Prices Received by Fishermen/Fish Farmers, Indices Of Prices
Paid by Fishermen/Fish Farmers and Fishermen/Fish Farmers Terms Of
Trade (Ftt) by Province, (2012 = 100) ... 47
1.8.6 Indices Of Prices Received by Fishermen, Indices Of Prices Paid by
Fishermen and Fishermen Terms Of Trade (Ftt) by Province,
(2012 = 100) ... 48
1.8.7 Indices Of Prices Received by Fish Farmers, Indices Of Prices Paid by
Fish Farmers and Fish Farmers Terms Of Trade (Ftt) by Province,
(2012 = 100) ... 49
1.8.8 Indices Of Prices Received by Farmers, Indices Of Prices Paid by
Farmers and Farmers' Terms Of Trade (Ftt) by Province,
(2012 = 100) ... 50
1.8.9 Indices Of Prices Received by Farmers, Indices Of Prices Paid by
Farmers and Farmers' Terms Of Trade (Ftt) Without Fishery by Province,
(2012 = 100) ... 51
1.9
Wholesale Price Indices, of Agricultural, Mining and Quarrying
Sectors (2010=100) ... 52
1.10
Wholesale Price Indices of Manufacturing Sector (2010=100) ... 53 - 56
1.11
Wholesale Price Indices of Import Commodities Group
(2010=100) ... 57 - 60
1.12
Wholesale Price Indices of Export Commodities Group
(2010=100) ... 61 - 64
1.13
Wholesale Price Indices, (2010=100) ... 65
1.14
Wholesale Price Indices of Construction Materials by Type
of Construction, (2010=100) ... 66
1.15 Wholesale Price Indices of Construction Materials of Indonesia
By Group of Commodities, (2010=100) ... 67
h
tt
p
:/
/ w
w
w
. b
p
s.
g
o
1.16 Perkembangan Harga Rata-rata Valuta Asing dan Emasdi Pasaran
Jakarta ...68
1.17 Perdagangan Saham di Bursa Efek Indonesia ... 69
II.
KEUANGAN
PENJELASAN TEKNIS ... 70
2.1
Realisasi Penerimaan Negara ...71
2.2
Realisasi Pengeluaran Negara ... 72
III.
PERBANKAN
PENJELASAN TEKNIS ... 73 - 74
3.1
Uang Beredar ... 75
3.2
Posisi Kredit Perbankan dalam Rupiah dan Valuta Asing Menurut
Sektor Ekonomi ... 76 - 77
3.3
Pemberian Kredit oleh Bank Kredit Desa dan Pegadaian Negara. ...78
3.4
Suku Bunga Kredit Rupiah Menurut Kelompok Bank ... 79
3.5
Posisi Kredit Investasi Perbankan dalam Rupiah dan Valuta Asing
Menurut Sektor Ekonomi ... 80
3.6
Suku Bunga Deposito Berjangka Bank Umum ... 81
IV.
PENANAMAN MODAL
PENJELASAN TEKNIS ... 82
4.1.1 Perkembangan Realisasi Investasi Penanaman Modal Dalam
Negeri Menurut Sektor Ekonomi... 83
4.1.2 Perkembangan Realisasi Investasi Penanaman Modal Dalam Negeri
Menurut Lokasi ...84
4.2.1 Perkembangan Realisasi Investasi Penanaman Modal Luar
Negeri Menurut Sektor Ekonomi... 85
1.16
Average Prices of Foreign Currencies and Gold in Jakarta Market. ... 68
1.17
Share Trading at the Indonesia Stock Exchange ... 69
II.
FINANCE
TECHNICAL NOTES ... 70
2.1
Actual Government Revenues ... 71
2.2
Actual Government Expenditures ... 72
III.
BANKING
TECHNICAL NOTES ... 73 - 74
3.1
Money Supply ... 75
3.2
Outstanding Bank Credits in Rupiah and Foreign Exchange by
Economic Sectors ... 76 - 77
3.3
Outstanding Credits by Village Credit Institution and Government
Pawnshops ... 78
3.4
Rupiah Credit Interest Rates By Group of Banks ... 79
3.5
Banks’ Outstanding Investment Credits in Rupiah and Foreign
Exchange by Economic Sectors ... 80
3.6
Commercial Banks’Interest Rates on Time Deposit ... 81
IV.
INVESTMENT
TECHNICAL NOTES ... 82
4.1.1 Statistic of Domestic Direct Investment Realization by Economic
Sector ... 83
4.1.2 Statistic of Domestic Direct Investment Realization by Location ... 84
4.2.1 Statistic of Foreign Direct Investment Realization by Economic
Sector ... 85
h
tt
p
:/
/ w
w
w
. b
p
s.
g
o
4.2.2 Perkembangan Realisasi Investasi Penanaman Modal Luar Negeri
Menurut Lokasi ...86
4.2.3 Perkembangan Realisasi Investasi Penanaman Modal Luar Negeri
Menurut Negara ...87
V.
PRODUKSI
PENJELASAN TEKNIS ... 88 - 90
5.1
Produksi Tanaman Bahan Makanan ...91
5.2
Produksi dan Persediaan Tanaman Perkebunan Besar ...92
5.3.A Indeks Produksi Bulanan Industri Besar dan Sedang (2010=100) ...93
5.3.B Indeks Produksi Triwulanan dari Kelompok Industri Besar dan
Sedang (2010=100) ... 94 - 95
5.4.1 Produksi Bulanan 8 Bahan Tambang di Indonesia ...96
5.4.2 Indeks Produksi Bulanan 8 Bahan Tambang di Indonesia
(2010=100) ...97
5.5
Produksi Minyak Mentah (Termasuk Kondensat) dan Gas ...98
5.6.1 Indeks dan Pertumbuhan Pekerja Tetap, Hari Orang, Balas Jasa dan
Upah, serta Nilai Konstruksi yang Diselesaikan ...99
5.6.2 Indeks dan Pertumbuhan Pekerja Tetap, Hari Orang, Balas Jasa dan
Upah, serta Nilai Konstruksi yang Diselesaikan Menurut Provinsi ... 100
VI.
NERACA PEMBAYARAN DAN PERDAGANGAN LUAR NEGERI
PENJELASAN TEKNIS ... 101 - 102
6.1
Neraca Pembayaran ... 103
6.2
Neraca Perdagangan Barang Migas dan Non Migas ...104
6.3
Nilai Ekspor Menurut Golongan Barang SITC ... 105
6.4.1 Ekspor Hasil Pertanian (nilai) ... 106 - 107
4.2.2 Statistic of Foreign Direct Investment Realization by Location ... 86
4.2.3 Statistic of Foreign Direct Investment Realization by Country ... 87
V.
PRODUCTION
TECHNICAL NOTES ... 88 - 90
5.1
Production of Food Crops ... 91
5.2
Production and Stocks of Estate Crops ... 92
5.3.A Monthly Production Indices of Large and Medium Manufacturing
Industry (2010=100) ... 93
5.3.B Quarterly Production Indices of Large and Medium Manufacturing
Industry (2010=100) ... 94 - 95
5.4.1 Monthly Production of 8 Minerals in Indonesia ... 96
5.4.2 Monthly Production Indices of 8 Minerals in Indonesia(2010=100) ... 97
5.5
Crude Petroleum (Including Condensate) and Gas Production ... 98
5.6.1 Indices and Growth of Permanent Workers, Mandays, Compensation and
Wages, and Value of Construction Completed ... 99
5.6.2 Indices of Permanent Workers, Mandays, Compensation and Wages, and
Value of Construction Completed buy Province ... 100
VI.
BALANCE OF PAYMENTS AND INTERNATIONAL TRADE
TECHNICAL NOTES ... ..101 - 102
6.1
Balance of Payments ... .103
6.2
Balance of Trade of Oil & Gas and Non-Oil & Gas ... 104
6.3
Exports Value by SITC Commodity Groups ... 105
6.4.1 Exports of Agricultural Products (value) ... 106 - 107
h
tt
p
:/
/ w
w
w
. b
p
s.
g
o
6.4.2 Ekspor Hasil Pertanian (berat bersih)... 108 - 109
6.5.1 Ekspor Hasil Industri (nilai) ... 110 - 111
6.5.2 Ekspor Hasil Industri (berat bersih) ... 112 - 113
6.6.1 Ekspor Hasil Tambang, Tidak Termasuk Migas (nilai) ... 114
6.6.2 Ekspor Hasil Tambang, Tidak Termasuk Migas (berat bersih) ... 115
6.7
Ringkasan Ekspor Indonesia (nilai)... 116
6.8.1 Ekspor Menurut Negara Tujuan... 117
6.8.2 Nilai Ekspor Non Migas dan Migas Menurut Negara Tujuan ... 118 - 119
6.9.1 Ekspor Menurut Pelabuhan Penting... 120
6.9.2 Nilai Ekspor Non Migas&Migas Menurut Pelabuhan Penting ... 121 - 122
6.10 Nilai Ekspor Menurut Kelompok Komoditi Primer dan Bukan Primer . 123
6.11 Nilai Impor Menurut Golongan Barang SITC ... 124
6.12.1 Nilai Impor Menurut Negara Asal ... 125
6.12.2 Nilai Impor Non Migas dan Migas Menurut Negara Asal... 126 - 127
6.13.1 Nilai Impor Menurut Pelabuhan Penting ... 128
6.13.2 Nilai Impor Non Migas & Migas Menurut Pelabuhan Bongkar ... 129 -130
6.14 Nilai Impor Menurut Golongan Barang Ekonomi ... 131
6.15 Nilai Impor Barang Barang Konsumsi ... 132
6.16 Nilai Impor Bahan Baku dan Penolong ... 133
6.17 Nilai Impor Barang Barang Modal ... 134
6.4.2 Exports of Agricultural Products (net weight) ... 108 - 109
6.5.1 Exports of Industrial Products (value) ... 110 - 111
6.5.2 Exports of Industrial Products (net weight) ... 112 - 113
6.6.1 Exports of Mining Products, Excluding Petroleum&Gas (value) ... 114
6.6.2 Exports of Mining Products, Excluding Petroleum and Gas
(net weight) ... 115
6.7
Summary of Indonesian Exports (value) ... 116
6.8.1 Exports Value by Country of Destination ... 117
6.8.2 Exports Value of Non Oil&Gas and Oil&Gas by Country of
Destination ... 118 - 119
6.9.1 Exports Value by Main Ports ... 120
6.9.2 Exports Value of Non Oil&Gas ann Oil&Gas by Main Ports ... 121 - 122
6.10
Exports Value by Primary and Non Primary CommodityGroups ... 123
6.11
Imports Value by SITC Commodity Groups ... 124
6.12.1 Imports Value by Country of Origin ... 125
6.12.2 Imports Value of Non Oil&Gas and Oil&Gas by Country of
Origin ... 126 - 127
6.13.1 Imports Value by Main Ports ... 128
6.13.2 Imports Value of Non Oil&Gas and Oil&Gas by and Main Ports .. 129 - 130
6.14
Imports Value by Broad Economic Categories ... 131
6.15
Imports Value of Consumption Goods ... 132
6.16
Imports Value of Raw Materials and Auxiliary Goods ... 133
6.17
Imports Value of Capital Goods ... 134
h
tt
p
:/
/ w
w
w
. b
p
s.
g
o
VII.
PERHUBUNGAN
PENJELASAN TEKNIS ... 135
7.1.1 Bongkar/Muat Barang Angkutan Antar Pulau di 4 Pelabuhan
Utama ... 136
7.1.2 Bongkar/Muat Barang Angkutan Luar Negeri di 4 Pelabuhan
Utama ... 137
7.2.1 Lalu Lintas Penumpang Angkutan Udara Dalam Negeridi 5
Pelabuhan Udara Utama ... 138
7.2.2 Bongkar/Muat Barang Angkutan Udara Dalam Negeridi 5
Pelabuhan Udara Utama ... 139
7.2.3 Lalu Lintas Penumpang Angkutan Udara Luar Negeridi 4
Pelabuhan Udara Utama ... 140
7.2.4 Bongkar/Muat Barang Angkutan Udara Luar Negeridi 4
Pelabuhan Udara Utama ... 141
7.2.5 Lalu Lintas Udara Penerbangan Dalam Negeri ... 142
7.2.6 Lalu Lintas Udara Penerbangan Luar Negeri ... 143
7.3
Produksi Angkutan Kereta Api ... 144
7.4
Jumlah Penumpang dan Barang yang Diangkut Menurut Jenis
Angkutan Dalam Negeri ... 145
VIII.
HOTEL DAN PARIWISATA
PENJELASAN TEKNIS ... 146
8.1.1 Tingkat Penghunian Kamar pada Hotel Berbintangdi 27
Provinsi Daerah Tujuan Wisata, ... 147
8.1.2 Tingkat Penghunian Kamar pada Hotel Berbintangdi Provinsi Lainnya148
8.1.3 Tingkat Penghunian Kamar pada Hotel Tidak Berbintang ... 149
VII.
TRANSPORTATION
TECHNICAL NOTES ... 135
7.1.1 Volume of Inter-Island Cargo Loaded/Unloaded at 4 MainSea
Ports ... 136
7.1.2 Volume of International Cargo Loaded/Unloaded at 4 MainSea
Ports ... 137
7.2.1 Domestic Aircraft Passengers Traffic at 5 Main Airports ... 138
7.2.2 Volume of Domestic Aircraft Cargo Loaded/Unloaded at 5 Main
Airports ... 139
7.2.3 International Aircraft Passengers Traffic at 4 Main Airports ... 140
7.2.4 Volume of International Aircraft Loaded/Unloaded at 4 Main
Airports ... 141
7.2.5 Domestic Aircraft Traffic ... 142
7.2.6 International Aircraft Traffic ... 143
7.3
Production of Railways ... 144
7.4
Number of Passenger and Freigth by Domestic Cargo ... 145
VIII.
HOTEL AND TOURISM
TECHNICAL NOTES ... 146
8.1.1 Room Occupancy Rate of Classified Hotels in 27 Provinces
of Main Tourist Destination , ... 147
8.1.2 Room Occupancy Rate of Classified Hotels inOther Provinces ... 148
8.1.3 Room Occupancy Rate of Non Classified Hotels ... 149
h
tt
p
:/
/ w
w
w
. b
p
s.
g
o
8.2.1 Rata rata Lama Menginap Tamu Asing dan Tamu Dalam Negeripada
Hotel Berbintang di 27 Provinsi Daerah TujuanWisata, ... 150
8.2.2 Rata rata Lama Menginap Tamu Asing dan Tamu DalamNegeri pada
Hotel Berbintang di Provinsi Lainnya ... 151
8.2.3 Rata rata Lama Menginap Tamu Asing dan Tamu DalamNegeri pada
Hotel Tidak Berbintang... 152
8.3.1 Rata rata Lama Menginap Tamu Asing pada Hotel Berbintang
di 27 Provinsi Daerah Tujuan Wisata ... 153
8.3.2 Rata rata Lama Menginap Tamu Asing pada Hotel Berbintang
di Provinsi Lainnya ... 154
8.4
Jumlah Wisatawan Asing yang Datang Melalui 19 Pintu Masuk
Utama... 155 - 156
IX. PENDAPATAN NASIONAL
9.1
Produk Domestik Bruto Triwulanan Atas Dasar HargaBerlaku
Menurut Lapangan Usaha ... 157 - 165
9.2
Produk Domestik Bruto Triwulanan Atas Dasar Harga
Konstan 2010 Menurut Lapangan Usaha ... 166 - 174
9.3
Produk Domestik Bruto Triwulanan Atas Dasar Harga Berlaku
Menurut Pengeluaran ... 175 - 177
9.4
Produk Domestik Bruto Triwulanan Atas Dasar Harga Konstan 2010
Menurut Pengeluaran ... 178 - 180
8.2.1 Average Length of Stay of Foreign and Domestic Guest atClassified
Hotels in 27 Provinces of Main TouristDestination, ... 150
8.2.2 Average Length of Stay of Foreign and DomesticGuests at
Classified Hotels in Other Provinces ... 151
8.2.3 Average Length of Stay of Foreign and DomesticGuests at Non
Classified Hotels ... 152
8.3.1 Average Length of Stay of Foreign Guests at Classified Hotels
in 27 Provinces of Main Tourist Destination Provinces, ... 153
8.3.2 Average Length of Stay of Foreign Guests at ClassifiedHotels
in Other Provinces ... 154
8.4
Number of Foreign Tourist Arrivals Through 19 MainPort of
Entry ... 155 - 156
IX.
NATIONAL INCOME
9.1
Quarterly Gross Domestic Product At Current MarketPrices
By Industrial Origin ... 157 - 165
9.2
Quarterly Gross Domestic Product At 2010 Constant Market
Prices By Industrial Origin ... 166 - 174
9.3
Quarterly Gross Domestic Product At Current MarketPrices
By Type of Expenditure ... 175 - 177
9.4
Quarterly Gross Domestic Product At 2010 Constant Market
Prices By Type of Expenditure ... 178 - 180
h
tt
p
:/
/ w
w
w
. b
p
s.
g
o
PENJELASAN xxx) Angka sangat-sangat sementara r) Angka diperbaiki
Batang (untuk sabun : 400 gram) Botol = 700 cc
Liter = 0,80 kg (untuk beras) Long ton = 1016,05 kg Lusin
1
mcf = ————— m3
35,3 Meter (m)
Metrik ton = 0,98421 long ton = 1000 kg Ounce (oz) = 28,31 gr
FOB = Harga untuk Ekspor CIF = Harga untuk Impor
EXPLANATION
SYMBOLS :
... Data not yet available Data not available Long ton = 1016.05 kg Dozen
1
mcf = ————— m3
35.3 Metre (m)
ULASAN SINGKAT INDIKATOR EKONOMI, DESEMBER 2015
Pada Desember 2015 terjadi inflasi sebesar 0,96 persen. Sementara itu
pada Desember 2014 terjadi inflasi sebesar 2,46 persen. Pada bulan ini semua
kelompok mengalami kenaikan indeks harga. Kelompok Makanan (3,20 persen),
Kelompok Makanan Jadi, Minuman, Rokok Dan
Tembakau (0,50 persen), Kelompok Transportasi,
Komunikasi & Jasa Keuangan (0,45 persen),
Kelompok Perumahan, Air, Listrik, Gas Dan Bahan
Bakar (0,40 persen), Kelompok Kesehatan (0,24
persen), Kelompok Sandang (0,09 persen) serta
Kelompok Pendidikan, Rekreasi, Dan Olahraga
(0,06 persen).
Uang yang beredar pada bulan Desember
2015 mencapai Rp 1 055,29 triliun dengan
komposisi 44 persen uang kartal dan 56 persen
uang giral. Jumlah tersebut mengalami kenaikan
sebesar 0,39 persen dibanding jumlah uang
beredar pada bulan sebelumnya. Uang kartal
mengalami kenaikan sebesar 7,22 persen dan
uang giral turun sebesar 4,49 persen. Sementara
jika dibandingkan Desember 2014, jumlah uang
yang beredar mengalami kenaikan sebesar 12,00
persen, kenaikan sebesar 11,95 persen pada uang
kartal dan kenaikan sebesar 12,04 persen pada
uang giral.
Indeks Nilai Tukar Petani (NTP) sebagai perbandingan antara Indeks Harga
yang Diterima Petani dengan Indeks Harga yang Dibayar Petani. Mulai Desember
2013, NTP menggunakan Tahun Dasar 2012=100. Pada Desember 2015, dari 33
provinsi yang disurvei tercatat sebanyak 18 provinsi memiliki NTP di atas angka
100, sedangkan 15 provinsi memiliki NTP di bawah angka 100. NTP tertinggi
tercatat di Provinsi Banten dengan nilai NTP sebesar 107,5 sedangkan NTP
terendah berada di Provinsi Bengkulu dengan NTP sebesar 93,0.
Pada Triwulan III tahun 2015 ada 1 175 Proyek Penanaman Modal Dalam
Negeri (PMDN) yang telah direalisasikan dengan nilai investasi Rp 47,83 triliun.
Investasi PMDN tersebut sebagian besar terserap pada Sektor Perindustrian
ECONOMIC INDICATOR HIGHLIGHTS, DECEMBER 2015
In December 2015 it was recorded inflation of 0.96 percent. Meanwhile in December
2014, inflation was recorded at 2.46 percent. At this month all groups experienced an
increase in the price index. Foodstuff Groups (3.20 percent), Prepared Food, Beverage,
Cigarette And Tobacco Groups (0.50
percent), Transportation,Communication &
Financial Services Groups (0.45 percent),
Housing, Water, Electricity, Gas And Fuel
Groups (0.40 percent), Health Groups (0.24
percent), Clothing Groups (0.09 percent) and
Education, Recreation And Sports Groups
(0.06 percent).
The money supply in December
2015 reached Rp 1,055.29 trillion, of which
44 percent was in currency outside banks
and 56 percent in demand deposits. That
amount increased by 0.39 percent
compared with the total money supply in
the previous month. Currency outside
banks increased by 7.22 percent and
deman deposits outside banks was
decreased by 4.49 percent. When compared
to December 2014, the money supply
experienced an increased 12.00 percent as
a result of the increased of currency outside banks 11.95 percent, and demand deposits
increased 12.04 percent.
The Farmers’ Terms of Trade (FTT) index, is the comparison between the index of
Producer Prices Received by Farmers to the index of Consumer Prices Paid by Farmers.
Since December 2013, FTT index using base year 2012=100. In December 2015, among
33 provinces, 18 provinces have FTT index beyond 100, while 15 provinces with the FTT
index below 100. The highest FTT Index recorded at Banten (107.5), meanwhile the
lowest FTT Index recorded at Bengkulu (93.0).
In third Quarter 2015 there were 1,175 Domestic Investment Projects (DIP)
realizations with an investment value of Rp 47.83 trillion. This investment was dominated
by the Manufacturing Sector (41.92 percent), than followed by Transport, Storages and
-0.4
Des'14Jan'15Feb'15Mar'15Apr'15Mei'15Juni'15Juli'15Agt'15Sep'15Okt'15Nov'15Des'15
Grafik 1. Laju Inflasi di Indonesia
Inflation Rate in Indonesia
(2012 = 100)
Inflation Rate in Indonesia
(2012 = 100)
Inflation Rate in Indonesia
(2012 = 100)
Inflation Rate in Indonesia
(2012 = 100)
Inflation Rate in Indonesia
(2012 = 100)
Inflation Rate in Indonesia
(2012 = 100)
Inflation Rate in Indonesia
(2012 = 100)
Inflation Rate in Indonesia
(2012 = 100)
Inflation Rate in Indonesia
Communication Sector (22.46 percent) and the Electricity, Gas and Water Sector
(12.19 percent). Meanwhile, in the same periode Foreign Investment Projects (FIP)
realizations were 4,310 projects with an investment value of 7.40 billion USD. This
investment mostly funded by Singapore a totalling 734 projects with an investment
value of 1.25 billion USD. This investment totally dominated by the Manufacturing
Sector (42.50 percent), then followed by Electricity, Gas and Water Sector at 14.39
and Minning and Quarrying Sector at 12.26
percent.
Based on second forecast figures
2015, paddy production in third subround
2015, was 16.22 million tons, with the
composition of 99.30 percent for wetland
paddy and 0.70 percent for dryland paddy. It
decreased by 1.85 percent by when compared
to second subround 2014. Meanwhile, paddy
production during 2015 was 74.99 million tons
or a higher 5.85 percent than paddy production
in 2014, which was 70.85 million tons.
The monthly Production Index of Large and Medium Manufacturing Industry
in Dectember 2015 was estimated to have decreased by 1.89 percent from the
previous month to 126.22. Meanwhile, this index increased by 1.02 percent
compared to the monthly production index in Dectember 2014. While, quartery
Production Index of Large and Medium Manufacturing Industry in fourth quarter
2015 was estimated increased by 1.69 percent compared with the previous quarter.
This was caused by the decreased in the efficiency of some subsectors, Manufacture
of leather and related products and footwear (7.66 percent), Manufacture of other
non-metallic mineral products (5.81 percent), and Manufacture of fabricated metal
products, excepts machinery and equipment (5.62 percent).
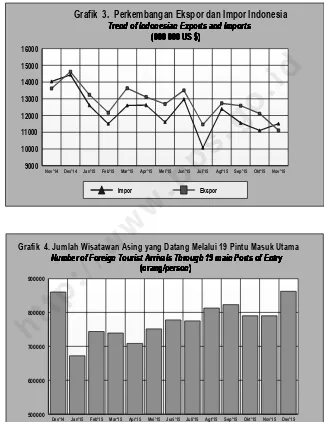
Export in October 2015, including and excluding petroleum and gas was
recorded 11.11 billion US dollars and 9.61 billion US dollars respectively, while the
(41,92 persen); diikuti oleh Sektor Transpor, Pergudangan dan Komunikasi serta
Sektor Listrik, Gas dan Air masing-masing mampu menyerap sebesar yaitu 22,46
persen dan 12,19 persen. Sementara itu pada periode yang sama, proyek
Penanaman Modal Asing (PMA) yang direalisasikan berjumlah 4 310 proyek dengan
nilai investasi 7,40 miliar US dolar. Investasi PMA tersebut paling banyak berasal
dari Singapura, dengan total proyek 734 senilai 1,25 miliar US dolar. Jika dilihat
secara sektoral, PMA tersebut didominasi oleh
Sektor Perindustrian (42,50 persen), kemudian
diikuti oleh Sektor Listrik, Gas dan Air serta Sektor
Pertambangan dan Penggalian masing-masing
mempunyai kontribusi sebesar 14,39 persen dan
12,26 persen.
Berdasarkan angka ramalan II 2015,
produksi padi pada subround III 2015 mencapai
16,22 juta ton, dengan komposisi 99,30 persen
padi sawah dan 0,70 persen padi ladang. Jika
dibandingkan periode yang sama pada tahun
sebelumnya, produksi padi pada subround III-2014
turun sekitar 1,85 persen. Sementara produksi
padi selama tahun 2015 sebesar 74,99 juta ton
atau lebih tinggi 5,85 persen jika dibanding
produksi padi selama tahun 2014 sebesar 70,85
juta ton.
Indeks Produksi Bulanan Industri Besar dan Sedang pada Desember 2015
diperkirakan turun 1,89 persen dari indeks bulan sebelumnya menjadi 126,22.
Jika dibanding Indeks produksi pada Desember 2014, indeks tersebut naik sebesar
1,02 persen. Sementara Indeks Produksi Industri Besar dan Sedang pada
triwulan IV-2015 diperkirakan naik 1,69 persen dibanding triwulan sebelumnya.
Hal ini disebabkah oleh naiknya kinerja sebagian besar subsektor, terutama
Industri Kulit, Barang dari Kulit dan Alas Kaki (7,66 persen), Industri Barang Galian
Bukan Logam (5,81 persen) dan Industri Barang Logam, Bukan Mesin dan
Peralatannya (5,62 persen) .
Ekspor termasuk migas dan tanpa migas November 2015 masing-masing
bernilai 11,11 miliar US dolar dan 9,61 miliar US dolar, sedangkan impor
masing--1000000
Padi Jagung Kedelai Kacang Tanah Ubi Kayu Ubi Jalar
Jan - Apr 2015 Mei - Agt 2015 Sep - Des 2015 Production of Food Crop
(ton) Production of Food Crop
(ton) Production of Food Crop
(ton) Production of Food Crop
(ton) Production of Food Crop
(ton) Production of Food Crop
(ton) Production of Food Crop
(ton) Production of Food Crop
(ton) Production of Food Crop
(ton)
Rice MaizeMaizeMaizeMaizeMaizeMaizeMaizeMaizeMaizeMaizeMaizeMaizeMaizeMaizeMaizeMaizeMaizeMaizeMaizeMaizeMaizeMaizeMaizeMaizeMaizeMaizeMaizeMaize CassavaCassavaCassavaCassavaCassavaCassavaCassavaCassavaCassavaCassavaCassava Sweet PotatoesSweet Potatoes
Rice Maize Cassava Sweet Potatoes Peanuts Soyabeans
Catatan: Data merupakan Angka Ramalan I 2015 Note : The figures was First Forast Figures 2015 Catatan: Data merupakan Angka Ramalan I 2015 Note : The figures was First Forast Figures 2015
Grafik 2. Produksi Tanaman Bahan Makanan Grafik 2. Produksi Tanaman Bahan Makanan Grafik 2. Produksi Tanaman Bahan Makanan Grafik 2. Produksi Tanaman Bahan Makanan Grafik 2. Produksi Tanaman Bahan Makanan Grafik 2. Produksi Tanaman Bahan Makanan Grafik 2. Produksi Tanaman Bahan Makanan Grafik 2. Produksi Tanaman Bahan Makanan Grafik 2. Produksi Tanaman Bahan Makanan
masing bernilai 11,52 miliar US dolar dan 9,88
miliar US dolar (Grafik 3). Dengan demikian
neraca perdagangan luar negeri November 2015
termasuk migas mengalami defisit 0,41 miliar
US dolar, dan tanpa migas mengalami defisit
0,26 miliar US dolar. Dibanding nilai ekspor
November 2014, nilai ekspor dengan migas turun
17,97 persen. Begitu juga dengan ekspor tanpa
migas yang mengalami penurunan sekitar 16,47
persen. Berdasarkan negara tujuan, negara
utama tujuan ekspor non migas pada November
2015 adalah Amerika Serikat (1,15 miliar US
dolar), Tiongkok (1,03 miliar US dolar) dan
Jepang (0,99 miliar US dolar). Sementara itu, nilai
impor termasuk migas pada November 2015
turun sekitar 17,96 persen dan impor tanpa
migas juga turun sekitar 6,52 persen dibanding
November 2014. Impor Oktober 2015 masih
didominasi oleh impor bahan baku senilai
8,52 miliar US dolar yang turun sekitar 20,61
persen dibanding impor barang yang sama pada
November 2014 senilai 10,74 miliar US dolar.
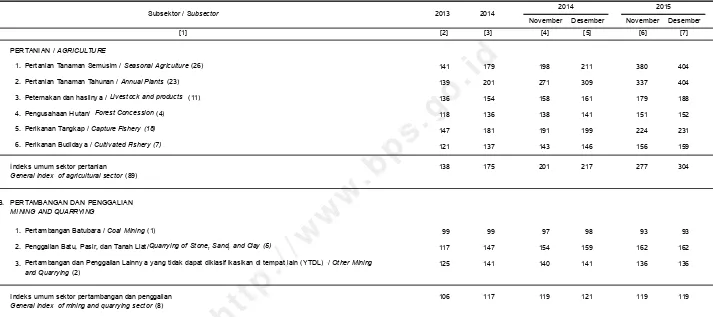
Wisatawan mancanegara (wisman) yang
datang melalui 19 pintu masuk utama pada
Desember 2015 berjumlah 862.556 orang.
Jumlah ini mengalami penurunan dari wisman
yang masuk pada bulan sebelumnya yang
berjumlah 723.069 orang (Grafik 4). Peningkatan
jumlah wisman terjadi di 12 pintu masuk utama.
Sementara itu, jika dibandingkan dengan seluruh
jumlah wisman yang masuk pada Desember
respective import figures were 11.52 billion US
dollars and 9.88 billion US dollars (Chart 3).
Therefore, the Balance of trade for November
2015 including petroleum and gas experienced
a deficit 0.41 billion US dollars, where as the
value without petroleum and gas was deficit of
0.26 billion US dollars. Compared with the
value of exports in November 2014, the value
of these exports with petroleum and gas
decreased by 17.97 percent. And exports
without petroleum and gas decreased by
16.47 percent. The main countries of export
without petroleum and gas destination in
November 2015 were U.S.A (1.15 billion US
dollars), China (1.03 billion US dollars) and
Japan (0.99 billion US dollars). Meanwhile, the
value of imports including petroleum and gas
in November 2015 decreased 17.96 percent,
and without petroleum and gas it also
decreased 6.52 percent compared with the
value import in November 2014. Imports in
November 2015 were still dominated by raw
materials at 8.52 billion US dollars, which
decreased by 20.61 percent compared with the
import of the same goods in November 2014,
which was 10.74 billion US dollars.
International tourists arrived via 19 main
entry ports in December 2015 were
862,556
people. This total decreased from the total
entering during the preceding month, which
was
723,069
people (Chart 4). The increase in
international tourists who entered in that
month compared with the previous month
occurred at 12 main ports of entry. While,
compared with the total entering international
9000Nov'14 Des'14 Jan'15 Feb'15 Mar'15 Apr'15 Mei'15 Jun'15 Jul'15 Agt'15 Sep'15 Okt'15 Nov'15
Impor Ekspor
Grafik 3. Perkembangan Ekspor dan Impor Indonesia
Trend of Indonesian Exports and Imports
Des'14 Jan'15 Feb'15 Mar'15 Apr'15 Mei'15 Juni'15 Juli'15 Agt'15 Sep'15 Okt'15 Nov'15 Des'15