Accounting Fundamentals and Variations of Stock Price:
Investment Scalability Inducement
#Zaki Baridwan, Slamet Sugiri, Jogiyanto Hartono M.,
Sumiyana
University of Gadjah Mada
Abstract
This study develops a new return model in relationship with accounting fundamentals. The new return model is based on Chen and Zhang (2007). This study induces investment scalability information. Specifically, this
study splits scale of firm’s operation into short-run and long-run investment scalabilities. This study documents that five accounting fundamentals could explain variations of annual stock return. The factors, consist of book value, earnings yield, short-run and long-run investment scalabilities, and growth opportunities vary positively with stock price movements. The remaining factor, pure of interest rate relates to annual stock return negatively. This study finds that inducing short-run and long-run investment scalabilities into the model could improve association degree, in other words they have value relevance. Finally, this study suggests that basic trading strategies would be better if investors revert to accounting fundamentals.
Keywords: earnings yield, book value, short-run and long-run investment scalabilities, growth opportunities, accounting fundamentals, value relevance, trading strategy.
1. Introduction
Chen and Zhang (2007) present the latest return model that relates fundamental firm value and variations of stock price. It also provides theory and empirical evidences that stock return is a function of accounting variables, namely earnings yield, equity capital, changes of profitability, growth opportunities, and discount rates. Chen and Zhang (2007) argued that firm’s value contains the potential future assets and growth opportunities. This argument is supported by Miller and Modigliani (1961). In simple explanation, both studies infer that stock price is a function of future assets or capital scalability.1 Earnings could be determined by adaptation concept when the firm’s invested resources are modifiable to generate future earnings (Wright, 1967).
The association between stock return and fundamental firm value has been examined by Burgstahler and Dichev (1997), and Collins, Pincus, and Xie (1999). They suggest that earnings yield has concave-nonlinear association, not purely linear. Other studies show otherwise, inverse relationship of earnings and book value of equity with stock price or return (Jan and Ou, 1995, and Collins, Pincus, and Xie, 1999). The inconsistent relationship between stock price and accounting fundamentals has been overviewed by Lev (1989), Lo and Lys (2000), and Kothari (2001). Those three researches argue that this inconsistency due to (1) weak relationship between earnings and stock price variability, marked by R2 less than 10% (Chen and Zhang, 2007), and (2) linear correlation between accounting information and future related cash flow, with equity value as a function of scalability and profitability (Ohlson, 1995, Feltham and Ohlson, 1995, 1996, Zhang, 2003, and Chen and Zhang, 2007).
This study mainly focused on designing new return model including its examination. Previous studies clearly show positive association between accounting data and return based on four related-cash flow, namely earnings yield, equity capital, profitability, and growth opportunities, and negative relationship with cost of debts and equity capital (Zhang, 2003, and Chen and Zhang, 2007). Since previous models could not
1
Scalability is actually a firm’s scale of operation. This study shortens it into scalability. It refers to measure
yet explain comprehensively the role of equity capital, then this recently designed model is aimed to enhance the identification of initial factors causing equity capital scalability to rise, whether it is short-run or long-run investment scalability according to financial management concept (Smith, 1973).
Hatsopoulus (1986) supports investment scalability argument suggesting that the strength of firm productivity associates with earnings and stock price. Drucker (1986) also concludes that production scalability affects not only the earnings power but also firm’s market value. Other empirical studies have confirmed the followings (1) positive association between assets productivity and equity value (Kaplan, 1983), (2) efficient productivity showed by low cost assets usage to increase firm’s equity (Dogramaci, 1981; Kendrick, 1984), (3) cheap resources input to ensure future firm’s growth (Kendrick, 1984), (4) enhancements of firm productivity to improve firm’s equity value and stockholders’ wealth (Bao and Bao, 1989), (5) the non-earnings numbers as additional predictive value which is called valuation link (Ou, 1990).
This complementary analysis relies on the following reasons. (1) The limitation of Ohlson (1995) model, Feltham and Ohlson (1995; 1996). This weakness lies on its assumptions that (i) future earnings could be determined by using consecutive previous earnings, and (ii) earnings can be pre-determined stochastically. (2) Earnings are noises when measuring economics earnings and equity value (Kolev, Marquadt and McVay, 2008; Collins, Maydew and Weiss, 1997; Givoly and Hayn, 2000; and Bradshaw and Sloan, 2002). (3) High value relevance when eliminating earnings (Bradshaw and Sloan, 2002; and Bhattacharya, et al., 2003). Therefore, this study provides complementary measurement of earnings. Additionally, this study focuses on adaptation theory in which assets in financial position statements is determinants of equity value (Burgstahler and Dichev, 1977).
1995, and Collins, Pincus, and Xie, 1999), profitability, growth opportunities (Ohlson, 1995, Feltham and Ohlson, 1995, 1996, Zhang, 2003, and Chen and Zhang, 2007), and discount rate (Zhang, 2003, and Chen and Zhang, 2007), but also deepen by inducing short-run and long-short-run investment scalabilities. This study examines this new theoretical return model using empirical data. Furthermore, this new model reexamines its richness and robustness. Therefore, the consistency between the new model and its predecessor is ensured, including the association between each construct and stock return.
This study is beneficial for investors and managers. From investors’ point of view, this study provides more comprehensive, realistic, and accurate parameters to predict potential future cash flow, because the new model extracts more information than currently available models. From managers’ point of view, this study provides incentives for managers to disclose more information publicly as mandated by SFAC No. 5, para. 24 (FASB, 1984). Finally, the new return model can lead investors and management to assess comprehensively the information contained within published financial statements.
This study contributes to accounting literature by providing more comprehensive and more realistic return model. This study has advantages in comparisons with models by Easton and Harris (1991), Liu and Thomas (2000), Zhang (2003), Copeland et al. (2004), Chen and Zhang (2007), and Weiss, Naik and Tsai (2008). The advantages are explained as follows. First, this model is more comprehensive due to its broader coverage. The comprehensive refers to the inclusion of assets scalability to generate future cash flow. Second, by inducing scalability, this model is expected to be closer to economic reality. It means that firms should choose reasonably future investment projects which contribute positive net cash inflow. Cash inflow magnifies earnings and its variability. This second advantage is denoted as earnings capitalization model by Ohlson (1995) which explains that earnings and its variability is affected by current projects.
considerable contribution by improving association degree of return model for it’s more comprehensive, realistic, and accurate. This contribution is reflected by higher R2 or adj-R2 than the previous model.
This study assumes that, firstly, the association of accounting fundamentals and stock price variability is linear. Accounting information is positively proportional to earnings yield, invested equity capital, profitability, and growth opportunities, and is negatively proportional to discount rate. Secondly, investors consider accounting information comprehensively. It means that investors use accounting fundamentals for business decision makings. Thirdly, investors comprehend firm’s prospects based not only on equity capital and its growth, but also on assets as stimulus of increasing firm’s equity value. This refers to adaptation theory (Wright, 1967). Fourthly, efficiency-form of stock markets is comparable. Stock price variability at all stock markets acts in the same market-wide regime behavior and depends solemnly on earnings and book value (Ho and Sequeira, 2007). Fifthly, cost of equity capital represents opportunity cost for each firm. It describes that every fund was managed in order to maximize assets usability. This refers to that management always behaves rationally.
2. Literature Review, Model and Hypothesis Development
Earnings Yield and Stock Value
Ohlson (1995) formulates that firm equity comes from book value and future residual value. Firm value can be calculated from current, potential discount rate which is unrelated to current accounting net capital economics assets. If a firm created new wealth value from invested assets, the new wealth value is concluded in firm’s net equity capital. Then, this net value is reflected in firm stock price.
earnings and subtracted by current dividend paid. Meanwhile, Lundholm (1995) formulates that firm’s market value is sums of invested equity capital and its future residual earnings discounted by cost of invested capital.
Other researches consistently use Ohlson (1995) model without criticizing the stock value and earnings within the model. Feltham and Ohlson (1995; 1996) emphasize that the association between stock value and earnings is asymptotic. It may be affected by other information and accounting conservatism in depreciation. Burgstahler and Dichev (1997) use the same model, introducing book values of assets and debts to explain firm market value better. Liu and Thomas (2000), and Liu, Nissim and Thomas (2001) added clean surplus model by multiple factors, either earnings disaggregating and other measures that related to book value and earnings.
Collins, Maydew, and Weiss (1997), Lev and Zarowin (1999), and Francis and Schipper (1999) point out association validity that value relevance between book value and earnings and stock market value could be maintained. Abarbanell and Bushee (1997) and Penmann (1998) specifically suggest that accounting information signals can improve degree of association. Both studies complement that earnings quality improves return association. Collins, Pincus, and Xie (1999) declare similarly and enhance their association by eliminating firms with negative earnings.
Investment Scalability
The first limitation of Ohlson (1995) model lays on its assumption. Continued by Feltham and Ohlson (1995; 1996), it still assumes that future earnings is determined by consecutive previous earnings. However, investors may have different insight, which is by observing future potential earnings. Burgstahler and Dichev (1977) clearly state that equity value is not determined by previous earnings only, but can be determined by adaptation theory.2 It was firm’s invested capital when its resources are modifiable for other utilizations. Furthermore, the other utilizations may generate future potential earnings. This concept is based on Wright (1967). He argues that adaptation value derives from the role of financial information in balance sheet. The role primarily comes from assets.
The second limitation of Ohlson model (Ohlson, 1995, and Feltham and Ohlson 1995; 1996) lays on earnings assumption. Earnings are assumed to be pre-determined stochastically. This concept is based on Sterling (1968). He assumes that firms are in stationary condition. This formulates that firm continues to operate based on its past strength and performance. Factually, the firm strength and performance may change due to its business technology, for example merger, acquisition, take-over, liquidation, bankruptcy, business restructuring, management change, and new invested capital.
Ohlson (1995; 2001) himself showed those limitations, that there is other information, noted as mysterious variable. This variable makes stock market fails to reflect book value, or lessens the information content. Further research has attempted to replace mysterious variable (Beaver, 1999; and Hand, 2001), though both studies are interpretative commentary or evaluative review of the Ohlson model.
Later research has left Ohlson concept and try to complement with other empirical concepts. Francis and Schipper (1999) have abandoned Ohlson’s linear information dynamics by adding assets and debts into return model. This addition has begun the measurement of assets scalability in either long or short-run. Abarbanell and Bushee (1997) modify return model by adding fundamental signals and its changes consist of inventories,
2
account receivables, capital expenditure, gross profit, and taxes. These fundamental signals represent investment scalability from assets in the statement of financial position.
Bradshaw, Richardson and Sloan (2006) modify Ohlson’s return model by inducing the magnitude of financing obtained from debts. This change in debts is comparable to the change in assets utilized to generate earnings. Cohen and Lys (2006) improve model by Bradshaw, Richardson and Sloan (2006) by inducing not only the change in debts but also the change in short-run investment scalability that is the change in inventories. Up to the latest research, long-run and short-run investment scalability has been put into consideration. In the meantime, Weiss, Naik and Tsai (2008) emphasize on short-run investment scalability, those are the changes in inventories and account receivables to improve degree of association.
Before Ohlson (1995) model, short-run and long-run investment scalabilities have been associated with equity value. Bao and Bao (1989) construct production capacities measured by economic value added; those are the changes in inventories and direct labor costs to measure short term productivity, and fixed assets depreciation to measure long term capacity.
Accounting earnings numbers as noises when measuring economics earnings and equity is introduced by Kolev, Marquadt and McVay (2008), Collins, Maydew and Weiss (1997), Givoly and Hayn (2000), and Bradshaw and Sloan (2002). Investors adjust their focus not to earnings based on generally accepted accounting principles but to the measurement of core potential earnings. The interesting result from research by Bradshaw and Sloan (2002) and Bhattacharya, et al. (2003) is that they eliminate earnings to improve value relevance of they return model.
short-run and long-short-run investment scalabilities. Furthermore, this research focuses on adaptation theory in which assets as determinant of firm value (Burgstahler and Dichev, 1977).
Change in Growth Opportunities
Ohlson (1995) model maintains clean surplus theory that associates accounting information, with following premises: (i) stock market value based on discounted future dividend in which investors has neutral position against risks, (ii) accounting information is sufficient to calculate clean surplus, and (iii) future earnings are stochastic which are pre-determined by consecutive previous earnings. However, investors may respond differently against minimum or maximum profitability. Hence, growth factors may affect earnings, which other research include them.
Rao and Litzenberger (1971), Litzenberger and Rao (1972), and Bao and Bao (1972) conclude that growth and its change increase firm competitiveness. Consequently, the higher efficiency the higher productivity is, and also the higher stockholders’ welfare and country welfare are. Rao and Litzenberger (1971) and Litzenberger and Rao (1972) specifically disclose that growth opportunities associates directly with long-run prospects within one industry. These studies are based on Miller and Modigliani (1961) concluding that growing firm is firm who has positive rate of return for each invested capital. It also means that every invested resource have lower cost of capital than within industry.
Chen and Zhang (2007) conclude that firm’s equity value completely depend on growth opportunities. They themselves are function of assets operation scale and affect the potential to grow continuously. The inclusion of growth opportunities is based on that earnings and book values are not sufficient enough to explain stock price movements. Therefore, they could be increased more comprehensively when external environment, industry, and interest rate were induced to current and future earnings.
Change in Discount Rate
Ohlson (1995) model assumes that investors take neutral position against fixed risk and interest rate. This simplification is modified by Feltham and Ohlson (1995; 1996), and Baginski and Wahlen (2000). Their modifications lie on that interest rate can change firm’s future earnings power. Related to investors’ perception, interest rate movement may change their belief of the firm’s earnings power. This ability is based on that future earnings can be referred to a set of discount rate giving better certainty of future earnings.
Rao and Litzenberger (1971), and Litzenberger and Rao (1972) indicate previously that equity value depends on discount rate of future potential earnings. This discount rate depends on pure interest rate and then affects the efficiency of firm’s scale of operation, and finally in earnings. Danielson and Dowdell (2001), and Liu, Nissim and Thomas (2001) state that firm equity is highly affected by expected discount rate to grow assets and book value. Interest rate has multiplier effect. If interest rate relative to current assets and capital is higher than pure interest rate, the firm could generate earnings more. An alternative method is that the increase of debts or new invested capital could decrease relatively the cost of capital.
external environments may affect earnings growth, one of them is external interest rate selected by management to make its operation efficient.
A Model of Equity Value
A model of equity value, the first time, associates accounting information and prospect of future cash flow. This approach refers to Ohlson (1995), and Feltham and Ohlson (1995; 1996). The model is based on firms’ scale of operation (scalability) and profitability. Scalability and profitability is a function of current condition and future potential cash flow. Therefore, earnings play major role because its ability to show firm tendency to expand operation or to abandon operation. Equity value model is a process of measuring equity investment to expand or to cease firms’ operation (Burgstahler and Dichev, 1997). Zhang (2003) develops equity value model that simplifying the probability of firm’s going concern or firm’s abandonment operations.
Zhang (2003) and Chen and Zhang (2007) symbolize the equity value of all equity financed at date t (end period t) with Vt. The next, Xt represents earnings during period t. Bt
is book value of firm equity. Et(Xt+1) is expected future earnings, k is earnings capitalization
factor, P is probability of abandonment option, C is probability of continuation option, qt
Xt/Bt-1 is profitability – based on ROE, during period t. While, gt is earnings growth
opportunities. Chen and Zhang (2007) formulate equity value as follows. )
( . . ) ( . )
( t 1 t t t t t
t
t kE X B P q B g C q
V ... (1) This model (1) formulates that equity value (Vt) is associated with expected future
earnings from invested assets (Et(Xt+1), earnings capitalization factor (k), probability of
abandonment option (P(qt)), and probability of continuation option (C(qt)). This model
indicates that equity value is equal to continuation of current operation (qt), added by firm
growth opportunities either positive or negative (gt).
reflected in stock price. Therefore, this study transforms by adding non-earnings values as predictor.
The transformation is based on reasoning that qt Xt/Bt-1 may be specified by srt and
lrt. Short-run investment scalability is srt = (Asrt - Lsrt)/(Asrt-1-Lsrt-1), where A is assets and
L is liabilities; and long-run investment scalability is lrt = (Alrt - Llrt)/(Alrt-1-Llrt-1). The
transformation result in complete formula is expressed in model (2) as follows. ))
( ) ( ( . )) ( ) ( ( )
( t 1 t t t t t t t
t
t kE X B P sr P lr B g C sr C lr
V ... (2) By transforming qt into srt and lrt, this study develops logical framework as follows.
Parameter qt as earnings is capital inflow for the firm from its operating activity. Thus,
model (1) is based on capital cash flow. This study formulates that earnings may be measured based on assets, symbolize as srt and lrt. To synchronize into flow form, this
study transforms from stock form into flow form by measuring the change, namely by (Asrt-Lsrt) and (Alrt-Llrt) then normalizing them based on prior period (Asrt-1-Lsrt-1) and
(Alrt-1-Llrt-1). Second reasoning, Zhang (2003) posits that earnings increase due to firm’s
expansion. This study formulates that earnings increase is not only caused by firm’s expansion, but also by scalability of their productive assets. Assets refer to all resources managed to generate earnings. Therefore, the net difference between assets and liabilities may be used to measure firm’s earnings power. Additionally, the transformation qt into srt
and lrt is based on Rao and Litzenberger (1971) suggesting that book value of assets and
liabilities could increase or decrease the potential future earnings (Smith, 1973).
The next step is model (2) simplification. Earnings growth usually follows random walk. It means that earnings growth depends on last year observed earnings. With qt+1 = qt
+ et+1, which et+1 as mean-error closes to zero, then Et(Xt+1) = Et(Btqt+1) = Btqt, and with k
= 1/rt. Assets growth used to generate earnings follows the same pattern as earnings
growth. Transformation of qt into srt and lrt results in the following equation (3).
( ) ( )
) ( )
( t 1 t t t 1 t t t t t
t X E Bq Bq B sr lr
Substituting equation (3) into the model (2) results in the equation (4) as follows. equity value included into Vt. Its formulation in equation (6) is as follows.
A Model of Stock Return
To develop a return model, this study considers equity value model. This model assumes that change in equity value starts from date t-1 until t, notated as ΔVt. Interpreting equation
(6), that change in firm market value equals to the change in book equity value as a function of four-cash flow-related factors (ΔBtv(srt-1, lrt-1, gt-1, rt-1)) and book value
multiplied by the change in all four factors (Δsrt, Δlrt, Δgt, and Δrt). Then, return
formulation is in the following equation.
t t t t t t
To show the change in each related factor, the differential equation is developed as follows,)
If the firm paid dividend Dt during period t, the net contribution for current return
v , substituting it into equation (9) can obtain equation (10) as follows.
equation is reversed into Dt = Xt–ΔBt. If this equation was substituted into equation (10), it
results in the following equation (11).
Hypothesis Development
EarningsYield Earnings yields (Xt) shows additional values generated from beginning of
invested capital which it, herein after, refers to current earnings. Earnings yield is deflated by beginning year firm’s equity value used to generate current earnings. Based on model (11), if earnings yield increased, stock return increases and vice versa (Rao and Litzenberger, 1971; Litzenberger and Rao, 1972; Bao and Bao, 1989; Burgstahler and Dichev, 1997; Collins, Pincus and Xie, 1999; Collins, Kothari and Rayburn, 1987; Cohen and Lys, 2006; Liu and Thomas, 2000; Liu, Nissim and Thomas, 2001; Weiss, Naik and Tsai, 2008; Chen and Zhang, 2007; Ohlson, 1995; Feltham and Ohlson, 1995; Feltham and Ohlson, 1996; Bradshaw, Richardson and Sloan, 2006; Abarbanell and Bushee, 1997; Lev and Thiagarajan, 1993; Penman, 1998; Francis and Schipper, 1999; Danielson and Dowdell, 2001; Aboody, Hughes and Liu, 2001; Easton and Harris, 1991; and Warfield and Wild, 1992).
Association between earnings yield (Xt/Vt-1) and stock return (Rt) is always positive.
Because
1
1
t t t
V dX dR
, and 1/Vt-1 always greater than zero, then dRt/dXt is always positive.
Therefore, alternative hypothesis is stated as follows.
HA1: Earnings yield associates positively with stock return
Short-run and Long-run Investment Short-run investment (Δsrt) and long-run
investment (Δlrt) is assets invested by firm to generate future earnings. According to model,
ability to pay dividend. Because (Bt-1/Vt-1) is expected to be greater than one, short-run
assets associates positively with stock return.
The differential equation is
HA2: The change in short-run invested assets associates positively with stock return
HA3: The change in long-run invested assets associates positively with stock return
Change in Book Value Change in book value is the central point of firms’ equity value measurement. It is measured by ΔBt/Bt-1 which is a measurement of current earnings
divided by beginning book value. In other words, ΔBt/Bt-1=v[ΔBt/Vt-1] means that the
increase of earnings is proportional with the growth of market value, and also with the change in stock return. Consequently, the change in stock return is proportional after considering the beginning market value (Vt-1). Therefore, v is expected to be positive and
greater than zero (Rao and Litzenberger, 1971; Litzenberger and Rao, 1972; Bao and Bao, 1989; Burgstahler and Dichev, 1997; Collins, Pincus and Xie, 1999; Collins, Kothari and Rayburn, 1987; Cohen and Lys, 2006; Liu and Thomas, 2000; Liu, Nissim and Thomas, 2001; Weiss, Naik and Tsai, 2008; Chen and Zhang, 2007; Ohlson, 1995; Feltham and Ohlson, 1995; Feltham and Ohlson, 1996; Bradshaw, Richardson and Sloan, 2006; Abarbanell and Bushee, 1997; Lev and Thiagarajan, 1993; Penman, 1998; Francis and Schipper, 1999; Danielson and Dowdell, 2001; Aboody, Hughes and Liu, 2001; Easton and Harris, 1991; and Warfield and Wild, 1992).
HA4: Change in book value associates positively with stock return
Change in Growth Opportunities Firm’s book value depends on the change in growth opportunities (Δgt). In other words, stock return depends on whether the firm grows
or not. A firm is called by option to grow if it can increase its book value and, in turn, increase its stock price. Similarly, a firm is called by option to expand that could generate future earnings from its assets. The growth concept is also inspired by firm’s ability to generate future earnings from short-run and long-run assets multiplied (C((srt)+(lrt)). It
infers that assets growth may different from growth of book value. Therefore, growth opportunities (Δgt), after being adjusted by Bt-1/Vt-1 and considering multiplier effect of
C((srt)+(lrt) associates positively with stock price variations (Rao and Litzenberger, 1971;
Litzenberger and Rao, 1972; Bao and Bao, 1989; Weiss, Naik and Tsai, 2008; Ohlson, 1995; Abarbanell and Bushee, 1997; Lev and Thiagarajan, 1993; Danielson and Dowdell, 2001; and Aboody, Hughes and Liu, 2001).
The change in book value which increases proportionally with the growth of beginning short-run and long-run invested assets supports this positive association. With
HA5: Change in growth opportunities associate positively with stock return
The change in Discount Rate Discount rate could generate potential future cash flow priced by cost of book value. Discount rate (Δrt) affects future cash flow. It also
2007; Feltham and Ohlson, 1995; Feltham and Ohlson, 1996; Danielson and Dowdell, 2001; and Easton and Harris, 1991).
With
1 1 3
t
t
t t
V B v r d
dR
, when Bt-1/Vt-1 was greater than zero, and v3 was one unit
investment, because k
rt 1, then
1 1
t t B V
become smaller than zero. It can be concluded in alternative hypothesis as follows.
HA6: Change in discount rate associates negatively with stock return
3. Research Method
Data
All related-cash flow factors determining return model in this research (earnings yield, expected earnings yield, short-run assets investment assets and expected short-run assets investment assets, long-run assets investment and expected long-run assets investment, change in capital, and change in growth opportunities and change in expected growth opportunities) are obtained from financial statements. Data of expected value or financial statements’ prospectus can be found in the notes of financial statement. All data are obtained from OSIRIS database. The change in discount rate data are obtained from central bank website of each country, even though the financial statement of each firm also contains long term liabilities or obligation interest rate. Pure interest rate is proxies with long term obligation interest rate based on central bank in each country. This study, then, extracts stock price and return for each firm from stock market of every country directly.
This study is expected to overcome the cultural problem and the efficiency of stock market based on market-wide regime shifting behavior approach (David, 1997; Veronesi, 1999; Conrad, Cornel and Landsman, 2002; dan Ho and Sequeira, 2007). This approach indicates that the movement of stock price or return model should be equivalent for all stock markets because it based on accounting information. It also states that within certain classification, the movement of stock prices responds against accounting information should be the same. Therefore, cultural problem and efficiency-form stock market were eliminated when market efficiency-form classification or level is applied within return model.
Sampling Method
This study uses purposive sampling, samples are chosen under criteria suited for research objectives. The criteria are as follow. Firstly, sample is manufacturing and trading firms. Secondly, it eliminates firms with negative book value at the beginning and the end (Bit-1<0;
Bit<0). This exclusion is based on logical reasoning that firms with negative book value
tend to abandon with their short-run and long-run capacity. Those firms are suspected to have tendency to go bankruptcy. Thirdly, sample is firms whose stocks are traded actively. Sleeping stocks are excluded because they can compromise this research validity. This study also selects sample with liquidity (LQ-n) according to each stock market.
Variables Measurement and Examination
This study is aimed to improve Chen and Zhang (2007) model. Therefore, this research is carried out in consecutive stages as follows. Firstly, this study examines Chen and Zhang (2007) model. Secondly, this study examines new model, using equation (11). Thirdly, this study compares the results of examination (1) and (2).
The first examination is linear regression as follows. it it it
it it
it
it x q b g r e
R ˆ ˆ ˆ ˆ ... (12) with Rit is annual stock return for firm i during period t, measured by a year, a year and
first day of beginning year until the end of month during period t; xit is earnings generated
by firm i during period t, calculated by earnings acquired by common stockholders during period t (Xit) divided by opening market value of equity of current period (Vit-1);
1 1
1) /
(
ˆ
qit qit qit Bit Vit is change in profitability for firm i during period t, deflated by opening book value of equity of current period. Profitability calculated using formula qit=Xit/bit-1; bˆit [(Bit Bit1)/Bit1](1Bit1/Vit1) is book equity capital or proportional
change in equity book value for firm i during period t, adjusted by one minus opening book to market equity ratio of current period; gˆit (git git1)Bit1/Vit1 is change in growth opportunities for firm i during period t; rˆit (rit rit1)Bit1/Vit1 is change in discount rate during t; , , , , and are regression coefficient; and eit is residual.
The model used in examination (2) that is comparable to examination of Chen and Zhang (2007) is equation (11) as follows.
it it it
it it
it it
it X sr lr p g r e
R ˆ ˆ ... (13) with additional explanations for model (13) are (1) srit (Asrit Lsrit) is current assets minus current liabilities, srit (srit srit1)/srit1(Bit1/Vit1) is change in srit adjusted by
opening book to market equity ratio of current period; (2) lrit (Alrit Llrit) is fixed assets subtracted by long term liabilities, lrit (lrit lrit1)/lrit1(Bit1/Vit1) is change in lrit adjusted by opening book to market equity ratio of current period; (3) Δpit=ΔBit/Bit-1
(1-Bit/Vit-1) is change in profitability measured by the change in book value of equity and
adjusted by one minus opening book to market equity ratio of current period; (4)
1 1
1) /
))( ( ) ( (
ˆ
git C srit C lrit git git Bit Vit is change in growth opportunities for firm i during period t measured by considering multiplier effect of growth opportunities against short-run and long-run invested assets. Then, it is adjusted by opening book to market equity ratio of current period; other variables are identical.
It has to be noted that Rit in regression model (13) represents various return periods,
long-run assets are considered to be utilized to generate current and future earnings. Therefore, different return periods refer to current return (Rit), and potential future return
(Ri,t+1). Nevertheless, it is still notated as Rit.
The First Sensitivity Examination
Chen and Zhang (2007) examined their model sensitivity by categorizing profitability and growth opportunities into three groups, those are low group (L), medium group (M), and high group (H). The proposed consideration is that the coefficients of H group should be greater than M and L groups, and greater than zero (H>M>0, and H>M>0). Model used
by Chen and Zhang (2007) is as follows.
it with M and H represent group with profitability and growth opportunities those are greater than the lower group.
This study develops the classification of profitability and growth opportunities using four categories, namely, lower group (L), lower-medium group (LM), medium-high group (MH) and high group (H). This examination expects the result of comparison those are
H>MH>LM>0, H>MH>LM>0, H>MH>LM>0, and H>MH>LM>0. This study also
performs model’s linearity tests. The reason is that linear regressions models require free of normality, heteroscedasticity, and multicolinearity problems. Gujarati (2003) suggests that linear regression model is free from unbiased errors.
The Second Sensitivity Examination
4. Analysis, Discussion and Findings Descriptive Statistics
This study acquires sample as much as 6,132 (25.45%) from available initial sample of 24,095 (100.00%) acquired from all stock market in Asia, Australia and United States of America during 2009. Before 2009 predicted data is unavailable in OSIRIS database. The number of data excluded and the reasons are as follow. First, stock price or return data incomplete, 8,939 (37.10%). Second, earnings data unavailable, 661 (2.74%). Third, no expected earnings and growth opportunities, 8,038 (33.36%). Fourth, firm with negative earnings, 167 (0.69%). Fifth, extreme value of earnings and expected earnings, 120 (0.50%). Last, inability to calculate abnormal return based on Fama and French (1992, 1993, and 1995), 38 (0.16%).
Data exclusion due to all six factors above is 17,963 (74.55%). The most dominant exclusion is because stock price incomplete and earnings data unavailable, as much as 70.46%. The result sample has fulfilled all required criteria. For example, this study is unable to acquire data of firms with negative book value because such firms do not have complete data of stock market price. The complete data is presented in Table 1 as follows.
---
Insert Table 1 about here
---
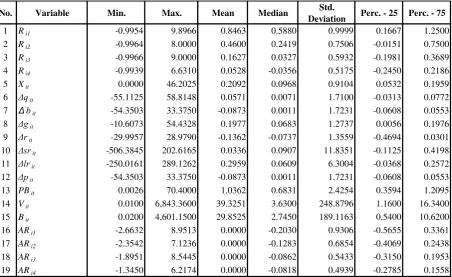
This study performed data analysis to investigate initial data tendency. The descriptive statistics are presented in Table 2. It shows the results as follows. Return for one year period (Ri1) is 0.8463 then decreases over time and become 0.0528 for Ri4. The
decrease occurs in all level within percentile 25 (from 0.1667 to -0.2450) and percentile 75 (from 1.2500 to 0.2186) and indicates that firm market value in longer period is closer to real firm intrinsic value. By this tendency, firm fundamental values calculated from accounting information are expected to be reflected in firm’s market value.
---
Insert Table 2 and its notes about here
Focusing on earnings after taxes (xit), this study uses only profit firm. Earnings
minimum value is 0.0000, with mean 0.2092, median 0.0968, and standard deviation 0.9104. The median lays in the left from its mean, it shows that some firms have extremely great earnings, so the mean increases. However, it is not a problem, since the standard deviation is less than one. The aligned movement between return and earnings shows that they probably associate. The change of earnings power (Δqit), change of growth
opportunities (Δgit), and long-run assets scalability (Δlrit) show relatively the same as the
variations of earnings. Meanwhile, change of discount rate (Δrit), change of short-run assets
scalability (Δsrit), and change of profitability (Δpit) show otherwise. Nevertheless, the
change of discount rate is expected to be not aligned. Though, change of short-run scalability and change of profitability with such movement may reduce degree of association of return model.
Firm’s book value (Bit), market to book value ratio (PBit), and stock market price (Vit)
are always positive because, according criteria, this study excludes firms with negative earnings after tax and negative book value. Even after elimination of extreme value, Bit and
Vit still have large maximum value. It occurs especially in developing countries, where stock
market values usually move away from their book values. Book value (Bit) data pattern with
mean, 29.8525 and median, 2.7450 resembles data pattern of stock market values. This pattern doesn’t threat the association, and also data pattern of firm intrinsic values (Vit)
reflected in stock market value at the end of accounting period.
Abnormal return calculation based on model by Fama and French (1992; 1993 and 1995) resulting mean 0.0000 for ARi1, ARi2, ARi3, and ARi4. This number shows that
estimation of abnormal return is proven valid mathematically. Standard deviation of abnormal return becomes smaller along periods, from 0.9306 (ARi1) to 0.4939 (ARi4).
Therefore, it can be concluded that abnormal return moves proportionally with firm market value which is closely reflects fundamental values derived from accounting information. Abnormal return movement is in accordance with return movement and earnings (xit)
movement, earnings power (Δqit), change of growth opportunities (Δgit), long-run assets
association as hypothesized. Additionally, this study could achieve higher degree of association.
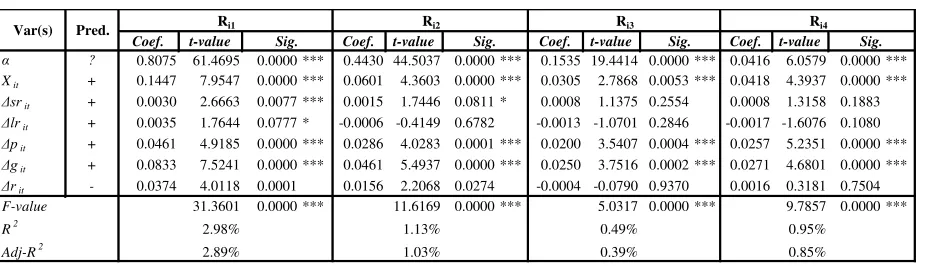
Analysis of Chen and Zhang (2003) Model
This study, at the first analysis, examines Chen and Zhang (2003) model, or refers to basic model (model 12). The basic model constructs five related-cash flow factors associated with return. Those are earnings yield (xit), change of firm’s book value (Δbit), change of
earnings power (Δqit), change of growth opportunities (Δgit), and change of discount rate
(Δrit). The results of the first analysis are presented in Table 3.
---
Insert Table 3 and its notes about here
---
The analysis of Chen and Zhang (2003) model is not yet examine hypothesis by hypothesis. Instead, it is used as initial investigation of five related-cash flow factors associated with stock return. The results show that three variables, consist of earnings yield (xit), firm’s book value (Δbit), and growth opportunities (Δgit) is proven significantly in 1%
level for various specification of return (Ri1 to Ri4). This study is unable to prove earnings
power (Δqit) to associate with stock return which Chen and Zhang (2003) has proven almost
consistently. Meantime, the change of pure interest rate (Δrit) such as Chen and Zhang
(2003) model, is also unable to prove. Consequently, this study concluded that basic model is supported adequately except for earnings power. However, basic model analysis shows sufficient degree of association with F-value 35.5187 and significant at level of 1%. The basic model has R2 of 2.82% for Ri1, and lower for other return types. The degree of
association with adjusted level is not significantly different, with adj-R2 of 2.74%.
values related to debts or capital concentration. The results needs to transform the basic model into a new model which is more detail and able to explain the change of earnings power. Furthermore, the transformation does not consider the change of pure interest rate (Δrit) which is actually serves as lifter of the change of earnings power. The change of pure
interest rate has proven inconsistently by previous studies. This study suspects that the change of pure interest rate must be more reflected when it was specified into short run or long run earnings powers.
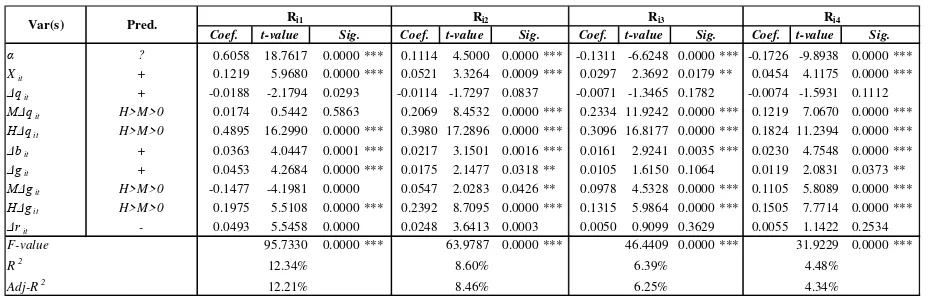
Analysis of Investment Scalability Model
The second analysis transform basic model analysis which uses change of earnings power (Δqit) into a model using the change of short run earnings power (Δsrit) and long run
earnings power (Δlrit). This model is also called short-run and long-run investment
scalabilities inducing model (model 13). Model specifies the earnings power into more detailed forms to investigate their associations with variations of stock price. Table 4 presents the results analysis.
---
Insert Table 4 and its notes about here
---
The results of model 13 analysis show that earnings yield (xit), change of book value
(Δbit), change of short-run earnings power (Δsrit), change of long-run earnings power (Δlrit),
change of growth opportunities (Δgit), and change of discount rate (Δrit) are associated with
stock price movements. Consequently, HA1, HA4, and HA5 are supported at 1% level for
return type’s model Ri1– Ri4. HA4is supported partially at 10% level only for Ri1 return type
with t-value amount to 1.7644. HA3beside supported for Ri1 return type, is also supported
for Ri2 with t-value amount to 1.7466 and significant at 10% level. The results of model 13
examination show adequate degree of association with F-value amount to 31.3601 and significant at 1% level. The model has R2 amount to 2.98% for Ri1 type, and lower for other
The analysis results show that model 13 is able to explain the association between change of earnings power (Δqit) and stock return variations after specifying it into more
detailed forms, short-run (Δsrit) and long-run (Δlrit) investment scalability. HA2 and HA3 are
supported for both Ri1 and Ri2 return types. HA2 is also supported for Ri2 return type. The
results analysis implies that the effect of earnings power in aggregate value is actually weak. Therefore, splitting of earnings power into more detailed forms is necessary. Therefore, its association with variations of stock return becomes more comprehensible. Model 13 is better than basic model in its degree of association with adj-R2 amount to 2.89% which is greater than those of the basic model having adj-R2 amount to 2.74%.
Sensitivity Analysis 1: Categorical Arrangement
This study then analyzes the model based on categorical differentiation. This analysis serves to find more favorable degree of association. Model 14 should has higher goodness of fit when, after differentiation, it has higher degree of association and is still consistent with the main variable. The results of categorical arrangement for the basic model are presented in table 5 as follows.
---
Insert Table 5 and its notes about here
---
This analysis is aimed to identify the incremental explanatory power. Moreover, categorical arrangement serves to identify initial sensitivity so that hypothesis examination is supported in accordance with the theory. The categorical arrangement for model 14 based on basic model shows that there is difference which is greater than zero or positive for change of earnings power and growth opportunities. HA1-HA5 are supported, the same as
basic model. Therefore, the ratio between market value and book value serves well within the next analysis.
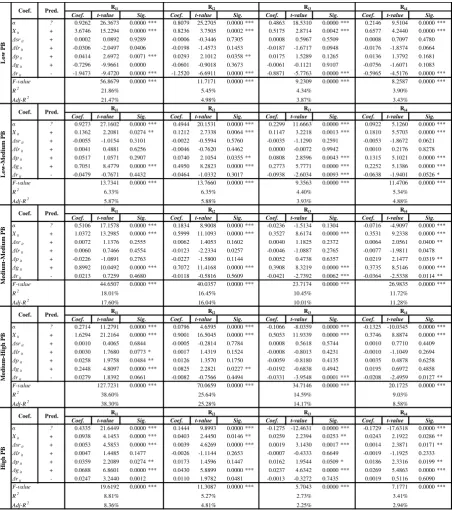
Sensitivity Analysis 2: PB Partitioning
This study organizes the sample based on PB ratio arrangement into five partitions (quintiles). This quintile arrangement serves to examine model sensitivity based on market strength which draws investors’ attention, or no longer based on firm information strength merely. Such arrangement also serves to examine investors’ rationality which does not possible anymore to act within stock mispricing. The results of second sensitivity analysis are presented in table 6 as follows.
---
Insert Table 6 and its notes about here
---
Table 6 proves that earnings yield (xit), change of book value (Δbit), and change of
growth opportunities (Δgit) associate with variations of stock prices in various return types
and for all PB levels. Therefore, hypotheses HA1, HA4 and HA5 are supported consistently in
comparisons with previous examinations. Hypothesis HA2 is supported for Ri1 – Ri3 return
types and high level of PB with degree of association of 1%, and for Ri4 return type and
high and medium-high levels of PB with degree of association of 5%. Hypothesis HA3 is
supported for Ri1 return type and medium-high level of PB with degree of association of
10%.
The change of pure interest rate (Δrit) in PB partitioning based associates negatively
with stock price movements. The supports are shown at low level of PB and Ri1 - Ri4 return
types with significance of 1% level, and low to medium-high levels of PB and Ri2 – Ri4
return types with significance of 1% level, except for Ri4 return type and medium-high level
of PB with degree of significance of 5%. Therefore, this study concludes that HA6 is
PB partition based model shows proof of R2 increase up to 38.60%, and Adj-R2 up to 38.30% for Ri1 return type. Therefore, partition model has even better explanatory power
than the basic model. Furthermore, the ratio of market value and book value works out well to improve model’s degree of association.
Discussion
Overall examinations prove that six related-cash flow factors of accounting information associate with stock price variability with direction as hypothesized. This study interprets accounting information variables one by one and suggests some research findings.
Earnings yields Earnings yields associates positively with firm market value. The result of this study supports the classical concept (Ohlson, 1995), along with derivative studies Lo and Lys (2000), Francis and Schipper (1999), Meyers (1999), Bradshaw, Richardson and Sloan (2006), Cohen and Lys (2006), Bradshaw and Sloan (2002), Bhattacharya, et al. (2003), Collins, Maydew and Weiss (1997), Givoly and Hayn (2000), Kolev, Marquadt and McVay (2008), and Weiss, Naik and Tsai (2008). Even though Ohlson (1995) has flaw that earnings are noisy when measuring market equity value, this study concludes that earnings are primary determinant of firm’s market value. Therefore, this study denotes that earnings are measures of value added in accounting. Moreover, its measurability is always reflected in market value.
stock prices fully reflects book value and earnings. Finally, this study concludes that the association between accounting earnings and stock price is undeniable.
Investment scalability and its change Short-run and long-run investment scalabilities can be used as predictors of market value. The analysis shows that investment scalability is associated with return. Therefore, this study concludes that short and long-run assets act as an earnings power. Consequently, assets increase means firm’s equity increase (Bao and Bao, 1989; Cohen and Lys, 2006; Weiss, Naik and Tsai, 2008; Bradshaw, Richardson and Sloan, 2006; Abarbanell and Bushee, 1997; Abarbanell and Bushee, 1997; Francis and Schipper, 1999). This study supports that short-run and long-run investment is earnings power and then return when they have low cost of capital. The reason is, the increase of short-run and long-run investment refers to the increase of future earnings power, meaning the increase of firm’s equity value. Moreover, the increase of short-run and long-run assets investment will decrease cost of capital, namely the firm ability to pay dividend will decline. Therefore, investment scalability associates with stock price variability directly through dividend or indirectly through earnings variability.
This study supports old concept that book value and earnings are closely related to firm’s market value. Rao and Litzenberger (1971), and Litzenberger and Rao (1972) formulate that firm market value is a function of book value and earnings but still adjustable to function of debts and change of firm’s growth opportunities. Analysis and inferences from previous studies show that this study supports adaptation theory (Wright, 1967). Supporting to all hypotheses indicates that firm assets are modifiable to generate future potential earnings. This study concludes that the role of financial position information, it is not equity capital, may also become a determinant of stock price variability, especially the role of assets and liabilities.
dividend. Dechow, Hutton, and Sloan (1999) re-evaluate return model which is still based on earnings. Beaver (1999), Hand (2001), and Myers (1999) verify that book value and earnings serve as evaluator of firm market value without ignoring Ohlsons’ concept. Within the same logical and reasoning, this study infers that accounting information of book value improve degree of association of return model.
This study implies that the change of book value is a primary measurement of firm’s equity value. The change of book value is identical with current earnings measurement. Therefore, the change of book value is in accordance with the growth of equity capital, which in turn, in accordance with the change of stock return (Rao and Litzenberger, 1971; Litzenberger and Rao, 1972; Bao and Bao, 1989; Burgstahler and Dichev, 1997; Collins, Pincus and Xie, 1999; Collins, Kothari and Rayburn, 1987; Cohen and Lys, 2006; Liu and Thomas, 2000; Liu, Nissim and Thomas, 2001; Weiss, Naik and Tsai, 2008; Chen and Zhang, 2007; Ohlson, 1995; Feltham and Ohlson, 1995; Feltham and Ohlson, 1996; Bradshaw, Richardson and Sloan, 2006; and Abarbanell and Bushee, 1997).
Growth Opportunities This study supports to Rao and Litzenberger (1971), Litzenberger and Rao (1972), and Bao and Bao (1972) that growth opportunities increase firm competitiveness. Consequently, the higher efficiency the higher productivity is. Miller and Modigliani (1961) suggest that growing firms always has positive rate of return for each invested assets. It means that every invested resource have lower cost of capital than firms within an industry.
Change of Discount Rate This study documents that the change of discount rate is associated negatively with annual stock return. From the beginning, this study implies that firm equity value can be increased by adaptation concept. The equity value may be increased by adapting alternative resources through the lower interest rate. Consequently, the invested resources managed by firm would be more productive (Burgstahler and Dichev, 1997). Aboody, Hughes and Liu (2002), Frankel and Lee (1998), Zhang (2003) and Chen and Zhang (2007) argue that earnings growth is determined by some factors, one of them is interest rate. Later, earnings growth associates positively with stock price variability.
This study has a perspective that interest rate play a role as multiplier effects. When interest rate decreases, the firm may generate more earnings. It means that firms acquire more liabilities or new invested capital that firm’s weighted interest rate will decline (Rao and Litzenberger, 1971; and Litzenberger and Rao, 1972). Therefore, this study infers that firm’s equity value is highly determined by expected discount rate (Danielson and Dowdell, 2001; and Liu, Nissim and Thomas, 2001).
Research Findings
Based on overall analysis, this study confirms to the theory and finds some empirical evidences. First, all accounting fundamentals, simply as theory, is confirmed to associate with stock price variability. All related-cash flow variables, they are earnings yield, short-run and long-short-run investment scalabilities, book value, and growth opportunities associate positively. Meanwhile, change of discount rate or pure interest rate, associates negatively. Second, change of earnings power in a single measure is verified to explain stock price variability weakly. Until recently, some empirical evidences measure the earnings power as single unit. This study splits this measure into short-run and long-run investment scalabilities and finds that both measures are associated positively with annual stock return. Examination using PB ratio partition shows consistent results for sub samples with low to medium-high PB ratio.
Third, this study could synergize between adaptation theory (Wright, 1967) and recursion theory (Sterling, 1968). Earnings explain stock price variability for a half century. It means that recursion theory is still valid. On the other sides, the result that short-run and long-run investment scalabilities implies that adaptation theory is also valid. This study combines both theories into one model and finds that both theories are demonstrated valid and even the model has better degree of association. Recursion theory which relies on earnings and book value as Ohlson’s model (Ohlson, 1995; Feltham and Ohlson, 1995; 1996) is called orthodox paradigm. This forty years old paradigm can be revised by being complemented with older paradigm, it is adaptation theory. Therefore, this study comprehends that both theories are complementing, not substituting reciprocally.
but also characteristics of firm’s investment scalability in the financial statements. The detailed assets show that investors could utilize them to perceive earnings powers.
Fourth, this study fruitfully verifies the association between accounting fundamentals and variations of stock price with higher association degree than previous study (Chen and Zhang, 2003). Previous study records highest score for adj-R2 about 20% which comes from sub sample partition. This study makes higher result in sub sample, within range of 7%-38% for PB ratio partition. Fifth, this study finds and confirms that accounting fundamentals is related to stock price variability in cross-sectional stock return. This study reminds about the understanding of strong association between accounting fundamentals and stock price variability. This study suggests that not only earnings, but also invested assets should be disclosed immediately to public. The timeliness and comprehensively of firm’s disclosures into capital market could reduce the anomaly of stock price variability. Such policy is expected to repress firm value deviation.
Sixth, confirm to the association between the six related-cash flow factors and stock price variability, this study pinpoints that investors’ trading strategy should revert to accounting fundamentals. They should rely on them. This suggestion complies with current tendency of stock trading strategy, due to fluctuation of stock market and economic uncertainty. This study formulates that accounting fundamentals, they are assets, book value, earnings and others, are the main factor to explain firm value or return. This study argues because it is supported by reported accounting data.
5. Conclusions and Limitations
Conclusions
annual stock return. It can be explained with adoption of cheap alternative resources by lower interest rate. All of examination results confirm the direction as hypothesized. Additionally, sensitivity test based on PB ratio show similar results. This study delivers better degree of return association. However, this result is comparable with previous study which shows low association degree. Nevertheless, this study contributes an incremental explanatory power.
The association between accounting fundamentals and variations of stock price is confirmed as theory categorized by PB ratio. Specifically, high and medium-high PB ratios could explain stock price variability better than lower PB ratio. Within theory level, this study finds empirical evidence of the synergy between adaptation theory and recursion theory. Therefore, investors should not only simply cover information related to earnings and book value, but they should reap to characteristics of investment scalability or invested resources.
This study documents higher degree of association when explaining stock price variability with accounting fundamentals than previous study. It is proven better in sub sample partition, especially with PB ratio. All findings are ended in conclusion that this study verifies that accounting information associates with stock price variability. Additionally, this study comprehends that investors’ trading strategy should revert to accounting fundamentals.
Limitations
Though this limitation is deniable by market-wide regime concept, this study ignores the characteristics of economics, regulations, trading mechanism and cultures among countries. Factually, those factors may affect return model.
Fifth, this study uses earnings after tax so it disregards earnings quality. Earnings quality may affect return model. Nevertheless, this issue is denied because the sample tends to show low PB ratio. It means that this sample usually has good earnings quality. Sixth, this study does not consider conservatism in published financial reports, so that assets may be disclosed lower than they should be. This ex-ante conservatism may affect return model. This study does not consider the conservatism level. Seventh, investment scalability measurement is weak because it only consists of current assets, fixed assets, short term liabilities and long term liabilities. This study ignores that there might be some reserved or construction in progress that may be operated immediately.
References
Abarbanell, Jeffery S., and Bushee, Brian J. (1997). Fundamental Analysis, Future
Earnings, and Stock Returns. Journal of Accounting Research, Vol.: 35 (1), pp. 1-24.
Aboody, David; John Hughes, and Jing Liu. (2001). Measuring Value Relevance in a
(Possibly) Inefficient Market, Journal of Accounting Research, Vol.: 40: (4), pp. 965-986.
Baginski, S.P., and J.M. Wahlen (2003). Residual Income Risk, Intrinsic Value, and Share
Price, The Accounting Review, Vol.: 78 (1), pp. 327-351.
Bao, Ben-Hsien, and Da-Hsien Bao. (1989). An Empirical Investigation of The Association
between Productivity and Firm Value. Journal of Business Finance and Accounting, Vol.: 16 (5), pp. 699-717.
Bhattacharya, N., E. Black, T. Christensen, and C. Larson. (2003). Assessing the Relative Informativeness and Permanence of Pro forma Earnings and GAAP Operating Earnings. Journal of Accounting and Economics, Vol.: 36, pp. 285–319.
Beaver, W. H. (1999). Comments on: An Empirical Assessment of The Residual Income
Valuation Model. Journal of Accounting and Economics, Vol.: 26, pp. 34-42.
Beaver, W., R. Lambert, and D. Morse (1980). The Information Content of Security Prices.
Journal of Accounting and Economics, Vol.: 2 (March), pp. 3-28.
Bradshaw, Mark T., Scott A. Richardson, and Richard G. Sloan. (2006). The Relation
Bradshaw, M. and R. Sloan. (2002). GAAP versus the Street: An empirical assessment of two alternative definitions of earnings. Journal of Accounting Research, Vol.: 40, pp. 41–66.
Burgstahler, D., and Dichev, I. (1997). Earnings, Adaptation, and Equity Value. The
Accounting Review, Vol.: 73, pp. 187–215.
Chen, Peter, and Guochang Zhang. (2007). How Do Accounting Variables Explain Stock
Price Movements? Theory and Evidence. Journal of Accounting and Economics, Vol.: 43, pp. 219-244.
Cohen, Daniel A., and Thomas Z. Lys. (2006). Weighing The Evidence on The Relation
between External Corporate Financing Activities, Accrual and Stock Return. Journal of Accounting and Economics, Vol.: 42, pp. 87-105.
Collins, D. W., E. L. Maydew, and I. Weiss (1997). Changes in Value-Relevance of
Earnings and Book Values over The Past Forty Years. Journal of Accounting and Economics, Vol.: 24 (1), pp. 39-67.
Collins, D. W., Morton Pincus, and Hong Xie. (1999). Equity Value and Negative
Earnings: The Role of Book Value of Equity. The Accounting Review, Vol.: 74 (1), pp. 29-61.
Copeland, T., Dolgoff, A., and Moel, A. (2004). The Role of Expectations in Explaining The Cross-section of Stock Returns. Review of Accounting Studies, Vol.: 9, pp. 149– 188.
Conrad, J., B. Cornell, & W.R. Landsman, (2002). When Is Bad News Really Bad news? Journal of Finance, Vol.: 57 (6).
Danielson, Morris G., and Thomas D. Dowdell. (2001). The Return-Stages Valuation
Model and the Expectations within a Firm's P/B and P/E Ratios, Financial Management, Vol.: 30, (2), pp. 93-124 (Summer).
David, A., (1997). Fluctuating Confidence in Stock market: Implication for Return and
Volatility. Journal of Financial and Quantitative Analysis, Vol.: 32 (December), pp.: 427-482.
Dogramaci, A. (1981), Perspectives on Productivity, in Productivity Analysis, edited by A.
Dogramaci (Martinus Nijholf, 1981), pp. 1-23.
Drucker, P. (1986), If Earnings Aren't the Dial to Read, Wall Street Journal, No.: 30, pp. 1–
32, (October).
Easton, Peter D., and Harris, Trevor S. (1991). Earnings As an Explanatory Variable for Returns, Journal of Accounting Research, Vol.: 29, (1), pp. 19-36 (Spring).
Feltham, G., and Ohlson, J. (1995). Valuation and Clean Surplus Accounting for Operating
and Financing Activities. Contemporary Accounting Research, Vol.: 11, pp. 689–731.
Feltham, G., and Ohlson, J. (1996). Uncertain Resolution and The Theory of Depreciation
Measurement. Journal of Accounting Research, Vol.: 34, pp. 209–234.
Financial Accounting Standards Board. (1978). Statement of Financial Accounting