CHAPTER IV
RESEARCH FINDINGS AND DISCUSSION
A.Data Findings
Data collecting activity was conducted in 25st September, 2014. The
sample was B class of Writing II Subject of the Third Semester students of
English Education Study Program of STAIN Palangka Raya in Academic Year
2014/2015”. The students were given a task. They were required to translate,
make own sentences and fill the blank.
The researcher used interater in analyzing the writing product. This
activity was conducted to minimize subjective effect. There were total two
examiners, the researcher was helped by Mr. Ismail Yakub, S.Pd. in scoring the
students’ writing products. The displayed data below is the cross check of those
two examined writing products. The error which is displayed detected at least of
two examiners.
1. The Result of Pre Test
In this section, the data obtained of pretest. The pretest was taken on
Thursday, 25st September, 2014 at 09.00 – 09.30 in class B of third semester.
They were 20 students who followed this test. The pretest scores were
Table 4.1 Description of Pre Test Scores of the Data Achieved by the Students
The distribution of students’ pretest scores can also be seen in the
following figure.
Figure 4.1 Histogram of Frequency Distribution of Pre Test Scores
NO. STUDENTS'
CODE
RATER I
RATER II
FINAL SCORE
2 APR 50 55 52.5
10 ARF 25 15 20
3 BLA 35 40 37.5
4 DBI 40 40 40
5 DWK 60 60 60
7 FJR 40 25 32.5
17 HDJ 40 40 40
8 ITN 40 55 47.5
9 KRW 40 45 42.5
11 MLN 35 45 40
6 NDR 75 65 70
1 NWT 35 35 35
12 PTR 40 45 42.5
13 RML 45 55 50
15 RMY 30 25 27.5
14 RNI 55 60 57.5
18 SSI 35 50 42.5
16 STI 40 55 47.5
19 TTS 70 70 70
The figure 4.1 showe the pretest scores of students. It can be seen that
there were 17 students got score 20-59. There was one student got 60-69, there
were two students got 70-79.
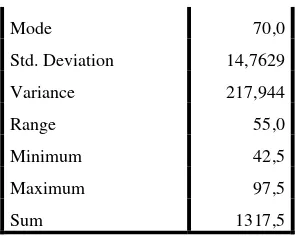
Table 4.2
The Table of Calculation of Mean, Standard Deviation, and Standard Error of Mean of Pre Test Scores in Experiment Group
Using SPSS 22 Programs
Statistics SCORE
N Valid 20
Missing 0
Mean 44.000
Std. Error of Mean 2.9879
Median 42.500
Mode 40.0a
Std. Deviation 13.3624
Variance 178.553
Range 50.0
Minimum 20.0
Sum 880.0
2. The Result of Post Test
This section, it was described the obtained data of improvement the
students’ writing scores after taught using module of preposition of time. The
post test was taken on Saturday, 16st October 2014 at 09.00 – 09.30 in class B
of third semester. They were 20 students who followed this test. The post test
scores were presented in table 4.3.
Table 4.3
The Description of Post Test Scores of the Data Achieved by the Students
The
distributi
on of
students’
post test
scores
can also
be seen
in the
followin
g figure. NO
.
STUDENTS'
CODE RATER I RATER II
FINAL SCORE
2 APR 70 70 70
10 ARF 70 60 65
3 BLA 70 65 67.5
4 DBI 50 50 50
5 DWK 80 85 82.5
7 FJR 65 55 60
17 HDJ 70 45 57.5
8 ITN 65 60 62.5
9 KRW 65 60 62.5
11 MLN 70 70 70
6 NDR 100 95 97.5
1 NWT 70 50 60
12 PTR 65 85 75
13 RML 65 70 67.5
15 RMY 40 50 45
14 RNI 65 75 70
18 SSI 35 55 45
16 STI 70 75 72.5
19 TTS 95 95 95
Figure 4.2 Histogram of Frequency Distribution of Post Test Scores.
The figure 4.2 show the post test scores of students of experiment group. It
could be seen that there were five students got score 40-59. There were seven
students got score 60-69. There were five students got score 70-79. And there
were three students got score 80-90.
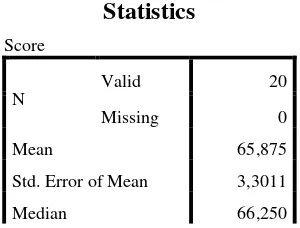
Table 4.4
The Table of Calculation of Mean, Standard Deviation, and Standard Error of Mean of Post Test Scores in Using SPSS 22 Programs.
Statistics
Score
N
Valid 20
Missing 0
Mean 65,875
Std. Error of Mean 3,3011
3. The Comparison of Final Scores between Pre Test and Post Test
Based on the data above, it could be seen the comparison in Table 4.5.
Table 4.5
The Description of Pre and Post Test Scores of the Data Achieved by the Students
Mode 70,0
Std. Deviation 14,7629
Variance 217,944
Range 55,0
Minimum 42,5
Maximum 97,5
Sum 1317,5
N O.
STUDE NTS' CODE
RATER I RATER II AVERAGE
OF PRE TEST SCORE AVERAGE OF POST TEST SCORE PRE TEST POST TEST PRE TEST POST TEST
2 APR 50 70 55 70 52.5 70
10 ARF 25 70 15 60 20 65
3 BLA 35 70 40 65 37.5 67.5
4 DBI 40 50 40 50 40 50
5 DWK 60 80 60 85 60 82.5
7 FJR 35 65 30 55 32.5 60
17 HDJ 40 70 40 45 40 57.5
8 ITN 40 65 55 60 47.5 62.5
9 KRW 40 65 45 60 42.5 62.5
11 MLN 35 70 45 70 40 70
6 NDR 75 100 65 95 70 97.5
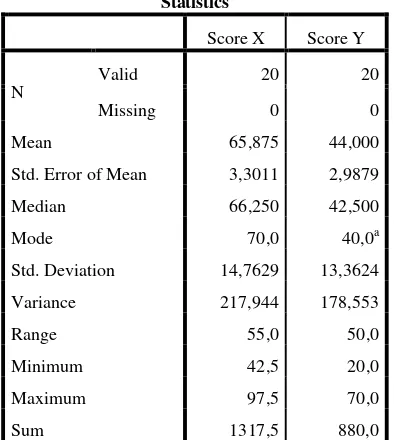
Table 4.6 TTabl Table 4.6
The Calculation of Mean, Standard Deviation, and Standard Error of Mean Pre Test and Post Test Scores in Using SPSS 22
Programs.
Statistics
Score X Score Y
N
Valid 20 20
Missing 0 0
Mean 65,875 44,000
Std. Error of Mean 3,3011 2,9879
Median 66,250 42,500
Mode 70,0 40,0a
Std. Deviation 14,7629 13,3624
Variance 217,944 178,553
Range 55,0 50,0
Minimum 42,5 20,0
Maximum 97,5 70,0
Sum 1317,5 880,0
4. Testing Hypothesis Using SPSS 22 Program
The writer applied SPSS 22 program to calculated ttest in testing
Hypothesis of the study. The result of the ttest using SPSS 22 program was
described in Table below.
12 PTR 40 65 45 85 42.5 75
13 RML 45 65 55 70 50 67.5
15 RMY 30 40 25 50 27.5 45
14 RNI 55 65 60 75 57.5 70
18 SSI 35 35 50 55 42.5 45
16 STI 40 70 55 75 47.5 72.5
19 TTS 70 95 70 95 70 95
Table 4.7
Standard Deviation and Standard Error of Y and X Group statistic
Group Statistics
Code N Mean Std. Deviation Std. Error Mean
Score
X 20 65,875 14,7629 3,3011
Y 20 44,000 13,3624 2,9879
Table 4.8
The Calculation ttest Using SPSS 22 Independent Samples Test
Since the result of Test between pretest and post had difference scores of
variance, it was found that the result of tobserved was 4.913.
To examine the truth or false of null hypothesis stating that using Module
of Preposition of Time did not increase the third semester students’ writing
scores, the result of ttest was interpreted on the result of degree of freedom to
Levene's Test for Equality of
Variances
t-test for Equality of Means
F Sig. T Df Sig.
(2-tailed) Mean Differen ce Std. Error Differe nce 95% Confidence Interval of the
Difference
Lower Upper
S c o r e Equal variances assumed
,041 ,840 4,913 38 ,000 21,8750 4,4525 12,8614 30,8886
Equal variances
get the ttable. The result of degree of freedom (df) was 38, it was found from the
total number of students in both group minus 2.
Table 4.9
The Result of tobserved and ttable/ttest
Variable tobserved
ttable
Df
5% 1%
Y-X 4.913 2.042 2.750 38
The interpretation of the result of ttest using SPSS 22 Program, it was found
the tobserved was greater than the ttable at 1% and 5% the level significance or
2.042 < 4.913 > 2.750. It could be interpreted based on the result of calculation
that Ha stating that “the students taught by Module of Preposition of Time gain
better writing achievement” was accepted and Ho stating “the students was
taught by Module of Preposition of Time did not gain better writing
achievement” was rejected. It meant that teaching writing by using Module of
Preposition of Time increases the third semester students’ writing scores at
STAIN of Palangkaraya.
B. Types Error of Using Preposition of Time
1. Identification Types Error of Using Preposition of Time in Pretest
Table. 4.10
Types of Errors in Pretest
O
OMISSITION OF
PREPOSITION INSERTION
OF PREPOSITION
SELECTIONS OF INCORRECT PREPOSITION
OTHERS
ON IN AT
1 APR - 6 - - - 6 12
2 ARF 2 1 - - 1 7 11
3 BLA 5 6 - - 2 2 15
4 DBI 2 4 1 - 2 7 16
5 DWK 1 4 1 - 1 3 10
6 FJR 2 6 - 2 5 15
7 HDJ 1 5 1 - 3 4 14
8 ITN 1 6 3 - - 3 13
9 KRW - 5 1 - 4 5 15
10 MLN 1 5 2 - 4 2 14
11 NDR - 2 2 1 - 1 6
12 NWT 3 5 1 - 3 4 16
13 PTR 1 3 1 - 6 1 12
14 RML 1 5 1 - 2 4 13
15 RMY 1 5 1 - 3 6 16
16 RNI 1 5 1 - - 2 9
17 SSI 1 6 1 - 1 4 13
18 STI 2 3 3 - 2 4 13
19 TTS 1 2 1 - - 2 7
20 WND 1 1 3 - 2 7 14
TOTAL 27 85 24 1 38 79 254
PERCENTA GE
10.6 2%
33.4 6%
9.4
4% 0.39% 14.96% 31.10% 100%
Based on the table above the type of error frequency high to low is
Addition: Simple Omission of Preposition by 53.46 %, Others: by 31.10 %,
Selections of Incorrect Preposition by 14.96 %, and Insertion of preposition: by
0.39 %.
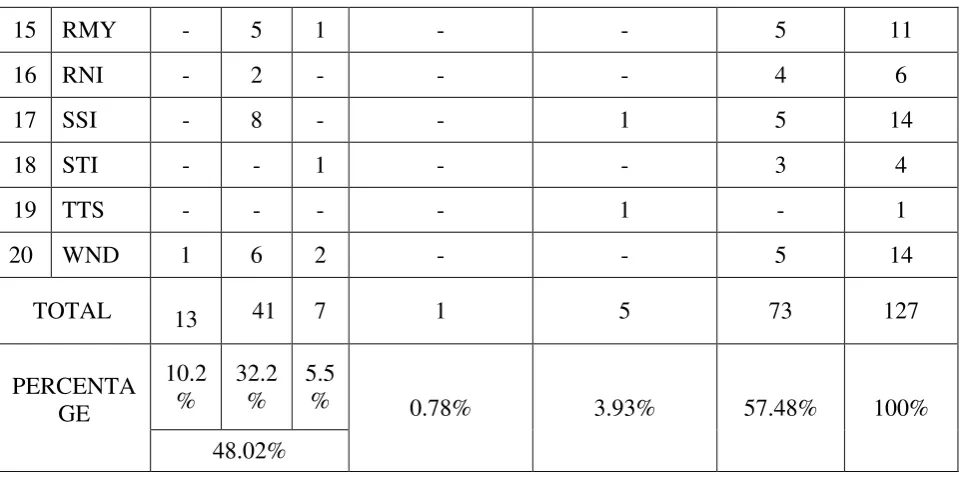
2. Identification Types Error of Using Preposition of Time in Post Test
Table. 4.11
Types of Errors in Post Test
N
O CODE
TYPE OF ERROR
TOTAL OMISSITION OF
PREPOSITION INSERTION
OF PREPOSITION
SELECTIONS OF INCORRECT PREPOSITION
OTHERS
ON IN AT
1 APR - 1 - - 1 5 7
2 ARF 1 1 - - 1 3 6
3 BLA 1 - - - - 4 5
4 DBI 1 5 - - - 4 10
5 DWK - - - 4 4
6 FJR 2 - 2 - - 3 7
7 HDJ - - - 6 6
8 ITN 1 4 1 - - 2 8
9 KRW 2 4 - - - 3 9
10 MLN 1 - - - - 5 6
11 NDR - - - 1 1
12 NWT 1 2 - - - 3 6
13 PTR 2 - - 1 - 4 7
15 RMY - 5 1 - - 5 11
16 RNI - 2 - - - 4 6
17 SSI - 8 - - 1 5 14
18 STI - - 1 - - 3 4
19 TTS - - - - 1 - 1
20 WND 1 6 2 - - 5 14
TOTAL 13 41 7 1 5 73 127
PERCENTA GE
10.2 %
32.2 %
5.5
% 0.78% 3.93% 57.48% 100%
48.02%
Based on the table above the type of error frequency high to low is
Addition: Simple Omission of Preposition by 48.02. %, Others: by 57.48 %,
Selections of Incorrect Preposition by 3.93 %, and Insertion of preposition: by
0.78 %.
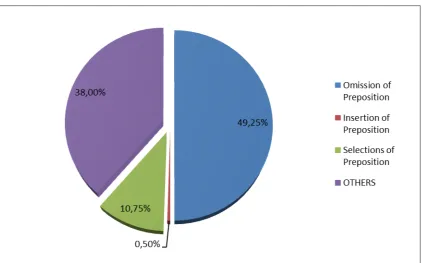
3. The Calculation Types Errors in Pretest and Post Test
Table 4.12
The Calculation Types and Frequency of Problems in Using Preposition of Time in Pre Test and Post test
Type of Preposition
Type of Problems
Pretest Scores
Posttest
score Percentage
F F
Preposition
of Time Omission of
Preposition 136
61 49.25%
Insertion of
Selection of Incorrect Preposition
38 5 10.75%
- Others
79 73 38.00%
TOTAL ∑400 100%
Based on the tables of errors types above, the highest types of error in
using preposition of time made by students in pretest and pos test was
Omission of Preposition with the frequency 197 (49.25%). The second was
Others with the frequency 152 (38.00%), the third was selections of Incorrect
Preposition with the frequency 43 (10.75%) and the last was insertion of
Preposition with the frequency 2 (0.50%)
The result of the table mentioned above has collected some important
information from the student’s writings. The study reveals errors that the students made in using preposition of time.
first, Omission of preposition, learners fail to use a preposition in a
sentence where it is obligatory that’s mean some students admitted that they
are confused and got difficulties in applying the function preposition of time in
a sentence because they thought that there are few prepositions which are
different but have the same meaning with the frequency 197 (49.25%).
For examples:
At: I usually do the homework in night; it should be I usually do the
homework at night/ at midnight
On: I got many gifts in my birthday, it should be, I got many gifts on my birthday
Second, Insertion of Preposition – learners add on preposition in a sentence where it is not needed with frequency 2 (0.50%).
For example: I will go home on the next week,
Third, learners use the wrong preposition in a sentence. There are just a
few instances of this error category, they are confused and got difficulty to find
out the right preposition in a sentence with the frequency 43 (10.75%). There are
many prepositions and they are generally different but sometimes have the same
meaning. For examples:
The Direction was making own sentence in using preposition of time
Student A: I live at G.obos Street
Student B: Udin puts the flowers on the table
Student C: Diana studies in universities Indonesia
And the last, Others or Grammatical Errors, these errors side of three types
of preposition of time that made by the students in writing, with frequency 152
(38.00%).
For example:
My favorite TV program start at 10.00, it should be, my favorite TV
The Frequency and Percentage of Difficulties in using preposition of time
in figure 4.6
From those reasons, it could be concluded that the students do not fully
understand on the use preposition of time. Although they had been taught about it
before, they were still confused which one to use when making preposition of
time in sentence.
C.Solution Going Toward
The Writer used a Module of preposition of time as Solution gave tests
then questioners to know students opinion in determining as good characteristics
of module.
Table. 4.13 Students Test Scores
CODE Test 1 Test 2 Test 3 Avarege
ARF 7 5 7 6,33
BLA 6 8 8 7,33
DBI 7 8 8 7,67
DWK 7 8 8 7,67
FJR 7 5 10 7,33
HDJ 7 6 10 7,67
INT 8 10 10 9,33
KRW 8 7 10 8,33
MLN 6 4 9 6,33
NDR 9 `10 10 9,50
NWR 8 9 6 7,67
PTR 9 10 10 9,67
RML 5 3 8 5,33
RMY 6 8 8 7,33
RNI 6 10 8 8,00
SSI 9 7 0 5,33
TTS 9 10 10 9,67
WND 6 3 8 5,67
Based on the tables of Tests Scores above, there were 3 students got
<60 and there were 17 students got >60.
Table 4.14 Questioners Statistics
CODE
ITEM 1
ITEM 2
ITEM 3
ITEM 4
ITEM 5
APR 4 4 4 3 4
ARF 5 4 4 4 4
BLA 4 3 4 3 4
DBI 4 5 5 4 4
DWK 4 4 3 4 5
FJR 4 3 3 5 4
HDJ 3 4 4 3 3
INT 4 4 4 3 4
KRW 4 3 4 2 3
MLN 3 4 4 3 4
NDR 5 4 4 4 5
NWR 4 3 4 3 4
PUTRI 4 4 4 4 4
RML 4 4 3 4 4
RMY 3 4 3 4 4
RNI 4 4 4 4 3
SSI 3 4 3 2 3
STI 3 4 3 4 4
TTS 5 3 5 4 5
WND 3 4 3 4 3
TOTAL
Percentage 77% 76% 75% 71% 78%
The percentage of collaborative categorization of data independence
concerning student motivation, initiative and creativity, discipline and
responsibility student responsibility for learning is:
- 81% -100%: very independent
- 61% -80%: independent
- 41% -60%: quite independently
- 21% -40%: less independent
- 0% -20%: very less independent
Based on data above, percentage for good characteristics of module was
Independent or good.
D.Discussions
The main purpose of the study is to describe the errors types of using
preposition of time and the effect using module as solusition on writing made by
third semester of STAIN Palangka Raya.
The finding of the research in classifying errors using preposition of time
on, in and at faced by the third semester STAIN of Palangka Raya , the types of
errors are made by students in using preposition of time were Omission of
Preposition with the frequency 197 (49.25%). The second was Others or
Incorrect Preposition with the frequency 43 (10.75%) and the last was insertion of
Preposition with the frequency 2 (0.50%)
Then The result of the data analyzes showed that the module in using
preposition of time gave significance effect on the students’ writing scores for the
Third Semester of STAIN Palangka Raya. It was proved by the mean scores of the
students who were taught using the module in using preposition of time was 65.87
and the students who were taught without using the module in using preposition
of time was 44.00.
Those statistical findings were suitable with the theories as mentioned
before
There are three types of errors in relation to the use of preposition
1. Omission of Preposition – learners fail to use a preposition in a sentence where it is obligatory. For example: Facebook was created at 2008 by a younger man
2. Insertion of Preposition – learners add on preposition in a sentence where it is not needed. For example: we will not regret on the next week
3. Selections of Incorrect Preposition- learners use the wrong preposition in a sentence. There are just a few instances of this error category. For example: we
can do some business on Facebook on the free time or as a career1.
Module by Suryosubroto is printed teaching materials are designed to be
studied independently by the participants learning. The module is also called
the media for independent study because it has been equipped with instructions
for self-study. That is, the reader can do without the presence of the teaching
1
and learning activities directly. Language, patterns, and the nature of other
requirements contained in this module is arranged so that it may seem like a
"language teacher" or a language teacher who is giving instruction to his
students. So from that, the media is often called self-instructional materials.
Teachers do not directly give lessons or teach something to the students with
face-to-face, but enough with these modules. The module is a tool or learning
tool containing materials, methods, limitations, and how to evaluate systematic
designed and attractive to achieve expected competencies in accordance with
the level of complexity2.
There are reasons why using Module preposition of time gives effect on
the third semester of IAIN Palangka Raya. First, Self-instructional, Students
are able to learn by themselves, do not depend on others. Second,
Self-contained, whole matter of learning from one unit of competency is studied
contained in one complete module. Third, Stand-alone module developed is not
dependent on any other media or should not be used together with other media.
Fourth, Adaptive, adaptive power module should have a high level of
development of science and technology. Fifth, User friendly, modules should
also meet the rules of familiar friends / familiar with the wearer.
2