The Joint Determination of Leverage and Maturity:
Empirical Evidence from Malaysia
Rini Aprilia STIE MDP [email protected]
Abstract: This study empirically investigates the simultaneity between leverage and debt maturity policies and the factors that influences them by using a simultaneous equation framework in which leverage and debt maturity are endogenous variables. Based on a panel data of 788 non-financial firms listed on Bursa Malaysia from 1999 until 2010. The simultaneity between leverage and debt maturity is tested by utilizing a two-stage least squares (2SLS) regression model. The results of this study show that leverage and debt maturity policies have a negative simultaneous relationship which indicates that there are strategic complementarities between leverage and maturity. This study also documents different results among the exogenous variables in both equations, in which growth opportunities, regulation, firm size, profitability and tangibility lend considerable support to the proposed hypotheses on the leverage equation. Meanwhile, firm size, regulation, abnormal earnings and tangibility are found to have significant effects on the debt maturity equation.
Keywords: simultaneity, capital structure, debt maturity.
Abstrak : Penelitian ini secara empiris menyelidiki simultanitas antara leverage dan maturitas hutang serta faktor –
faktor yang mempengaruhinya dengan menggunakan kerangka persamaan simultan yang mana leverage dan
maturitas hutang adalah variabel endogen. Berdasarkan data panel terdapat 788 perusahaan terdaftar di Bursa Malaysia dari tahun 1999 sampai dengan 2010, tidak termasuk perusahaan yang bergerak di industri keuangan. Simultanitas antara leverage dan maturitas hutang diuji dengan menggunakan regresi model two stage least squares (2SLS). Hasil dari penelitian ini menunjukkan bahwa leverage dan maturitas hutang memiliki hubungan simultanitas
negatif yang menunjukkan bahwa terdapat hubungan yang komplementer anatara leverage dan maturitas hutang.
Penelitian ini juga menunjukkan hasil yang berbeda antara variable eksogen dalam kedua persamaan tersebut, yang
mana growth opportunities, regulation, firm size, profitability, dan tangibility memberikan dukungan yang penuh
terhadap hipotesis yang diajukkan pada persamaan leverage. Disisi lain pula, firm size, regulation, abnormal return, dan tangibility ditemukan memiliki pengaruh yang signifikan terhadap persamaan maturitas.
Kata kunci : simultanitas, struktur modal, maturitas hutang.
1. INTRODUCTION
In principle, every company needs funding and the fulfillment of these funds may come from internal sources or external sources. The selection of the financial structure is a matter which concerns the composition of funding that will be used by a company. This will then determine how much debt will be incurred to finance its assets.
Capital structure which forms the basis for permanent funding consists of long-term
debt, preferred stock and shareholders’ equity.
Leverage and debt maturity are the twin dimensions that cannot be separated from the corporate capital structure, in other words, when a firm issues new debt, it needs to decide the period of maturity and the size of the debt level maturity structure should be considered simultaneously.
Barclay, Marx, and Smith (1997) is the pioneering study in examining the simultaneity between the policies on leverage and debt maturity among U.S. firms based on a simultaneous equations framework. Their findings reveal strategic complementarities between maturity and leverage. Using a different system of simultaneous equations, Barclay et al. (2003) show that although leverage and maturity are strongly correlated in terms of both unconditional and conditional correlations, there is evidence that both leverage and debt maturity are not complements. They, however, note that their model is possibly misspecified. Stohs and Mauer (1996) argue the findings by Barclay and Smith (1995) on the relationship between debt maturity and growth opportunities are misspecified because they do not control the differences in leverage in their ordinary least squares (OLS) debt maturity regression. When Stohs and Mauer (1996) add leverage to the right hand side of their debt maturity regression, they discover that coefficient on the growth opportunities variable has a statistically significant positive relationship.
Therefore, it is improper to take one as predeterminant when analyzing how firms choose the other. The coefficients estimated in the OLS regression of debt maturity model on the leverage and others variables will suffer from simultaneous equation bias (Barclay et al., 2003).
Even though, Barclay et al. (2003) find that the coefficient on debt maturity in the leverage and Sunarsih (2004) suggest a positive relationship between leverage and maturity, implying leverage and maturity are complementary to each other and there is simultaneity between leverage and debt maturity policies. Johnson (2003), however, finds a negative relationship between leverage and short-term debt.
Other subsequent empirical studies by Elyasiani et al. (2002), Johnson (2003), Sunarsih (2004) and Billett, King, and Mauer (2007) provide evidences of strategic complementarities between leverage and maturity. Based on these models of simultaneous equations framework, this study attempts to examine the simultaneity between the policies on leverage and debt maturity among Malaysian public-listed firms during the period from 1999 to 2010.
The remaining of this study is structured as follows: the next section presents the reviews of theoretical literatures and past empirical studies. Thereafter, the research framework and hypothesis, which are constructed from the formulated research, are presented in section three, while section four discusses the empirical findings and provides the potential explanation of the results. Finally last section will concludes the overall research with some suggestions for further research in this field.
2. THEORETICAL LITERATURE AND
HYPOTHESIS DEVELOPMENT
This part discusses the relationship between the control variables on leverage and debt maturity. This will enable conclusions to be made on the influences of each variable on the leverage and debt maturity. This part also tests the hypothesis formulated for each variable.
leverage and longer term debt maturity. These simultaneous equation results are consistent with the single equation model done by Barclay and Smith (1995) who find that firms with longer maturity have higher leverage. The relationship is also consistent with Stohs and Mauer (1996) and Barclay et al. (1997) that find negative relationship between leverage and short-term maturity or positive relationship between leverage and long-term maturity.
For others explanatory variables there have been a great deal of research into both capital structure theory and debt maturity theory, but relatively little into how the two theories may relate to each other. In order to lay a theoretical framework for this study, a review of capital structure theory and debt maturity theory literature should be done independently. These studies also explore how and why existing researches suggest that there might be a link between the two proxies.
2.1. Theoretical Literature Under Leverage Theoretical researches generally suggest that leverage is significantly positive to growth opportunities. According to signaling theory, high performing firms are capable of using more leverage financing since leverage has its dead weight costs, which make less valuable firms more likely to fall into bankruptcy (Chen, 2004). The signaling theory predicts that firms with higher earnings with good growth prospect will use higher leverage.
Several studies have been conducted to determine whether there is a relationship between leverage and firm size. Titman and Wessels (1998), Crutchley and Hansen (1989) and Rajan and Zingales (1995) argue that the possibility of a large company that went bankrupt is small, so size has a positive effect on the level of debt taken.
Elyasiani et al. (2002) state that if firms with NOLs have low tax benefits of debt, a negative relationship can be expected between NOLs and leverage. Firms with higher net operating loss will have lower leverage to enable them to manage their debt and pay it on time.
Generally, leverage is negatively correlated to NOLs dummy. This is a direct implication of the trade-off theory of Deangelo and Masulis (1980).
Capital structure also plays an important role in assessing regulation due to the interaction between the investment and financial decisions of a regulated firm and also the pricing choices of regulators (Spigel&Spulber, 1994). A number of studies suggest that rate regulation creates an incentive for regulated firms to increase their level of debt and there exists a positive relationship between regulated firms and leverage.
This study also looks at the relationship between the signaling effects of debt by using the abnormal earnings as a proxy of signaling effect. According to signaling theory, firms with higher returns always optimize their leverage because higher returns always give positive signal to the market (Flannery, 1986 & Diamond, 1993). Optimism of companies about the future will be indicated by an increase in the stock price.
According to the pecking order theory, profitability negatively affects leverage (Myers, 1977). This is supported by Megginson (1997) who suggests the tendency of profitable firms to have an inverse relation with leverage. In other words,
2.2. Theoretical Literature Under Debt Maturity In general, firms with higher growth opportunities prefer to use smaller proportion of long-term debt whereby they control their underinvestment activities and agency cost through short-term debt (Myers, 1977 &Ozkan, 2002). Their finding was consistent with Arslan and Karan (2006) whereby the coefficient was negatively significant in their study. They state that firms with greater growth opportunities prefer to use shorter maturity to solve the underinvestment problem. Leland and Thoft (1996) show that the optimal maturity. Thus, small firms are expected to use less long-term debt than the larger firms. Titman and Wessels (1998) state that the possibility of large companies getting into bankruptcy is small and thus, it can positively affect the level of debt taken by the companies. Large firms, in general, tend to have more stable cash flows and more diversified assets. This means that large companies will use long-term debt more than small companies do. The latter prefer to use short-term debt maturity.
Johnson (2003) argues that firms that have greater net operating loss carryforwards tend to use short-term debt maturity. It means that there is a negative relationship between NOLs dummy and the debt maturity. If firms with NOLs have low tax benefits of debt, the negative coefficient will affect the debt maturity.
Barclay et al. (2003) state that optimal debt maturity should be longer for regulated firms
because regulatory control restrict managers’
discretion over corporate investment decisions and thereby able to control aspects of underinvestment issues. The positive relationship between regulated dummy and debt maturity is also supported by Barclay and Smith (1995) who argue that regulated
firms can borrow longer leverage due to less discretion in investment decision, and also less agency problem. Flannery (1986) argues that utility firms are expected to issue longer term debt maturity than other industrial firms.
Based on the signaling theory, companies with higher returns will give positive signal to the market. Hence, firms with positive information about future prospect prefer to use short-term debt that can be refinanced after information is revealed (Flannery, 1986). According to signaling theory, the selection of maturity structure selected by managers will provide useful information to investors.
This study also sees the relationship between asset maturities against debt maturity. If the debt has a maturity that is longer than the maturity of its assets, then there is a tendency for companies that do not have enough cash to pay debts until it matures. Conversely, if the debt has a maturity shorter than maturity of its assets, then fall due; in other words, when the maturity of debt is longer than its asset maturity, the firm will have debt obligations to meet while cash flows from asset stop. Therefore, the following hypothesis is tested that asset maturity has positive relationship with debt maturity.
Table 1: Summary of Hypothesis Leverage Equation
H1a Debt maturity has a positive effect on leverage
H2 Growth opportunities have a positive effect on leverage
H3 Firm size has a positive effect on leverage H4 NOL has a negative effect on leverage
Table 1: Continued Leverage Equation
H6 Abnormal earnings has a positive effect on leverage
H7 Profitability (ROA) has a negative effect on leverage
H8 Tangibility has a positive effect on leverage
Debt Maturity Equation
H1b Leverage has a positive effect on debt maturity
H9 Growth opportunities have a negative effect on debt maturity
H10 Firm size has a positive effect on debt maturity
H11 NOL has a negative effect on debt maturity
H12 Regulated firm has a positive effect on debt maturity
H13 Abnormal earnings has a negative effect on debt maturity
H14 Asset maturity has a positive effect on debt maturity
H15 Term structure has a positive effect on debt maturity
Source: Based on past related study
According to tax hypothesis, the firm’s
debt maturity will increase with the slope of the yield and they are expected to have a positive relationship, which are supported by Barclay and Smith (1995) and Stohs and Mauer (1996). Kim et al. (1995) state that the increase in the slope of term structure and the interest rate volatility can make firms to choose longer term debt maturity in their capital structure. Hence, term structure is expected to have a positive relationship to debt maturity.
3. METHODOLOGY
The financial data are obtained from DataStream and the industrial classifications are derived from Bursa Malaysia. The data for month-end yields of Malaysian Government Securities
(MGS) and Treasury-bills (T-bills) are sourced
from the Bank Negara Malaysia’s website. The
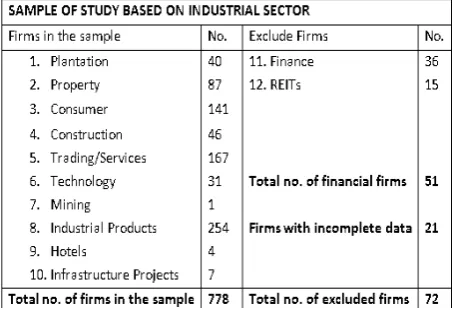
population of this study consists of companies listed on Bursa Malaysia from 1999 to 2010. The total number of listed companies is 850 from 12 different industrial sectors, namely plantation, property, consumer, construction, trading/services, technology, mining, industrial products, hotels, infrastructure project, finance and Real Estate Investment Trusts (REITs).
The sample is derived based on a purposive sampling technique. This technique is used to select the sample based on specific criteria and certain consideration adjusted to the purpose of study. The initial sample used in this study comprises of 850 companies listed on Bursa Malaysia.
Table 2: List of Sample Data
Source: Data stream
3.1. Analytical Techniques
This technique is used to test the simultaneity between leverage and debt maturity as the dependent variables in order to determine the relationship of the two policies and the independent variables such as growth opportunities, regulated firm, firm size, NOL carryforwards, abnormal earnings, profitability, tangibility, asset maturity, and term structure that affect leverage and debt maturity. The basic model of leverage and debt maturity equation is formulated as follows:
Where:
3.2 Variables
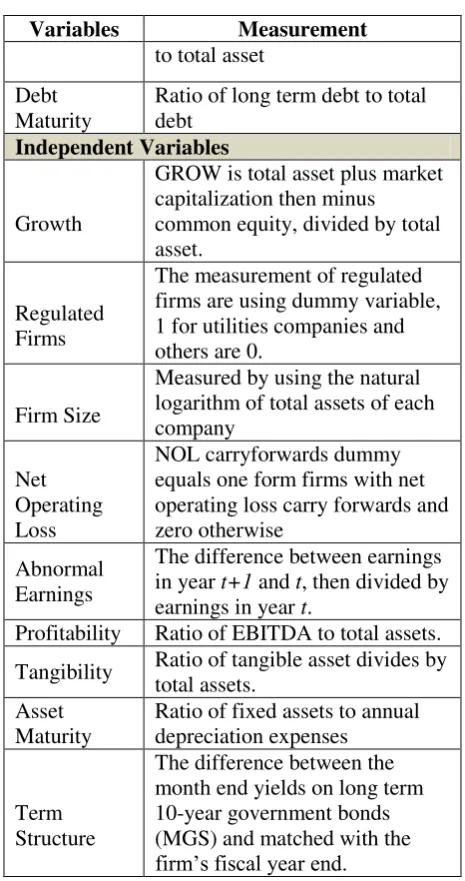
Based on the research problems and development of hypotheses, the variables that are examined in this study and their measurement are largely adopted from existing literature. The dependent variables are leverage and debt maturity; the explanatory variables include growth opportunity, regulated firms, firm size, NOLs, abnormal earnings, profitability, tangibility, asset maturity and term structure. The definition of these variables is listed in table 4.
Table 4: Measurement of Variables
Variables Measurement
Dependent Variables
Leverage Ratio of book value of total debt
Variables Measurement
to total asset
Debt Maturity
Ratio of long term debt to total debt
Independent Variables
Growth
GROW is total asset plus market capitalization then minus
common equity, divided by total asset.
Regulated Firms
The measurement of regulated firms are using dummy variable, 1 for utilities companies and others are 0.
Firm Size
Measured by using the natural logarithm of total assets of each company
Net Operating Loss
NOL carryforwards dummy equals one form firms with net operating loss carry forwards and zero otherwise
Profitability Ratio of EBITDA to total assets.
Tangibility Ratio of tangible asset divides by total assets.
Asset Maturity
Ratio of fixed assets to annual depreciation expenses
Term Structure
The difference between the month end yields on long term 10-year government bonds (MGS) and matched with the
firm’s fiscal year end.
Source: Secondary data that has been processed 2012
4. RESULTS AND DISCUSSION
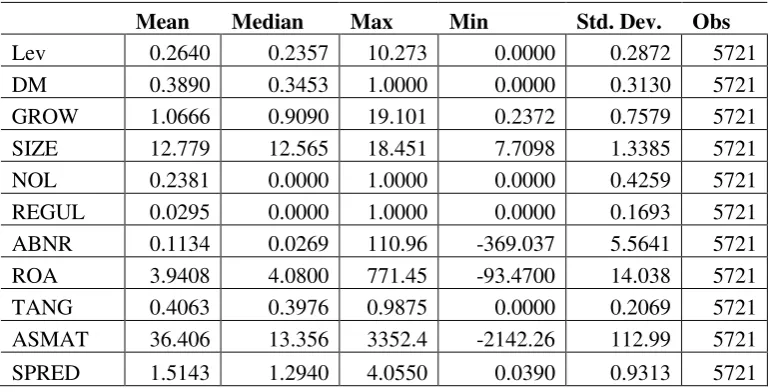
4.1. Summary Statistics and Correlation Matrix of Variables
Mean (Median) leverage is 0.26 (0.24), it means that on average, Malaysian firms only use 26.00% as leverage to finance their project. The mean for debt maturity is 0.39 which means that on average, the long term debt represent 39% of the total debt incurred by Malaysian firms. For growth opportunities, the mean is about 1.07, which signifies that investment opportunity is high in Malaysia. It is in line with a study conducted by Jensen (1986) which finds that firms with higher investment opportunity usually have high growth, active in investment, lower free cash flow and lower asset in place.
The mean of regulated firm is 0.03 with standard deviation about 0.17 which signals that the distribution of data is not normal. This also means that the utility firms or other regulated firms in Malaysia is relatively fewer in number than non-regulated firms. The abnormal earnings variables which are tested to see the signaling effect have an average figure of about 0.11 with the minimum
value at -369.03 and the maximum value at 110.96. This data shows abnormal distribution and can produce biased result as well. Meanwhile, the mean figure of ROA stands at 3.94 with a standard deviation of 14.04, indicating that the firms are highlyprofitable. The average tangibility figure is 0.41 with a standard deviation of 0.21; this means that the data is normally distributed.
In addition, the means of asset maturity and term structure among Malaysian firms stand at 36.40 and 1.5 respectively. The high figure of asset maturity indicates that most Malaysian firms have lower depreciation on assets which implies that the firms have the ability to issue long-term debt maturity. Furthermore, the standard deviation of term structure is less than its average of about 0.93; it denotes that the lower the standard deviation from its average, the better the result will be since the data is normally distributed.
Table 5: Descriptive Statistics for Entire Sample
Mean Median Max Min Std. Dev. Obs
Lev 0.2640 0.2357 10.273 0.0000 0.2872 5721
DM 0.3890 0.3453 1.0000 0.0000 0.3130 5721
GROW 1.0666 0.9090 19.101 0.2372 0.7579 5721
SIZE 12.779 12.565 18.451 7.7098 1.3385 5721
NOL 0.2381 0.0000 1.0000 0.0000 0.4259 5721
REGUL 0.0295 0.0000 1.0000 0.0000 0.1693 5721
ABNR 0.1134 0.0269 110.96 -369.037 5.5641 5721
ROA 3.9408 4.0800 771.45 -93.4700 14.038 5721
TANG 0.4063 0.3976 0.9875 0.0000 0.2069 5721
ASMAT 36.406 13.356 3352.4 -2142.26 112.99 5721
SPRED 1.5143 1.2940 4.0550 0.0390 0.9313 5721
Source: Secondary data that has been processed 2012
Note: The number of observations is 5806 in Equation 1 and 6024 in Equation 2 consisting of the sample of listed companies during the 1999-2010 periods. LEV is generated by dividing total debt to total asset. DM is long term debt divided by total debt. GROW is total asset plus market capitalization
then divided by earnings in year t. PROFIT is the ratio of EBITDA to total assets. TANG is tangible asset divide by total assets. ASMAT is the ratio of fixed assets to annual depreciation expenses. SPREAD is measured by the difference between the month-end yields on long term 10-year government bonds (MGS) and three-month Treasury-bills and matched with the
firm’s fiscal year-end.
Table 6 and 7 presents the correlation matrix among the variables in the leverage equation and debt maturity equation, respectively. These correlations express some simple relations among the variables before generating the simultaneous equations regression results. It can be seen in both tables that leverage and debt maturity are positively correlated and significant at 1% level.
Table 6: Correlation Matrix for Leverage
LEV DM GROW SIZE NOL REGUL ABNR ROA TANG
LEV 1
---
DM 0.0392*** 1
(2.9920) ---
GROW 0.3562*** 0.0452*** 1
(29.0404) (3.4485) ---
SIZE 0.0261** 0.3614*** -0.0154 1
(1.9887) (29.5287) (-1.17) ---
NOL 0.1814*** -0.0673*** -0.0047 -0.1652*** 1
(14.0491) (-5.1364) (-0.3568) (-12.7585) ---
REGUL 0.0388*** 0.203618*** 0.0393*** 0.2900*** -0.0421 1
(2.957) (15.8444) (2.9993) (23.0870) (-3.2101) ---
ABNR 0.1165*** -0.0029 0.0787*** -0.0096 0.0127 0.0034 1
(8.9371) (-0.2175) (6.0153) (-0.7295) (0.9705) (0.2613) ---
ROA -0.2021*** 0.0609*** 0.1329*** 0.0813*** -0.2064*** 0.0252* -0.0083 1
(-15.7248) (4.6457) (10.2131) (6.2147) (-16.0712) (1.9198) (-0.6301) ---
TANG 0.0607*** 0.1812*** -0.0743*** 0.0693*** 0.004 0.0325** 0.006 -0.0565*** 1
(4.6301) (14.0353) (-5.6761) (5.2890) (0.3052) (2.4806) (0.4580) (-4.3094) ---
Source: Secondary data that has been processed 2012
Note: The number of observations is 5275 consisting of the sample of listed companies during the 1999-2010 period. LEV is generated by dividing total debt to total asset. DM is long-term debt divided by total debt. GROW is total asset plus market capitalization then minus common equity, divided by total asset. REGUL used dummy variable, 1 for utilities
Table 7: Correlation Matrix for Debt Maturity
DM LEV GROW SIZE NOL REGUL ABNR ASMAT SPEARD
DM 1
---
LEV 0.0404*** 1
(3.1405) ---
GROW 0.0392*** 0.3410*** 1
(3.0437) (28.1456) ---
SIZE 0.3652*** 0.0323** -0.0280** 1
(30.439) (2.5043) (-2.1732) ---
NOL -0.0524*** 0.1804*** -0.0122 -0.1401*** 1
(-4.0683) (14.2349) (-0.9484) (-10.9827) ---
REGUL 0.2051*** 0.0411*** 0.0348*** 0.2931*** -0.0396** 1
(16.2583) (3.1921) -2.7045 -23.7877 (-3.0777) ---
ABNR 0.0089 0.1093*** 0.0672*** -0.0015 0.0065 0.0017 1
(0.6889) (8.5297) -5.223 (-0.1213) (0.5063) -0.1326 ---
ASMAT 0.1275*** -0.0119 -0.0693*** 0.0880*** 0.0429*** -0.0281** 0.2532*** 1
(9.9765) (-0.9253) (-5.3889) (6.8545) (3.3353) (-2.1812) -20.3117 ---
SPREAD -0.0328** -0.0004 0.0670*** 0.0006 -0.013 0.005 -0.0152 -0.0198 1
(-2.5477) (-0.0305) (5.2147) (0.0446) (-1.0097) -0.3845 (-1.1759) (-1.5354) ---
Source: Secondary data that has been processed 2012
Note: The number of observations is 5275 consisting of the sample of listed companies during the 1999-2010 period. LEV is generated by dividing total debt to total asset. DM is long-term debt divided by total debt. GROW is total asset plus market capitalization then minus common equity, divided by total asset. REGUL used dummy variable, 1 for utilities companies and other are 0. SIZE is measured by log of total assets. NOL carryforwards dummy equals 1 for net operating loss and 0 otherwise. ABNR is the difference between earnings in year t+1 and t, then divided by earnings in year t. ASMAT is the ratio of fixed assets to annual depreciation expenses. SPREAD is measured by the difference between the month-end yields on long term of 10-yearsgovernment bonds (MGS) and three-month Treasury-bills and matched with the firm’s fiscal year.
In addition, all variables are significantly correlated to the leverage at 1%level except for the asset maturity and term structure. Only ROA is found to have a significant negative relationship with leverage. Debt maturity is positively and statistically significant to the growth opportunities, size, regulated firm, ROA, tangibility and asset maturity at 1% level. However, theNOL carrryforwards is negative and significant to debt maturity at 1% level and term structure is also negatively significant to the debt maturity at 5% level.
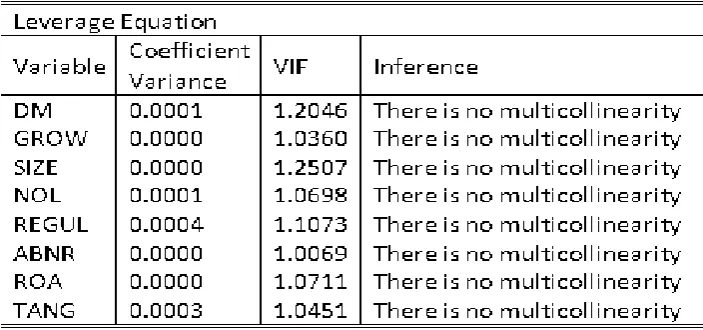
that have VIF values greater than 10. Therefore, it is concluded that there is no multicollinearity between independent variables in both regression models.
4.2. Regression Analysis
This study investigates empirically the relationship between leverage and debt maturity by using a simultaneous equations model on debt maturity and leverage for all sample panel data. This study also estimates a single equation without endogeneity and with endogeneity for both leverage and debt maturity using pooled EGLS with AR(1) to compare with previous studies. Estimation using EGLS will potentially reduce the number of observation since it is able to determine and adjust the data to be used. EGLS is also able to overcome the problem on heteroscedasticity and autocorrelation as evident from the Durbin-Watson analysis equals to 1.91 for leverage and 2.12 for debt maturity.
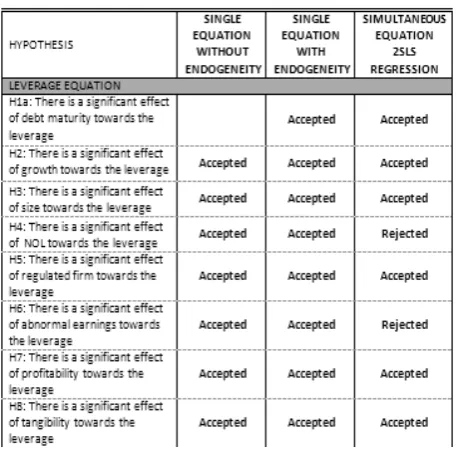
The results of all regression analysis in Table 8 report that growth opportunity is significantly positive in all regression both in single and simultaneous equation to the leverage. It means that Malaysian firms which have high growth opportunity will take much more leverage in the determination of capital structure. However, the growth opportunity does not affect the determination of debt maturity. Thus, Malaysian firms cannot rely on growth opportunity in determining debt maturity. In sum, there is a relationship between leverage and growth opportunity as predicted, while on the other hand, growth opportunity does not significantly affect debt maturity and thus, the proposed hypothesis is rejected.
Regulated firm and firm size are statistically significant in both hypothesis of leverage and debt maturity either in single and simultaneous regression. This is in line with a study conducted by Barclay et al. (2003) and Johnson (2003). The positive relationship that exists between regulated firm and leverages is because regulated firms always maintain optimal leverage to reduce the agency risk (Bradley, Jarrell
and Kim., 1984). While for maturity regression, positive coefficient at 1% level of significant which is in accordance to Barclay and Smith (1995) who state that regulated firm can borrow longer term debt due to less discretion in investment decision, and also less agency problems.
Furthermore, firm size is also positively significant in both regressions in accordance with the findings by Bevan and Danbolt (2002) and Barclay et al. (2003). All empirical studies suggest positive relation between firm sizes to leverage due to the fact that larger firms have smaller probability of facing bankruptcy thus allowing them to take higher leverage which also means having easy access to the bond market (Titman and Wessels, 1998) and (Rajan and Zingales, 1995). Meanwhile, the relationship between debt maturity and firm size is positively significant. Positive effect of firm size, in accordance with the proposed carryforwards variable is positively significant to leverage but only significant in single equations. The positively significant relationship between net operating loss carryforwards and leverage contradicts with the predicted sign which is in line with studies by Barclay, Marx and Smith (1997) and Harris and Raviv (1991). It indicates that firms in Malaysia with higher net operating loss carryforwards will have higher leverage due to the losses generated by the net operating loss carryforwards which cause equity to fall in value.
Table 8 :
Three Different Estimators of LEV and DM Equation
Source: Secondary data that has been processed 2012
Standard errors in parentheses are for coefficient and P values for diagnostic test. ***,**,* Statistically significant at the 1%, 5%, and 10% level, respectively (two-tailed test)
Modigliani and Miller (1958) find positively significant relationship only for utilities sectors. Therefore, it is possible for industry in Malaysia to have negative relationship between abnormal earnings and leverage.
On the other hand, debt maturity equation accepted the proposed hypothesis, which is in line with study conducted by Barclay and Smith (1995) and Sunarsih (2004) that argue abnormal earnings give good signal to the market which means that the firm is of good quality; more valuable firm will use more short term debt than long term debt.
As expected, profitability and tangibility are consistent and thus support the proposed hypothesis in leverage equation either in single or simultaneity regression. This is also in line with asset maturity which is consistent to proposed
hypothesis and positively significant to debt maturity equation. Thus, Malaysian firms can take these three variables namely, profitability, tangibility and asset maturity into considerations in determining the level of debt in capital structure.
In addition, the result of term structure rejects the hypothesis in all regression, either in a single and simultaneous regression. Therefore, term structure cannot be used by Malaysian firms as a reference in determining the level of debt especially in debt maturity.
are substitutes in addressing the under and over investment problems (Barclay et al., 2003).
Other explanations regarding discrepancy between the predicted sign and the result may also be due to the definition of long term debt adopted in this study in which it has no clear standard. According to Barclay et al. (2003), they state that measurements for debt maturity equal to the fraction of the firm’s total debt measured for more than 3 years. Whereas in this study, long term debt is a variable collected from Datastream with the terms of debt that have maturity of more than one year; this proportion is similar to short term debt by Johnson (2003), in which the proportion of debt matures within three years. Thus, it can be possible, that the long-term debt in this study comes under the category of short-term debt as used by Johnson (2003).
In Malaysia, most companies are using short-term debt maturity than long- term debt and only a few companies issue Sukuk (Mustapha, Ismail, &Minai, 2011). This also confirms the finding by Demirguc-Kunt and Maksimovic (1999) that the most fundamental difference between developed and developing countries is that developing countries would prefer to use short term debt rather than using long term debt. So, note that there is possibility that the long term debt in this study is actually included in the category of short term debt as it stated by Johnson (2003).
On the basis of the above explanation, it is possible that the negative results obtained from this study are based on the factors that have been described. It is likely that this study supports the finding in Johnson (2003). Thus, the negative coefficient between debt maturity and leverage is consistent with Johnson (2003) in which higher leverage firms use lower short term debt to mitigate investment opportunity problems.
5. CONCLUSION AND SUGGESTIONS This study investigates empirically the relationship of simultaneity between leverage and debt maturity and factors that influence it, using a
simultaneous equations framework in which leverage and debt maturity are endogenous. Based on the analysis of the results and discussion that have been described in the previous section, it can be concluded that results of this study indicate the presence of simultaneity between leverage and debt maturity with negative coefficient and significantly proven. This is shown by the negative sign on the variable leverage and debt maturity in both leverage and debt maturity equation. This shows that the relationship between leverage and debt maturity are complementary, which means there is a negative direction of the simultaneity relationship between the two equations. Thus, the coefficient estimated in an OLS regression of single equations will suffer from simultaneous equation bias.
In addition, this study does not include some exogenous variables used in the past studies, which are considered to have significant effects on the two policies. There are several variables that affect the leverage and debt maturity variables. As a recommendation for further research, adding some variables such as non-debt tax shield, dividend yield and covenants, could potentially increase the accuracy in analyzing the relationship of simultaneity between leverage and debt maturity.
APPENDIX A
Table 9: Continued
Source: Secondary data that has been processed 2012
Table 10 : Multicollinearity Test of LeverageEquation
Source: Secondary data that has been processed 2012
Table 11: Multicollinearity Test of Debt Maturity Equation
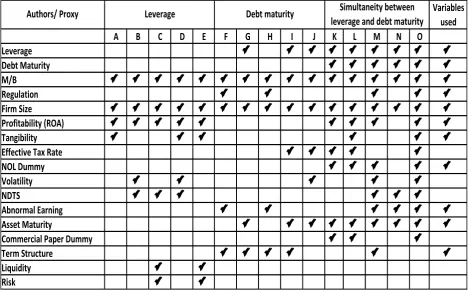
Table 12: Summaries of Prior Studies
A B C D E F G H I J K L M N O
Leverage
Debt Maturity
M/B
Regulation
Firm Size
Profitability (ROA)
Tangibility
Effective Tax Rate
NOL Dummy
Volatility
NDTS
Abnormal Earning
Asset Maturity
Commercial Paper Dummy
Term Structure
Liquidity
Risk
Authors/ Proxy Leverage Debt maturity Simultaneity between
leverage and debt maturity
Variables used
Source: Secondary data that has been processed 2012
Note: This table shows the author of the previous research drawn at randomly in this study. They consist of: A. Rajan and Zingales. (1995), B = Titman, S., Wessels, R. (1998), C = Ozkan, A. (2002), D = Chen, J.J (2003), E = Jong, A.de. (2008), F = Barclay and Smith. (1995), G = Stohs and Mauer (1996), H = Guedes, J. and Opler, T. (1996), I = Jhonson, S.A. (1997), J = Stephen, A et al., (2011), K = Elyasiani, E et al., (2002), L = Barclay, M.J., et al., (2003), M = Johnson, S.A. (2003), N = Sunarsih. (2004), O = Fan, J., Titman, S., Twite, G. (2006).
REFERENCES
[1] Arslan, O., & Karan, M.B 2006, “Ownership and Control Structure as Determinants of Corporate Debt Maturity: a panel study of an emerging market”, Journal of Corporate Governance, Vol. 14, p.312- 324.
[2] Bank Negara Malaysia, Quarterly Bulletins & Annual Report, Kuala Lumpur, various issues.
[3] Barclay, M. J., Marx, L. M., & Smith, C.W. 1997, Leverage and maturity as strategic complements, working paper, University of Rochester.
[4] Barclay, M.J., Marx, L.M., & Smith, C.W.
2003, “The joint determination of leverage
and maturity”, Journal of Corporate Finance, Vol. 9, p. 149-147.
[5] Barclay, M.J., & Smith, C.W. 1995, “The maturity structure of corporate debt.”, Journal of Finance, Vol. 50,p. 609-631.
[6] Barclay, M.J., Smith, C.W., & Watts, R.L.
[7] Bevan, A.A., &Danbolt, J. 2000, “ Capital structure and its determinants in the United Kingdom: a decompositional analysis”, Working Paper University of Glasgow.
[8] Billet, M.T., King. T-H.,&Mauer, D.C. 2007,
“Growth opportunities and the choice of leverage, debt maturity, and Covenants”, Journal of Finance, Vol. 62(2), p. 627-729.
[9] Bradley, M., Jarrell, G.A., & Kim, E.H. 1984,
“On the existence of an optimal capital structure: Theory and evidence”, Journal of Finance, Vol. 39, p. 857-878.
[10]Chen, J.J. 2004, “Determinants of capital structure of Chinese listed companies”, Journal of Business Research, Vol. 57, p. 1341-1351.
[11]Crutchley Claire and Robert Hansen 1989, “A Test of the Agency Theory of Managerial Ownership, Corporate Leverage, and Corporate Dividends”, Financial Management, Vol.18 Winter 1989, p.36-46.
[12]DeAngelo, H., and R.W. Masulis 1980,
“Optimal Capital Structure under Corporate and Personal Taxation”, Journal of Financial Economics Vol. 8, p. 3-29.
[13]Demirguc-Kunt, A., &Maksimovic, V. 1999,
“Institutions, financial markets and firm debt maturity”, Journal of Financial Economics, Vol. 54, p. 295-336.
[14]Diamond, D.W. 1993, “Seniority and maturity of debt contracts”, Journal of Financial Economics, Vol. 33, p. 341-68.
[15]Elyasiani. E., Guo, L., & Tang, L. (2002). The determinants of debt maturity at issuance: A system-based model. Review of Quantitative Finance and Accounting, Vol. 19, p. 351-377.
[16]Flannery, M. J. 1986, “Asymmetric information and risky debt maturity choice”, Journal of Finance, Vol. 41, p. 19-37.
[17]Fama, E. F. dan K. R. French 2002, “Testing Trade-Off and Pecking Order Predictions
about Dividends and Debt”, Review of Financial Studies, Vol. 15, p. 1-33.
[18]Harris, M., &Raviv, A. 1991, “The theory of capital structure”, Journal of Finance, Vol. 46, p. 297-355.
[19]Johnson, S. A. 2003, “Debt maturity and the effects of growth opportunities and liquidity risk on leverage”, Review of Financial Studies, Vol. 16(1), p. 209-236.
[20]Leland, H.E., &Toft, K.B. 1996,
“Optimalcapital structure, endogenous bankruptcy, and the term structure of credit Theory”. Addison Wesley Educational Publishers.
[23]Modiglini, F., & Miller, M.H. 1995, “The cost of capital, corporate finance and the theory of
investment”, American Economic Review, Vol. 48, p. 201-97.
[24]Myers, S.C. 1977, “Determinants of corporate borrowing”. Journal of Financial Economics, Vol. 5, p. 147–175.
[25]Muradoglu, G. Y., and Sivaprasad, S. 2009,
“Using firm level leverage as an investment strategy”, SSRN Working Paper Series.
[26]Mustapha, M., Ismail, H., &Minai, B. 2011,
“Determinants of debt structure: Empirical evidence from Malaysia”, 2nd International Conference on Business and Economic Research Proceeding.
[27]Ozkan, A. 2002, “The determinants of corporate debt maturity: evidence from UK
[28]Rajan, R.G., &Zingales, L. 1995, “What do we know about capital structure? some evidence from international data”, The Journal of Finance, Vol. 50(5), p. 1421 – 1460.
[29]Spiegel, Yossef.,& Daniel F. Spulber, 1994,
“The capital structure of a regulated firm”, Rand Journal of Economics, Vol. 25, p. 424-440
[30]Sunarsih 2004, “Analisissimultanitas kebijakan hutang dan kebijakan maturitas hutang serta faktor-faktor yang mempengaruhinya”, JurnalSiasatBisnis, Vol. 9(1), p. 65-84.
[31]Stohs, M. H., & Mauer, D. C. 1996, “The determinants of corporate debt maturity structure”, Journal of Business, Vol. 69, p. 279- 312.