Seasonal and Interannual Variations of Sea Surface Temperature
in the Indonesian Waters
Martono
Centre of Atmospheric Science and Technology (LAPAN) Jl. Dr. Djundjunan 113 Bandung, West Java Corresponding author (e-mail: [email protected]) ODXW KDULDQ GDUL \DQJ GLSHUROHK GDUL3K\VLFDO 2FHDQRJUDSK\ 'LVWULEXWHG $FWLYH $UFKLYH &HQWHU 1DWLRQDO $HURQDXWLFV DQG 6SDFH $GPLQLVWUDWLRQ 0HWRGH \DQJ GLJXQDNDQ DGDODKDQDOLVLVDQRPDOL+DVLOSHQHOLWLDQPHQXQMXNNDQEDKZDYDULDVLPXVLPDQGDQWDKXQDQ GRPLQDQ DQRPDOL QHJDWLI GDQ GDUL WDKXQ GRPLQDQ DQRPDOL SRVLWLI 3HQJDUXK ,QGLDQ2FHDQ'LSROHWHUKDGDSÁXNWXDVLVXKXSHUPXNDDQODXWGLSHUDLUDQ,QGRQHVLDOHELKNXDW
Sea Surface Temperature (SST) plays an important role in the aspects of the ocean and atmosphere. In the ocean aspect, SST affects the metabolism and breeding of marine organism (Emiyati, et al., 2014).
The rise of SST has caused severe damage to coral reefs that leads to biodiversity loss (Measey, 2010). In the atmosphere aspect,
667 DIIHFWV WKH H[FKDQJH RI KHDW ÁX[ LQ
air-sea interactions (Reynolds, et al., 2007;
Shenoi, et al., 2009; Anding and Kauth,
1970), global climate and its effects (Desser, was conducted to understand seasonal and interannual variations of sea surface temperature in the Indonesian waters. The data used in this research was daily sea surface temperature in 1986 to 2015 which was obtained from the Physical Oceanography Distributed Active Archive Center - National Aeronautics and Space Administration. Method used in this study was the anomaly analysis. The result showed that the seasonal and interannual variations of sea surface temperature in the Indonesian waters varied. Seasonal variations of SST in the Makasar Strait, Sulawesi Sea, and Halmahera Sea were low. High seasonal variations of sea surface temperature occurred in the southern waters of Java, Timor Sea, Arafura Sea, and Banda Sea, which were allegedly due to the upwelling process. In addition, interannual variation of sea surface temperature in the Indonesian waters fluctuated. From 1986 to 2000, it showed a negative anomaly dominant. Meanwhile, from 2001 to 2015, it showed a positive anomaly dominant. The effect of Indian Ocean Dipole on the fluctuation of sea surface temperature in the Indonesian waters was stronger than ENSO. Within the last 30 years, the sea surface temperature in the Indonesian water indicated a rising trend. The highest sea surface temperature rise occurred in the Halmahera Sea that reached 0.66 OC/30 years and the lowest was in the Timor Sea of 0.36 OC/30 years.
et al., 2010). Some researchers predicted the rise
of SST in the tropical waters would increase the
IUHTXHQF\RIH[WUHPHZHDWKHU,&&65 SST in the Indonesian waters is a main trigger of the deep convection which affects global atmospheric dynamics (Qu, et al.,
2005; Sprintall, et al., 2014). Knowledge about seasonal variability of SST in the Indonesian waters is crucial to understand the tropical climate variability (Kida and Richards, 2009). Previous researches related to SST variability have been conducted including SST variability in the southern waters of Java (Syaifullah, 2010) and in the Natuna sea (Nababan and Simamora, 2012); SST mapping in the western waters of Madura (Rini et al. 2010); SST variability during ENSO and IOD in the southern waters of Java to Timor (Kunarso et al. 2011); SST distributions in the Tomini Bay (Kasim, 2010); the rise of SST in the southern waters of Java, the western waters of Sumatera, the South China Sea, and the northern waters of Papua (Syaifullah, 2015). However, comprehensive research about SST variability in the Indonesian waters was limited.
This activity was an early stage to conduct a comprehensive research of air-sea interaction. Therefore, we believe that a comprehensive understanding about regional SST variability in the Indonesian waters will provide information regarding with the tropical climate variability and can increase the accuracy of regional and
global climate prediction. The objective of this research was to understand seasonal and interannual variations of SST in the Indonesian waters.
2. Research Method
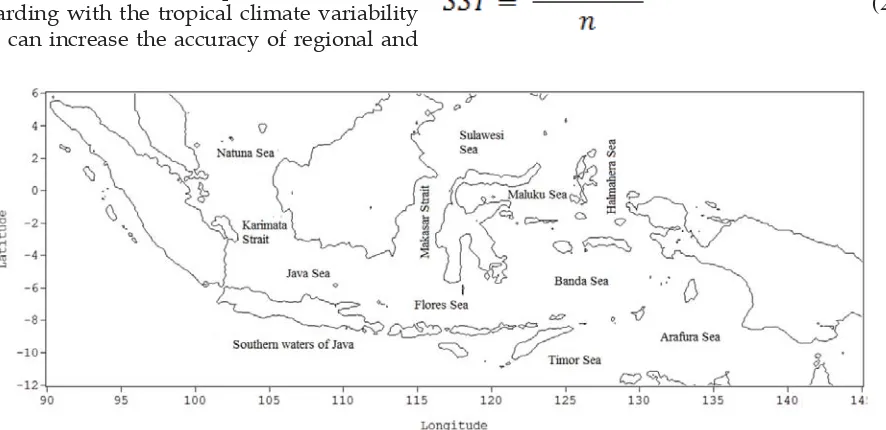
The research area was the Indonesian waters, which consisted of the southern waters of Java, Timor Sea, Arafura Sea, Java Sea, Flores Sea, Banda Sea, Karimata Strait, Makassar Strait, Maluku Sea, Natuna Sea, Sulawesi Sea, and Halmahera Sea as illustrated in Figure 1.
In this research, we used the daily SST
GDWDLQWKHSHULRGWKDWZDVREWDLQHG
from Physical Oceanography Distributed Active Archive Center National Aeronautics and Space Administration (PODAAC NASA) (online service :http://podaac.jpl.nasa.gov/). The horizontal grid resolution, both of longitude and latitude, was 0.25O. Method used in this research was anomaly analysis. Value of SST
DQRPDO\ZDVFDOFXODWHGE\IROORZLQJHTXDWLRQ
(1)
Where 667$ is the value of SST anomaly and is the value of SST climatology.
(2)
Figure 1. Research site of the Indonesian Waters.
2. Results and Discussions
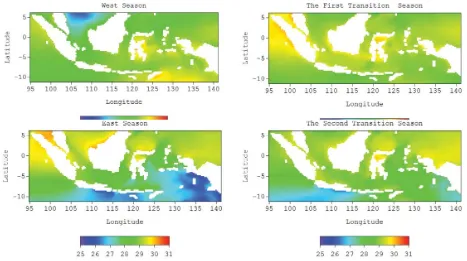
Seasonal pattern of SST in the Indonesian waters varied as shown in Figure 2. In the west season (December-February), SST in the Timor Sea, Arafura Sea, Banda Sea, and Maluku Sea
SST in the Timor Sea, Arafura Sea, Maluku Sea, and Banda Sea was colder than the west season. In the period of the east season, higher SST was inclined to move to the north part of the Indonesian waters. SST in the Natuna Sea, Karimata Strait, Sulawesi Sea, and Halmahera Sea are warmer. On the contrary, SST in the southern waters of Java-Sumbawa, Timor Sea, Arafura Sea, and Banda Sea was colder which
UHDFKHGOC. Generally, SST in the period of the second transitional season showed similar pattern to the east season, but lower SST occurred in the Natuna Sea, Karimata Strait, Sulawesi Sea, and Halmahera Sea while higher SST occurred in the southern waters of Java-Sumbawa, Timor Sea, Arafura Sea, and Banda Sea.
Figure 2. Seasonal pattern of SST in the Indonesian waters.
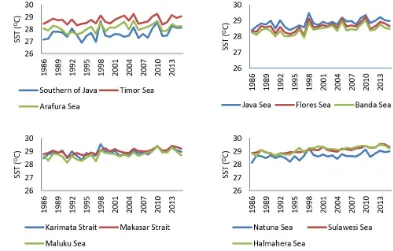
Figure 3 showed the seasonal variation of SST in the Makasar Strait, Sulawesi Sea, and Halmahera Sea was low and the temperature was relatively warm throughout the year with an average temperature of 29.1 OC. Seasonal variation of SST in the Natuna Sea and Karimata Strait showed different pattern. In the period of the west season, SST in the Natuna Sea and Karimata Strait was low which reached 27.2 OC and 28.1 OC, respectively. However, in
WKHSHULRGRIWKHÀUVWWUDQVLWLRQVHDVRQWRWKH
second transition season, their SST was higher which reached 29.1 OC. Seasonal variation of SST in the southern waters of Java, Java Sea, and Flores Sea showed similar pattern. Maximum
667RFFXUUHGLQWKHÀUVWWUDQVLWLRQVHDVRQDQG
minimum SST occurred in the east season.
Meanwhile, SST in the Timor Sea, Arafura Sea, and Banda Sea had the same pattern, with maximum SST took place in the west season and minimum SST was in the east season.
Interannual variation of SST in the
,QGRQHVLDQ ZDWHUV YHU\ ÁXFWXDWHG DV VKRZQ LQ)LJXUH7KHORZHVWÁXFWXDWLRQRI667ZDV
obtained by the Sulawesi Sea, Halmahera Sea, and Makasar Strait which reached 0.8 OC,
PHDQZKLOH WKH KLJKHVW ÁXFWXDWLRQ ZDV LQ WKH
southern waters of Java which reached 1.8 OC. Within the last thirty years, interannual variation of SST in the Indonesian waters indicated a rising trend. However, it varied as shown in Table 1. The highest rise of SST
RFFXUUHGLQWKH+DOPDKHUD6HDRIOC and
WKHORZHVWRFFXUUHGLQWKH7LPRU6HDRIOC.
Figure 4. Interannual variation of SST in the Indonesian waters.
Table 1. isin trend of SST from 986-20 5
No Area The increase (
OC)/ 30 years
1 Southern of Java 0.51
2 Timor Sea
3 Arafura Sea 0.39
4 Java Sea 0.48
5 Flores Sea 0.51
Banda Sea 0.48
7 Karimata Strait 0.42
8 Makasar Starit 0.48
No. Area The increase (OC)/ 30 years
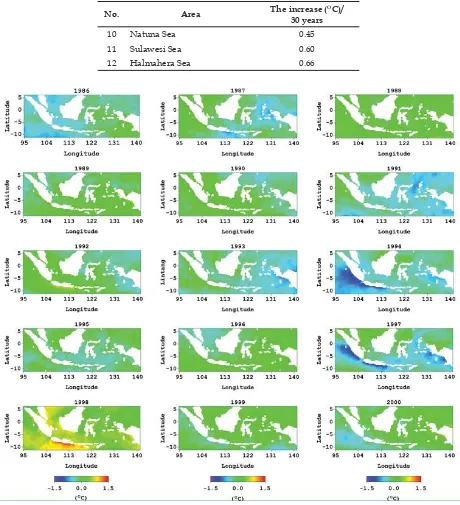
10 Natuna Sea 0.45
11 Sulawesi Sea
12 Halmahera Sea
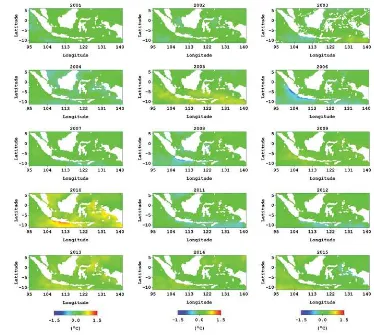
Figure 5. Annual Anomaly of SST in the Indonesian waters in the 1986-2000.
Interannual anomaly distribution of
667 LQ WKH ,QGRQHVLDQ ZDWHUV LQ LV
demonstrated in Figure 5 and in 2001-2015 is
LOOXVWUDWHG LQ )LJXUH )LJXUH DQG )LJXUH
showed that the annual anomaly of SST in the
,QGRQHVLDQ ZDWHUV ÁXFWXDWHG ZLWK GLIIHUHQW
intensity. Generally, the anomaly of SST in
KDGDSURSHQVLW\WRVKRZDQHJDWLYH
dominant, vice versa, in 2001-2015 it tended to show a positive dominant. High negative anomaly of SST particularly occurred in 1994 and 1997, meanwhile, high positive anomaly of SST occurred in 1998 and 2008. High negative
anomaly of SST occurred in the southern waters
RI-DYDZKLFKUHDFKHGO&LQDQG OC in 1997. Furthermore, high positive anomaly of SST occurred in the southern waters of Java which reached 1 OC in 1998 and 0.9 OC in 2010.
al., 2014). The combination of El Niño’s effect, ,QGRQHVLDQWKURXJKÁRZJOREDOZDUPLQJDQG environmental change in local, regional, and global in conjunction with monsoon had led to the SST variability in the Indonesian waters (Sachoemar and Yanagi, 2013).
Seasonal variation of SST in the Makassar Strait, Sulawesi Sea, and Halmahera Sea was low and the temperature was relatively warm throughout the year. On the contrary, seasonal variation of SST in the southern waters of Java, Timor Sea, Arafura Sea, and Banda Sea was relatively high. Generally, SST in the most of Indonesian waters in the period of the east season to the second transition season was colder than another season. The same results
were yielded by the other studies. The coldest SST in the Banda Sea and Arafura Sea occurred in June to September and the warmest occurs in November to April (Boerly et al., 1990). Warm SST in the Banda Sea and Arafura Sea occurred
during the period of northwest wind and cold SST occurred in the period of southeast wind
(Kida and Richards, 2009), temperature in the mixed layer in the Banda Sea and Arafura Sea was relatively warm in November–May and relatively cold in June–September (Halkides
HWDO, 2011). In May to August, the lowest SST took place in the eastern Indonesia and the highest SST too place in the western Indonesia (Setiawan and Habibi, 2010).
Figure 6. Annual Anomaly of SST in the Indonesian waters in 2001-2015.
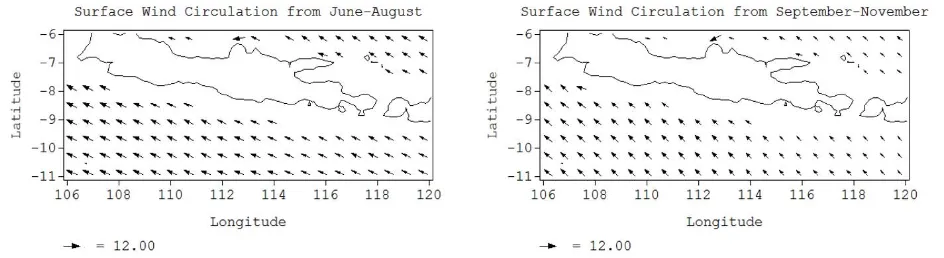
Upwelling process in the southern waters of Java was caused by a stress of the surface wind over in the southern waters of Java which moved to the west and parallel to the coast as shown in Figure 8. Friction of surface wind will push surface water mass toward the west. Movement of the water mass beneath surface layer is affected by friction and Coriolis forces
that form the Ekman Spiral. Because it took place in the southern hemisphere, Ekman
6SLUDOZRXOGGHÁHFWO to the left of the wind direction. The average of transport volume in the Ekman Spiral which is known as Ekman
a slope between the off-shore and the coast. In
RUGHUWRUHVWRUHHTXLOLEULXPRIWKHZDWHUPDVV
the water mass from the bottom layer of the
coast will rise to the surface. The mechanism causes the upwelling process in the southern waters of Java.
Figure 7. Wind circulation over the Banda Sea and Arafura Sea.
Figure 8. Wind circulation in the southern waters of Java.
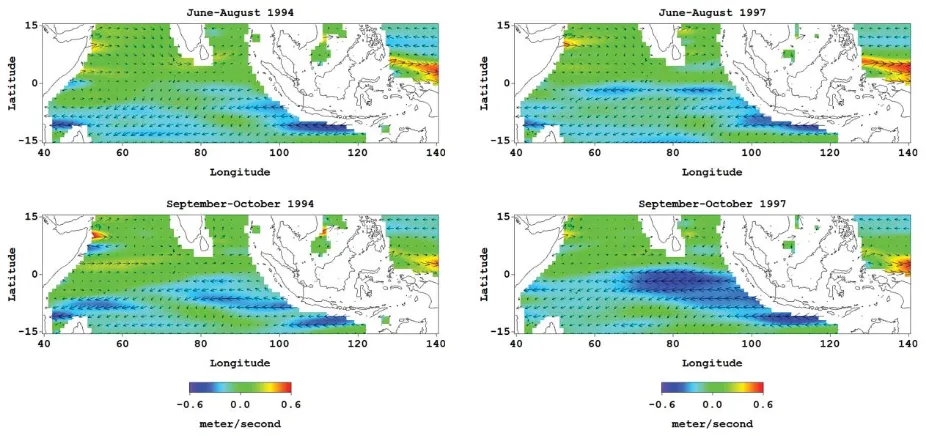
Interannual variation of SST in the ,QGRQHVLDQZDWHUVVKRZHGDÁXFWXDWHSDWWHUQ which was affected by the phenomenon of Indian Ocean Dipole (IOD) in the Indian Ocean DQG(162LQWKH3DFLÀF2FHDQ*HQHUDOO\WKH ÁXFWXDWLRQRI667LQWHQGHGWRVKRZ dominant negative anomaly. Meanwhile, in 2001-2015, it tended to show dominant positive anomaly. The maximum and minimum anomaly of SST occurred in the southern waters of Java. The maximum anomaly of SST in 1994 and 1997 was related to high positive phase of IOD and El Niño. Meanwhile, the minimum anomaly of SST occurred in 1998 and 2010 was related to the high negative phase of IOD and La Niña. In 1994 and 2010, El Niño and La Niña did not occur, but SST in the southern waters of Java showed both maximum and minimum anomaly. It explains that the effect of IOD on the SST variability in the southern waters of Java is stronger than the effect of ENSO.
This condition was caused partly due to the location of the southern waters of Java,
which is part of the Indian Ocean. IOD was represented by anomaly gradient of SST between 50O E – 70O E and 10O S – 10O N in
the western Indian Ocean and between 90O E
– 110O E and 10O S – 0O in the eastern Indian
Ocean (Saji et al, 1999). Therefore, the southern waters of Java are part of the Southern Tropical Indian Ocean SST index. The Southern Tropical Indian Ocean SST index is a part of the Dipole Mode Index. During the period of IOD, pattern FKDQJH RI WKH 6RXWK (TXDWRULDO &XUUHQW DQG WKH (TXDWRULDO &RXQWHU &XUUHQW LQ WKH ,QGLDQ Ocean took place.
FRQVHTXHQFH LW FDXVHG WKH WKHUPRFOLQH OD\HU of the waters was shallower. This mechanism caused the upwelling intensity in this waters was higher, hence, the water mass that rises to the surface was colder than the normal FRQGLWLRQ 6XEVHTXHQWO\ SDWWHUQ RI WKH 6RXWK (TXDWRULDO&XUUHQWDQGWKH(TXDWRULDO&RXQWHU Current during negative phase of IOD is shown in Figure 10. The intensity and area coverage RI WKH 6RXWK (TXDWRULDO &XUUHQW ZDV ORZHU DQGQDUURZHURQWKHFRQWUDU\WKH(TXDWRULDO Counter Current was higher and wider than
the normal condition. The surface water mass in the southern waters of Java obtained high VXSSO\ RI ZDWHU PDVV IURP WKH (TXDWRULDO Counter Current that led to the occurrence of downwelling. Downwelling process will cause the thermocline layer in the waters is deeper than the normal condition. In contrast with the upwelling process, the downwelling process will cause SST in waters is warmer than the normal conditions. This mechanism caused the effect of IOD on the SST variability in the southern waters of Java was stronger than the
effect of ENSO.
Figure 9. Pattern of sea surface circulation in June-October, 1994 (left) and 1997 (right)
Figure 10. Pattern of sea surface circulation in June-October, 1998 (left) and 2010 (right).
Interannual variability of SST in the
Indonesian waters varied and was closely related to global warming. This result
FRQÀUPHG RWKHU VWXGLHV VXFK DV WKH UHVXOW
of SST in the Makassar Strait, Ombai Strait, Lombok Strait, and Timor Sea that increased
during 1970-2013 (Manjunatha, et al., 2015),
the rise of SST in the Indonesian seas of 0.2-2.5
OC (DFID, 2007), and the average of SST in the
tropics waters increased 0.1 OC/decade in the
last 30 years (Johnson and Xie, 2010). Generally, the lowest rise of SST occurred in the Timor Sea
WKDWUHDFKHGOC/30 years while the highest
rise of SST occurred in the Halmahera Sea that
UHDFKHGOC/30 years.
3. Conclusion and Recommendation
Based on the results, it can be concluded that seasonal and interannual variations of SST in the Indonesian waters varies. Seasonal variation of SST in the Indonesian waters was affected by monsoon system. Seasonal variation of SST in the Makasar Strait, Sulawesi Sea, and Halmahera Sea was low and the temperature was almost warm throughout the year. The highest seasonal variation of SST occurred in the southern waters of Java, Timor
Sea, Arafura Sea, and Banda Sea. Seasonal variation of SST in the southern waters of Java, Timor Sea, Arafura Sea, and Banda Sea was caused by the upwelling process. Meanwhile, interannual variation of SST in the Indonesian
ZDWHUVVKRZHGÁXFWXDWHSDWWHUQZLWKYDULRXV
values. Generally, interannual variation of
667 LQ WHQGHG WR VKRZ GRPLQDQW
negative anomaly while in 2001-2015 tended to show dominant positive anomaly. Maximum anomaly of SST occurred in 1994 and 1997 while minimum anomaly of SST occurred in 1998 and 2010. The effect of IOD on the annual variation of SST in the Indonesian seas was higher than those of ENSO. Within the last 30 years, SST in the Indonesian waters tended to show a rising trend. The highest rise of SST occurred in the Halmahera Sea which reached
OC/30 years and the lowest occurred in the
7LPRU6HDZKLFKUHDFKHGOC/30 years.
4. Acknowledgement
Author would like to thank Drs. Safrudin who provided inputs and the PODAAC-NASA as well as access to the data so that the research
FRXOGEHÀQLVKHG.
5. References
Anding, D. and Kauth, R. (1970). Estimation of Sea Surface Temperature from Space. Remote
6HQVLQJRI(QYLURQPHQW, 1: 217-220.
Boely, T., Gastellu-Etchegorry, J.P., Potier, M., Nurhakim, S. (1990). Seasonal And Interannual Variations of The Sea Surface Temperatures (SST) In The Banda And Arafura Sea Area. 1HWKHUODQGV-RXUQDORI6HD5HVHDUFK, 25(4): 425-429.
Deser, C., Alexander, M.A., Xie, S.P., Phillips, A.S. (2010). Sea Surface Temperature Variability: Patterns and Mechanisms. $QQX5HY0DU6FL, 2: 115–143.
DFID. (2007)([HFXWLYH6XPPDU\,QGRQHVLDDQG&OLPDWH&KDQJH. Working Paper on Current Status and Policies.
Emiyati., Setiawan, K.T., Manopo, A.K.S., Budhiman, S., Hasyim, B. (2014). $QDOLVLV0XOWLWHPSRUDO 6HEDUDQ6XKX3HUPXNDDQ/DXW'L3HUDLUDQ/RPERN0HQJXQDNDQ'DWD3HQJLQGHUDDQ-DXK0RGLV. Prosiding Seminar Nasional Penginderaan Jauh: 470-479.
Gaol, J.L., Arhatin, R.E., Ling, M.M. (2014). 3HPHWDDQ6XKX3HUPXNDDQ/DXW'DUL6DWHOLW'L3HUDLUDQ ,QGRQHVLD8QWXN0HQGXNXQJ´2QH0DS3ROLF\µ Prosiding Seminar Nasional Penginderaan Jauh 2014: 433-442.
Halkides, D., Lee, T., Kida, S. (2011). Mechanism Controlling the Seasonal Mixed-Layer Temperature and Salinity of The Indonesian Seas. 2FHDQ'\QDPLFV
ICCSR. (2010). 6FLHQWLÀF%DVLV$QDO\VLVDQG3URMHFWLRQRI6HD/HYHO5LVHDQG([WUHPH:HDWKHU(YHQW. Bappenas.
.DVLP)$QDOLVLV'LVWULEXVL6XKX3HUPXNDDQ0HQJJXQDNDQ'DWD&LWUD6DWHOLW$TXD
Modis dan Perangkat Lunak Seadas di Perairan Teluk Tomini. -XUQDO,OPLDK$JURSROLWDQ, 3:
Kida, S. and Richards, K.J. (2009). Seasonal sea surface temperature variability in the Indonesian
Seas. -*HRSK\V5HV&
.XQDUVR+DGL61LQJVLK16GDQ%DVNRUR069DULDELOLWDV6XKXGDQ.ORURÀODGL
Daerah 8SZHOOLQJpada Variasi Kejadian ENSO dan IOD di Perairan Selatan Jawa sampai
Timor. ,/08.(/$87$1
Manjunatha, B.R., Krishna, K.M., Aswini, A. (2015). Anomalies of the Sea Surface Temperature
LQ WKH ,QGRQHVLDQ 7KURXJKÁRZ 5HJLRQV $ 1HHG IRU )XUWKHU ,QYHVWLJDWLRQ7KH 2SHQ 2FHDQRJUDSK\-RXUQDO, 8: 2-8.
Measey, M. (2010). Indonesia: A Vulnerable Country in the Face of Climate Change. *OREDO 0DMRULW\(-RXUQDO, 1(1): 31-45.
1DEDEDQ%DQG6LPDPRUD.9DULDELOLWDV.RQVHQWUDVL.ORURÀODGDQ6XKX3HUPXNDDQ
Laut di Perairan Natuna. -XUQDO,OPXGDQ7HNQRORJL.HODXWDQ7URSLV, 4(1): 121-134. Nontji, A. (1987). Laut Nusantara. Djambatan, Jakarta.
Qu, T., Du, Y., Strachan, J., Meyers, G., Slingo, J. (2005). Sea Surface Temperature and Its Variability In The Indonesian Region. 2FHDQRJUDSK\
Rini, D.A.S., Hidayah, Z., Muhsoni, F.F. (2010). Pemetaan Suhu Permukaan Laut (SPL) Menggunakan Citra satelit ASTER Di Perairan Laut Jawa Bagian Barat Madura. -XUQDO .(/$87$1, 3(2): 98-104.
Reynolds, R.W., Smith, T.M., Liu, C., Chelton, D.B., Casey, K.S., Schlax, M.G. (2007). Daily High-Resolution-Blended Analyses for Sea Surface Temperature. -RXUQDORI&OLPDWH
Sachoemar, S.I. and Yanagi, T. (2013). 7HPSRUDODQG6SDWLDO9DULDELOLW\RI6HD6XUIDFH7HPSHUDWXUH ZLWKLQ,QGRQHVLDQ5HJLRQV5HYHDOHGE\6DWHOOLWH'DWD. Reports of Research Institute for Applied Mechanics, Kyushu University, 145: 37-41.
Saji, N.H., Goswani, B.N., Vinayachandran, P.N., Yamagata, T. (1999). A Dipole Mode In The Tropical Indian Ocean. Nature
Setiawan, R.Y. and Habibi, A. (2010). SST Cooling in the Indonesian Seas. ,OPX.HODXWDQ, 15(1):
²
Shenoi, S.S.C., Nasnodkar, N., Rajesh, G., Joseph, K.J., Suresh, I., Almeida, A.M. (2009). On the diurnal ranges of Sea Surface Temperature (SST) in the north Indian Ocean. J. (DUWK6\VW
6FL²
Sprintall, J., Gordon, A.L., Koch-Larrouy, A., Lee, T., Potemra, J.T., Pujiana, K., Wijffels. S.E. (2014). The Indonesian seas and their role in the coupled ocean–climate system. Nature *HRVFLHQFH, Progress Article Published Online.
Syaifullah, M.D. (2010). Analisis Suhu Muka Laut Selatan Jawa dan Pengaruhnya Terhadap Curah Hujan DAS Citarum. -XUQDO6DLQV 7HNQRORJL0RGLÀNDVL&XDFD, 11(2): 11-19.