Preliminary Study of Spatial Verification for
Wind Model Output Against
Oceansat
-
2 Satellite
Subekti Mujiasih
1and Eko Prasetyo
2Abstract Information on wind, which is one of selected marine weather forecasts, is very important to support sea transportation safety. To increase the forecast quality, the parameter should be verified. This study will provide spatial verification wind from wind waves model output against wind from oceansat-2 Satellite data and AWS on board (Automatic Weather Station). Wind of model output includes hindcast and forecast 18 hours ahead. The chosen sample data were some extreme conditions in Java Sea during November 2012 until October 2013. Despite the same trend of wind direction displayed by both model output and Oceansat-2, the study result found significant gap of wind speed. This information will be recommendation for marine weather forecaster.
KeywordsWind Verification, Marine Weather Forecast, Oceansat-2, Satellite
AbstrakInformasi tentang angin, yang merupakan salah satu ramalan cuaca laut yang dipilih, sangat penting untuk mendukung keselamatan transportasi laut. Untuk meningkatkan kualitas perkiraan, parameter harus diverifikasi. Penelitian ini akan memberikan angin verifikasi spasial dari output gelombang angin model terhadap angin dari Oceansat-2 Data satelit dan AWS di papan (Automatic Weather Station). Angin output model yang mencakup hindcast dan diperkirakan 18 jam ke depan. Data sampel yang dipilih adalah beberapa kondisi ekstrim di Laut Jawa pada bulan November 2012 sampai Oktober 2013. Meskipun tren yang sama arah angin yang ditampilkan oleh kedua model yang output dan Oceansat-2, hasil studi menemukan perbedaan yang signifikan dari kecepatan angin. Informasi ini akan menjadi rekomendasi untuk peramal cuaca laut.
Kata KunciVerifikasi Angin, Prakiraan Cuaca Kelautan, Oceansat-2 , Satelit
I.INTRODUCTION1
patial verification has been an important method and used for many studies. Spatial verification could be applied for hindcast and forecast model output. Forecasts of spatial fields involve the same parameter over a range of geographic locations. As with forecasts for a single point, these fields can be generated by statistical or dynamical methods, or a combination of these. The predictands can be either continuous or discrete, and the forecasts are expressed as a definite (deterministic) statement or in terms of probabilities. Forecast fields are generated by Numerical Weather Prediction (NWP) or numerical climate models generally consisting of deterministic forecasts of continuous variables, for example, Mean Sea Level Pressure (MSLP) or temperature over a region. These forecasts are spatially coherent since the forecast values at different grid points are related to one another through the dynamic relationships embodied in the models [1].
There are some new approaches of spatial verification, such as Neighborhood (fuzzy) verification methods, Scale decomposition methods, Object-oriented methods, and Field verification [2]. The study about verification method development has been done by Gilleland et al [3]. Besides that, wind verification from model output with neighborhood approach was conducted by Yoder [4].
1Subekti Mujiasih is with Agency for Meteorology, Climatology and
Geophysics (BMKG), Jl. Raya Tuban, Kuta 80361, Kabupaten Badung, Bali,Indonesia, E-mail: [email protected].
2Eko Prasetyo is with II Surabaya Marine Meteorological Station,
Agency for Meteorology, Climatology and Geophysics (BMKG), Jl. Raya Tuban, Kuta 80361, Kabupaten Badung, Bali,Indonesia, E-mail: [email protected].
Wind verification of model output can be done by using in situ observation data or remote sensing data such as satellite or radar. There have been some studies of wind verification using satellite and buoy data. Chen
compared NOAA winds with SOA and CWB winds using time series, scatter diagram, and basic statistics. All in all, the comparison indicated that NOAA winds were only marginal in agreement with the buoy data. He suspected the quality of the SOA and CWB buoy data was poor because they seemed rough by eyeball inspection. Nevertheless, according to other studies, NOAA winds have proven good performance compared to global buoy data and could be used for the wave model in Far East Sea [5]. Jin Mathew in his research has verified wind speed and direction and significant wave height for each grid. Wind and wave model are interpolating to grids by two dimension interpolation. The used verification method was statistics/skill scores based on contingency table, in which wind speed and direction and wave height are grouped by some categories [6]. In addition, wind verification using only satellite data has been done by V. Djurdjevic and B. Rajkovic from Belgrade University, Belgrade, Serbia and Anton Verhoef and Ad Stoffelen from KNMI. Wind verifications were performed using the satellite based Quikscat scatterometer. Quikscat provided scientists and weather forecasters with data on ocean winds at 25-km resolution and a typical accuracy of 1 m/s in speed and 15_ in direction. The 10-m wind verification was conducted for one period of 17 days in February 2007, during a strong bora period, for which satellite estimates
of surface winds were available. Since ECMWF‟s
analysis were weaker than the satellite estimates, with a
mean BIAS of −0.8 m/s.[7][8].
Scaterometer has enhanced development by launched OSCAT, which replaced Quickscat product. The measurement of OSCAT and Quikscat showed that OSCAT had better resolution than Quickscat although the output was still contaminated by rain. The OSCAT is a Ku-band conically scanning scatterometer system designed and built by the India Space Research Organization (ISRO)/Space Applications Center (SAC). OSCAT was launched aboard the Oceansat-2 satellite on September 23, 2009. The Oceansat-2 satellite flies in a near-polar sun synchronous orbit at 98 degrees inclination at approximately 720 km orbit height. Swath width is 36 50 km size WVCs. Products organised in files containing one orbit [9]. The OSCAT ocean surface wind retrievals represent a 10 meter neutral stability wind. The NOAA OSCAT wind retrievals are processed with the Scatterometer Wind Data Processor (SWDP) was developed at the NESDIS/Center for Satellite Applications and Research and utilized the OSCAT L1B and Level 2 products data provided by ISRO on an orbit-by-orbit basis via EUMETSAT. The current geophysical model function (GMF) being used is derived from NSCAT-2 and was provided by the Scatterometer Project at the NASA/Jet Propulsion Laboratory, where the GMF relates the normalized radar cross-section to the ocean surface wind speed and direction. The wind vector retrievals flagged as potentially being contaminated by rain are colored in black. The current rain flag is under-flagging for rain. For closer examination of the wind fields, the global image is further divided into 30x20-degree bins between latitudes 80N to 80S and longitudes 180W to 180E, forming a HTML link map for the regions of interest. They are capable of systematically providing measurements over the entire globe. Sensors operating at microwave frequencies can make measurements of the ocean surface day and night and under nearly all-weather conditions. Both active (radar) and passive (radiometer) microwave sensors have been proven capable of retrieving the ocean surface wind speed, with active microwave instruments being used to also retrieve the wind direction. With the Navy's WindSat mission, a space-based radiometer system has also been proven capable of determining the wind direction using polarimetric and multi-look observations. However, the presence of significant cloud liquid water presents significant challenges for the passive polarimetric technique and thus limits its utility in supporting operational marine weather forecasting and warning. Ocean Surface Wind products currently available include Wind Vector fields derived from Quikscat, ASCAT, WindSAT and ERS-2.Wind Speed fields derived from SSM/I. Other products include: Rain, Sea Ice, SST and Water vapor. The data products derived from the Oceansat-2 Scatterometer (OSCAT) observations include: NOAA OSCAT Ocean Surface Wind Vector Retrievals at 25 km resolution, NOAA OSCAT Ocean Surface Wind Vector Retrievals at 12.5 km resolution, NOAA OSCAT Ocean Surface Wind Vector Retrievals at 50 km resolution, ISRO OSCAT Ocean Surface Wind Vectors Retrievals at 50 km resolution, OSCAT Ice Products, and OSCAT Sea Level Pressure [10]
In this study, Authors will verify wind from Windwaves-05 output of BMKG (Indonesian Meteorological and Geophysical Agency). Windwaves-05, the developed Windwaves-04, is second generation which is designed for deep sea in daily operational forecasting. In this model, sea base effect and shallow water effects are not considered. Windwaves-05 is designed for operational usage which is appropriate with Numerical Weather Prediction standard of 4 times a day as well as analysis hours 00, 06, 12, 18 UTC. It is used to Current Surface (wind driven), Ekman Pumping, Vorticity and wind stress [12]. Authors will verify wind 10 meter spatially. The used method is Visual (eyeball), which compares maps of forecast and observations visually. The Advantage of this method is the picture can tell a thousand words. However, the disadvantage is labor intensive, not quantitative, subjective [2]. This study is still preliminary step. Authors aim at getting differences and similarities between the pattern of windwaves-05 output and that of Oceansat-2. We hope the result can be considered as input for marine weather forecaster. used again in combination with the pennant(s). The wind direction is indicated by the long shaft. The shaft will point to the direction from which the wind is blowing. The direction is based upon a 36-point compass in figure 1 [13]. Wind Direction and Degrees is displayed in figure 2.
Domain studies both satellite and windwaves spreaded about 105o-115o E, 3.5o – 9o S. Spatial resolution of Windwaves model output was 30 minutes (50 km), whereas Spatial Resolution of Scatterometer was 25 km. Period of data was since November 2012 – October 2013. One date sample was selected every month, which was the most extreme condition. Input of Windwaves-05 model was GFS wind of 12.00 UTC. The data on 12.00 UTC was chosen with two criteria, availability and nearest time. Model outputs included reanalysis 06.00 Z and 18-hour forecast. Wind from model output will be compared with Oceansat-2 and Automatic Weather Station on board. The oceanSat-2 was available between 04.00-04.09 UTC, using 25 km resolution for easier analysis process. We did not use specific Oceansat-2 raw data, but we used image from the website [10].
Automatic Weather Station on PELNI‟s Ships (National
raya, KM.Kelud, KM.Lambelu, KM. Lawit, KM.Tidar [15]. The used verification method was Eyeball Verification, which gives qualitative description. We call it Visual verification because we did not use exact data which has specific coordinate and value, and the result
obtains “tend to/interval” not “exact value of measure”.
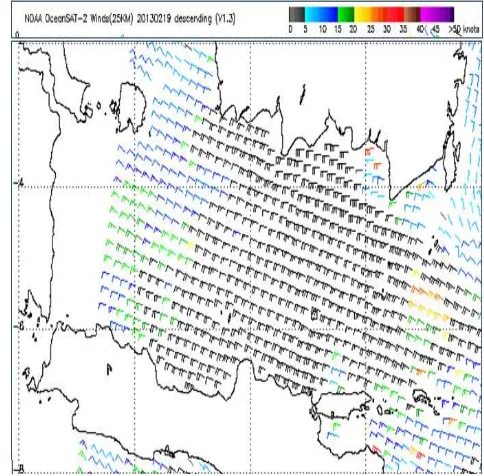
Authors made estimation only from image data. Authors would like to unveil differences and similarities concerning wind speed and direction of both patterns. If there was a big difference, it became special issue for forecaster. If there was similarity, we can guarantee the forecast was trusted. This study gave two comparisons. First, we compared wind patterns based on domain area (not specific coordinate) of wind hindcast, wind forecast and wind Oceansat-2. The result was displayed in table 1. We gave one sample, which was the most extreme wind on 19 February 2013 in figure 3, 4 and 5. Second, we compared wind data for specific locations based on ship position. The second result was displayed in table 2.
III.RESULT AND DISCUSSION
From Table 1 we made some analysis. The black barb signs data were contaminated by rain. Black color did not mean more than 50 knot wind speed. However, authors still considered this data based on barb symbol because it shows 20 knots – 35 knots, generally see Figure 5. It should be verified.
In table 1, Author analyzed pattern of wind direction and pattern of wind speed. Pattern of wind direction from Model Output was not far different from pattern from Oceansat-2. However, for wind speed, 20-35 knots wind speed happened every month from Oceansat-2 except 26 May 2013. This was very different wind speed between model output and Oceansat-2. The difference could reach 10-25 knots both Hindcast against Oceansat-2 and Forecast against Oceansat-2. For example: based on data on 23 November. Hindcast and Forecast showed 0-5 knot, whereas Oceansat-2 showed 10-35 knots. There was big gap. Other dates which have similar result were 23 November, 25 December 8 January, 15 March, 18 April, 13 June, 11 July, and 17 October. Was this real condition or incorrect Oceansat-2 observation or not? We think Oceansat-2 may be still affected by atmosphere condition. Besides that, the result interval was valued based on Area, not specific location or certain coordinate. Since it may be subjective interpretation authors doubt with this result. Author compared the Oceansat-2 with AWS on board observation. The data was taken at Ship position at certain time, in which Oceansat-2 data were available. The result showed in Table 2.
From Table 2 we analyzed the difference of wind from 3 sources, such as model, satellite and AWS on board.
We compared both wind direction and wind speed. First, there was similar result of wind direction from all sources. It appeared almost all dates except 23 November, 19 February and 26 May. It showed that wind direction from satellite and ship observation could be reference to control our model especially the forecast information. Second, there were 6 data of wind speed which complied between forecast and ship observation such as 25 December both Dempo and Lawit, 26 May, 11 July both Dempo and Lawit, and 17 October from Bukit Raya. Furthermore, there were only 4 similar data
of wind speed between forecast and Oceansat-2, such as 8 January both Lambelu and Lawit, 26 May, and 26 August. Third, There were 4 data of wind speed which complied between Oceansat-2 and Ship observation such as 8 January from Dempo, 11 July from Lawit, 5 September-17 October from Lawit. Fourth, There is no big difference between model output and Oceansat-2 and Ship observation except 8 January from Bukit Raya and 19 February. We divided interval wind speed into 0-5, 5-10, 10-15, 15-20, 20-25,-25-30. 0-5 knot interval was closer to 5-10 knots interval, 5-10 knot interval was closer to 0-5 knots interval, and 10-15 knot interval, but, 0-5 knots interval was not closer to 15-20 knots interval or 20-25 or 25-30. Big difference means there were more than 1 interval differences.
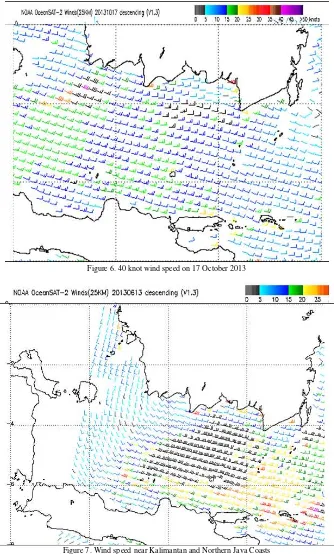
Fifth, From Oceansat-2, we found 40 knots wind speed in the Southern Karimata Strait on 17 October (figure 6) and in the Southern Kalimantan on 19 February. Sixth, From Oceansat-2, we found some coasts got high wind speed about 25-35 knots such as 23 Nov, 25 Des, 19 Feb, 15 March, 18 April, 26 August, 13 June (figure 7), 11 July, and 5 Sept. If it was valid, it would be dangerous for shipping and coastal society. Then again more tests should be conducted to confirm the validity. From the six findings, we suggested forecaster should consider wind from SHIP first. If there is no Ship data, they can use Oceansat-2 Observation. Strength of Oceansat-2 was the observation could cover wide area and supply colored image for easier display. The weakness of Oceansat-2 was it provided only twice-a-day data, such as 16.00 UTC and 04.00 UTC pass Indonesia Area. The raw data format was more difficult to be extracted since it depended on internet connection, which belongs to other countries. Strength of Ship data was being daily available even in minute step and BMKG own source. The weakness of Ship observation was the data depending on SHIP operations.
III.CONCLUSION
Wind of model output has good performance with Ship observation data. The model output has similar result with data on ship, which can be useful for verification. In contrast, Wind 10 m data from Oceansat-2 was less reliable for verifying forecast information. Oceansat-2 has bigger gap result than model output and SHIP. Oceansat-2 can be taken into consideration if wind data from SHIP was not available.
REFERENCE
[1] Ian T Jolliffe and David B Stephenson, Forecast verification: A Practitioner’s Guide in Atmospheric Science. Chester, England: John Wiley & Sons Ltd, 2003.
[2] E Bert, "Feature-specific Verification of Ensemble Forecasts," in
4th Int'l Verification Methods Workshop, Helsinki, 2009, pp. 1-26.
[3] E Gilleland, D Ahijevych, Barbara G Brown, B Casati, and Elizabeth E Ebert, "Intercomparison of Spatial Forecaster Verification Methods," American Meteorological Society, vol. 24, pp. 1416-1430, October 2009.
[4] H S Chen, "NOAA Surface Winds in Far East Sea during June through October 2001," in The Eight OMISAR Workshop on Ocean Models., Hongkong, 2002, pp. 10.1-10.6.
[5] Matthew Jin, "NWS Gridded Marine Verification Derivation of
„True‟ Wind/Wave Fields at NDFD Grids Using A
[6] V Djurdjevic and B Rajkovic, "Verification of a Coupled Atmosphere-Ocean Model using Satellite Observations Over the Adriatic Sea," Annales Geophysicae, vol. 26, pp. 1935-1954, July 2008.
[7] A Verhoef and A Stoffelen. (2013, May) KNMI (Royal Netherlands Meteorological Institute). [Online]. http://www.knmi.nl/scatterometer/osisaf/
[8] A Verhoef and A Stoffelen. (2012, August) KNMI (Royal Netherlands Meteorological Institute). [Online]. www.knmi.nl/publications/fulltexts/oscat_validation_1.0.pdf [9] Megan Yoder, Verification of Winds Speed using a
Neighborhood Approach, 2010, SIPARCS Program-Summer 2010 NCAR.
[10] STAR Team. (2013, July) The Center for Satellite Applications
and Research (STAR). [Online].
http://manati.star.nesdis.noaa.gov/products.php
[11] Suratno, Panduan OPerasional WINDWAVE-04. Jakarta, Indonesia: Pusat Informasi Metereologi Penerbangan dan Maritim, BMG, 2004.
[12] Suratno, "Intrepretasi Windwaves-05," in Pelatihan Peramalan Cuaca Meteorologi Maritim, Jakarta, 2008.
[13] Minnesota Climatology Working Group. (2013, November)
Minnesota Climatology Working Group. [Online].
http://climate.umn.edu/snow_fence/components/winddirectionand degreeswithouttable3.htm
[14] National Weather Service. (2013, October) National Weather
Service. [Online].
http://www.srh.weather.gov/jetstream/synoptic/sfc_plot_symbols. htm
[15] Informasi Meterologi Maritim, BMKG. (2013, November) Informasi Meterologi Maritim, Badan Meteorologi Klimatologi
dan Geofisika. [Online]. Available in Website
http://maritim.bmkg.go.id/index.php/aws.
Figure 1. Wind barb
Figure 2. Wind Direction Figure 3. (Hindcast) Analysis 19 February 2013 at 06.00 UTC
Figure 4. 18 hours Forecast ahead valid for 19 February 2013 at 06.00 UTC
Figure 6. 40 knot wind speed on 17 October 2013
TABLE 1
(Reanalysis 190213 06z) W-NW 10-25
F18 ahead 180213 12z NW-WNW 15-25 5
(Reanalysis 180413 06z) VARY 5-10
F18 ahead 170413 12z VARY 5-10 25
(Reanalysis 260513 06z) SW-W 5-10
F18 ahead 250513 12z SW-W 5-10 5
(Reanalysis 130613 06z) E-SE-S 5-15
TABLE 2.
COMPARISON OF WIND 10M FROM HINDCAST,FORECAST,OCEANSAT-2 AND AWS ON BOARD
No Date/time Ship
Name
Ship
Position Parameter
Model
Hindcast 18 Forecast Oceansat-2 AWS on Board
1 25-Dec-12
04:05:00 UTC
Dempo -6.57 (S) Wind Direction SW SW W-NW 50.00 (NE)
111.98 (E) Wind speed (knot) 0-5 0-5 10-15 2.10
Lambelu -6.55 (S) Wind Direction WNW W W-NW 300.00 (WNW)
113.75 (E) Wind speed (knot) 5-10 0-5 5-10 3.90
2 08-Jan-13
04:05:00 UTC
Bukit Raya
-6.49 (S) Wind Direction W W W-NW 260.00 (W)
113.31 (E) Wind speed (knot) 15-20 15-20 10-15 7.10
Dempo -6.61 (S) Wind Direction W W WSW-W 250.00 (WSW)
112.10 (E) Wind speed (knot) 10-15 10-15 5-10 6.40
Lambelu -6.36 (S) Wind Direction W W WNW 300.00 (WNW)
114.40 (E) Wind speed (knot) 20-25 20-25 20-25 18.20
Lawit -3.94 (S) Wind Direction NW NW WNW 300.00 (WNW)
110.04 (E) Wind speed (knot) 10-15 10-15 10-15 8.80
3 19-Feb-13
04:05:00 UTC Dempo
-6.62 (S) Wind Direction WNW WNW WNW 290.00 (WNW)
112.13 (E) Wind speed (knot) 15-20 15-20 20-30 10.80
4 26-May-13
04:06:00 UTC Lawit
-5.90 (S) Wind Direction W SE S 130.00 (SE)
109.24 (E) Wind speed (knot) 10-15 0-5 0-5 2.50
5 11-Jul-13
04:04:00 UTC
Dempo -6.81 (S) Wind Direction ESE SE SSE 150.00 (SSE)
112.96 (E) Wind speed (knot) 0-5 0-5 5-10 1.70
Lawit -3.05 (S) Wind Direction S S SE 140.00 (SE)
113.05 (E) Wind speed (knot) 0-5 0-5 0-5 2.20
6 26-Aug-13
04:04:00 UTC Tidar
-6.31 (S) Wind Direction ESE ESE SSE 60.00 (ENE)
114.72 (E) Wind speed (knot) 15-20 15-20 15-20 10.10
7 05-Sep-13
04:06:00 UTC Lawit
-7.20 (S) Wind Direction SSE SE SE 140.00 (SE)
112.73 (E) Wind speed (knot) 5-10 5-10 0-5 2.60
8 17-Oct-13
04:03:00 UTC
Bukit Raya
-6.93 (S) Wind Direction SE SSE SE 110.00 (ESE)
110.42 (E) Wind speed (knot) 5-10 5-10 5-10 7.70
Lawit -3.35 (S) Wind Direction ESE ESE E 120.00 (ESE)