1
ANALYSIS OF RETURN STOCKS AFFECTED BY STOCK TRADING
SUSPENSION IN INDONESIA STOCK EXCHANGE
By Prakarsa Panjinegara
ABSTRACT
Suspension is a temporary suspended of shares trading in the Securities Exchange. The termination can be caused due to the request of the Issuer itself or the stock decision in order to provide protection to investors or it may be due to the imposition of sanctions by the Stock Exchange to an Issuer. Information about the suspension is the category of Bad News, in general, will lead to the decline in return stock to the companies that affected by the suspension.
This research is an event study that refers to an occurrence which allegedly that will affect the decision making of investors to buy the shares. The results of the study showed information the suspension of the company cause fluctuations in the return stock suspension and inflicted the negative abnormal return.
Keywords: Event Study, Suspension, abnormal return.
1, INTRODUCTION
The Indonesian capital market is a part of the Asia emerging market that more increase the capitalization in each year. Along with the development of technology information, more increase the number of market players in Indonesia Stock Exchange so that there is a need for information disclosure for investors to improve the credibility and market efficiency.
2 The Indonesian capital market will be more efficient when the faster new information available on the market is reflected in the securities price of the capital markets. The information here consists of historical data information, the published data and private data of the company.
Temporary Suspension of stock trading (suspend) by Indonesia Stock Exchange (IDX) is one of the information published by the BEI managers for all issuers in the market. Based on the rule, number III-G Kep-00086/BEI/10-2011 about the revocation of the suspension and the Exchange Membership approval by Indonesia Stock Exchange. The suspension is one of the rights owned by the stock exchange to stop suspend stock trading according to the specified time of securities trading. Against trade activities members of a Securities Exchange as the penalty for violations by the Issuer or a member of the securities exchange, or due to demand from the Issuer exchange member, Bapepam-LK or because of the consideration the exchange. Suspend sanctions provided for Issuers is a category of bad news that can affect the value of stock trading for Issuers so that there is a need clarification or improvement effort for errors that have been done.
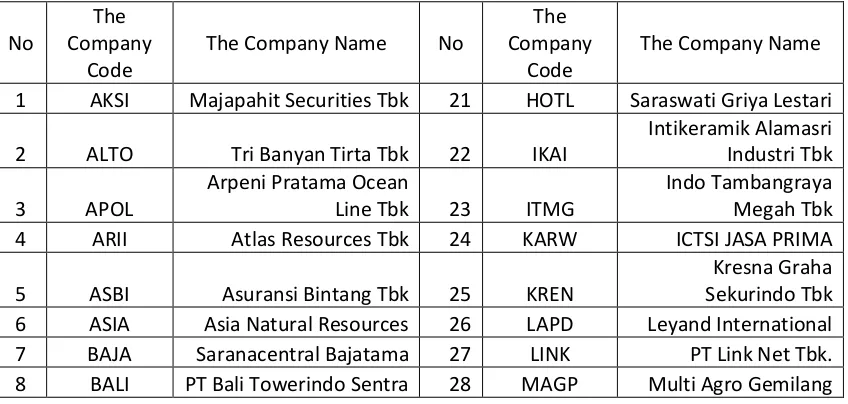
The following is a list of Issuers companies that affected suspend sanctions in 2014:
Table 1.1. The list of the Companies (Issuer) affected by the Trading Suspension in 2014
Normally, all market players did not want the loss at the time of the investment. All forms of information are considered in the decision. This also applies to the transaction related to the capital market activity. It better before investing, investors see information in newspaper and news from the internet to be able to predict the future information that will come due to choosing the secure investment required the careful analysis and accurately supported data.
4 The Capital Market is the compartment for investors to invest with the hope it will gain the profitability of the capital that has been issued. The desire of investors to invest in the capital market is affected by the information obtained by the investor which is used as the guidelines to determine the policy that will be taken. Good information will react positively to emerging markets while conversely wrong information will react negatively in emerging markets.
II. BASIC CONCEPT OF EFFICIENT MARKET
The first concept of the efficient market has been stated and popularized by Fama (1970). In this context what is meant by the market is the capital market and the money market. A market can say efficient when no one, both individual investors and institutional investors will be able to obtain the abnormal return, after adjusted for risk, using existing trade strategy. This means that the stock prices reflect all available information.
According to Fama (1970) form of the efficient market can be grouped into three, known as the efficient market hypothesis. The three forms of efficient markets are (1) had the weak eyes form of the efficient market hypothesis, (2) semi-strong form of the efficient market hypothesis, and (3) strong form of the efficient market hypothesis. Each of the forms of the efficient market is closely related with as far as where the absorption of information occurred in the market.
5 information including inside or private information. Each of the groups of the information reflects the extent of the efficiency of a market. Jones (1998) stated that the price is now share (securities) reflect the two types of information, namely the information that is already known and information that still needs suspicion. The information is already known covers two kinds, namely the past information (e.g. profitability years or the last quarter) and current information as well as Genesis or events that have been announced but still will occur (e.g. the plan of separation share). For example, the information still needs suspicion if many investors believe that interest rates will soon come down, prices will reflect this belief before the actual decline occurs.
6 the volatility stocks LQ45 significantly. From 45 shares including abnormal in the highest return only reach 0,009726 achieved on day 4 after the event date. The positive abnormal return value for 21 days observation totals only 8 days, while the negative value abnormal returnamounted to 13 days. Thus this shows that the capital stock market in Indonesia is the half a powerful, efficient capital market because of the bailout announcement information Dubai World are not reflected in the price and return share the LQ45.
Wiyanto (2002) in the research entitled "Weak Form Market Efficiency test on cigarette industry stocks in the Jakarta Stock Exchange covering period 1999-2001 (Divination Box-Jenkins Methods and Runs Test)". This research is a test of weak form market efficiency in the cigarette industry stocks in the Jakarta Stock Exchange period 1999-2001. The results of the analysis identify that cigarette industry stock markets in the BEJ categorised in the market are not efficient in the form of weak. This condition can be used by investors to obtain the abnormal return because the price in the past can be used to predict the price in the future.
III. Research Methodology
Research Methodology is the steps of research that will be done in writing a scientific paper. The stages of the research determined first in advance so that the research more focused and provided a clear picture about what steps that must be done.
3.1 Research Period and Place
3.1.1 Research Period
7 suspension is obtained through the Indonesia Stock Exchange, with the assumption, there is no corporate action.
3.1.2 Research Place
The research was done on all affected suspension shares with the Composite Stock Price Index (IHSG) and sectoral stock price index (IHSS) in Indonesia Stock Exchange.
3.2 Types of Data
The type of data that is used in this research is secondary data; it is the field research results data obtained by collect data on the company shares that affected suspension on IDX in 2014. According to how collect the data that is needed in this research is in the form of the data time series.
3.3 Data Collection Method
3.3.1 Literature Research
This literature research was done by collecting and reading from various literature, good financial journals and reference in the form of books and newspapers, magazines or the internet and learn the theories related to this research.
3.3.2 Field Research
Field research was done by visiting the Capital Market Reference Center in Indonesia Stock Exchange. The methods used in this field of research is the documentation method; it performs data collection and recording of data that is required in this writing.
3.4Population and SampleResearch
8 The population in this research is all the shares that listing and suspension in Indonesia Stock Exchange in 2014.
3.4.2 Research Samples
The determination of the sample research based on the method purposive sampling with the criteria among others:
1. The companies which listing in Indonesia Stock Exchange.
2. All Companies affected by the suspension in 2014 but revocation sanctions in 2014. 3. The suspension companies that are trading actively in 2014 on the outside of the
period of suspension.
Based on the criteria specified and there are only 5 samples companies that worthy meet the criteria include:
No Code Issuer Name
1 BUMI Bumi Resources Tbk
2 BWPT Eagle High Plantations Tbk 3 ITMG Indo Tambangraya Megah Tbk 4 KREN Kresna Graha Sekurindo Tbk 5 PKPK Perdana Karya Perkasa Tbk Source: IDX 2014
3.5 Time Range Selection Patterns with Events Study
9 45 days, window period during the 15 day before, when suspension and 15 days after taking the sanctions suspension by IDX in 2014.
t1 H-45before t2 H-15 t0 H+15 t3
The estimation period The window period Picture 6 . The Event Study Pattern
Source: Jogiyanto (2009:559)
3.6 Operational Variables Definition
1. Shares return is the rate of return from an investment share. Return on this research is an Issuer return shares.
2. Beta share is returned volatility measurement securities to market return. Beta on this research obtained with how regression (Ri-Rf) as dependent variables and (Rm -Rf) as
independent variables during the period of the estimation before the suspension.
3. Expected Return is the rate of return or expected profit by investors, in this research which was the expected return of an Issuer shares. Expected return is calculated by using the estimation model of the Capital Asset Pricing Model (CAPM).
4. Abnormal Return share is the difference that obtained between the realisation return and expectation return. Abnormal return that calculated in this research is abnormal return before the suspension and abnormal return after the revocation suspension.
10
3.7 Analysis Tools
Data analysis method used as follows:
3.7.1 Normality Assumption Test
The assumption normality test is to know whether the data is normally spread. The assumption normality test can be seen by Augmented Dickey Fueller (ADF) test.
3.7.2 Formation CAPM Model and Search for Abnormal Return
1. Calculating Stock Return
Calculating the stock return every day during the period of estimation that calculated by using this formula:
Pt- (Pt - 1)
Ri = + Dt Pt-1
Where :
Ri : Return on day t
Pt : Share price ( closing price ) on the day of t (in rupiah)
Pt-1 : Share price ( closing price ) on the day of t-1 (in rupiah)
Dt : Dividend Share at t period 2. Calculating Daily Market Return
Calculating the daily market return is calculated with the following equation, with market dividend assumption is not counted or considered as zero.
IHSGt- IHSGt-1 Rm= + Dt IHSGt-1
Description:
Rm = Market Return
IHSGt = The securities market price index in the period to-t
IHSGt-1 = The price of securities markets in the period to the previous t
Dt = Market Dividend t period
3. Regressing (Ri-Rf) and (Rm
-
Rf)
to Form CAPM Model
4. Calculating Abnormal Returnto the Window Period
The calculation of Abnormal Return using the formula :
ARi,t= Ri,t- E (Ri,t)
Description :
ARi,t = Securities Abnormal Return to-i
Ri,t = The return happens to securities to-i in the period of the event to-t
E(Ri,t) = Securities Expected Return to-i in the event period to-t 5. Calculate the Standardization Abnormal Return
ARSi,t : ARi,t KSEi
Description :
ARSi,t : Standardization Abnormal Return of Securities to-i on the day to-t in the
window period
CARt : Cumulatif Abnormal Return securities to-t in the window period
∑ARt-1 : Total number of Abnormal Return securities before t in the window period
ARt : The securities Abnormal return to-t
3.7.3 Average 2 Varies Test
1. In this study using the average 2 varies test with the paired sample t-test by comparing return between before and after the suspension in IDX.
X1 – X2 Tcount =
(n1– n) (SD21) + (n2– 1) (SD22) 1 + 1
12 Where:
X1 = The average abnormal return before Suspension X2 = The average abnormal return after Suspension SD21 = Standard deviation before Suspension
SD22 = Standard deviation of Suspension N = Number of samples
2. Determine the region of acceptance and rejection of the zero hypothesis (Ho) Ho accepted or Ha rejected if: t count < t table
Ho rejected or Ha accepted if: t count > t table
3. Compare t count with t table can conclude based on the statisitic test that has done. The author uses the level of trust in 95% or α = 5%.
3.8 Hypothesis Testing
There are 10 samples of the issuer stocks in this research; the research object is the assumption of the company stocks, and there is historical price data.
The hypothesis testing that used in this research are:
1. Normality Test
Ho: the data normally distributed
Ha: the data are not normally distributed
With the level of confidence 95%, then when Probability < 0.05: Reject Ho
Probability > 0.05: Do not reject Ho
2. The Average Two Different testst test
Ho: There is no a significant difference between the average abnormal return on
13 Ha: There is a significant difference between the average abnormal return on
Manufacture stocks between before and after the Suspension.
If Ho was rejected and Ha accepted means, there is a significant difference between the average abnormal return as a result of Manufacture stocks between before and after the suspension.
IV. RESULT AND DISCUSSION
4.1 Results
4.1.1 Stationary Data Test Result
Before analysis the abnormal return stocks test of the companies that are affected by the suspension, the first thing has to do is testing the stationary data. The stationery data test used to test the data behaviour that will be used. Stationary data has the tendency of the data variation is not great and approaching the average value, instead of the data is not stationary have larger variation data with the average value (Insukindro, 1991).
The regression using data not stationary in general has a value R-square which is relatively high, but having the statistic value of the low Durbin Watson. That will affect the regression happens to be spurious or irregular so that the coefficient regression assessor will not efficient, and the regression forecasts will be missed then the result is not valid (Insukindro, 1991).
14 The stationery data test using the unit root tests by using the model of the Augmented Dickey Fuller (ADF) using the statistic EVIEWS 8.1 program.
The result of stationery data test summarized in the Table IV.1 among others:
The table IV.1. Test results Stationary
Variable ADF (Prob.Value)
t Prob.
RIHSG
-6.281056
0.000
SBI -7.128417 0.000
Return BUMI -9.594286 0.000
Return BWPT -7.929213 0.000
Return ITMG -3.593008 0.000
Return KREN -5.578658 0.000
Return PKPK -7.767663 0.000
Test Critical Value
1% -3.519050
5% -2.900137
10% -2587409
Source: Processed Data
Based on the table IV.1, seen that all variables data that used stationary on the initial level and significant at the alpha level 1%. It shows that the variable data used does not have the unit roots.
4.1.2. The formation of Expected Return (E(R))
The formation of the expected return model in this research using CAPM model with fluently time data during 52 days before the suspension. The steps which applied in the formation of each company expected among others:
15 2. Determine the value of the free risk-return using the daily standard value of interest rate in
the Certificates Bank Indonesia during estimation period.
3. Determine the return of the market that uses the data changes of Composite Stock Price Index (IHSG) during the estimation of the research period.
4. The formation of CAPM model by forming an equation regression: R-Rf = (Rm-Rf).β + a
From the equation model be obtained Beta (β) value produced can be used as the former model of CAPM in order to get the Expected Return (E(R)) value with equation:
E(R ) = Rf + (Rm-Rf). β
The formation results of each equation regression using EVIEWS 8.1 can be seen on the attachments 1.1 with expected return model of each company as follows:
E(R) = Rf + β (Rm-Rf)
E(RBUMIt) = Rf + 0.007742 (Rm - Rf)
E(RBWPT,t) = Rf + 0.118507801625 (Rm - Rf)
E(RITMG,t) = Rf + 0.0788356271004 (Rm - Rf)
E(RKREN,t) = Rf + 0.000621 (Rm - Rf)
E(RPKPK,t) = Rf + 0.011955 (Rm - Rf)
4.1.3. The Calculation Results of the Abnormal Return and Abnormal Cumulative
Return
The calculation results of the abnormal return of each company uses the difference between the realization return with the expected return model (R-E(R )) can be seen in the table IV.2. The table IV.2 Abnormal Return the Companies Affected by the Suspension in 2014
The day to AR BUMI AR BWPT AR ITMG AR KREN AR PKPK
The calculation results of the abnormal return company can also be seen in the picture IV.1, which shows the movement of abnormal return stocks which fluctuate before and after the suspension on the companies.
Source: processed data
Day to
Pcture IV.1 The movement Abnormal Return Companies Stocks Affected The Suspension on IDX in 2014
Day to
17 In the picture, IV.1 showed that BWPT share has the movement of abnormal fluctuation return stock greater after the civil suspension revocation compared with the other stocks. This shows the influence of suspension information more has the real impact on investors in BWPT shares that do the transaction stock trading. Based on the calculation results of abnormal return stock of each company can be determined the cumulative value of abnormal return stocks enumerates the value of abnormal return from 15 days before the suspension and 15 days after suspension revocation as shown in Table IV.3.
The table IV.3. The results of the calculation Cumulative Abnormal Return the companies affected by Suspension on IDX in 2015.
suspension -0.30461 -0.36648 -0.29966 -0.30328 -0.366
After taking the
suspension -0.6128 -0.08794 -0.68989 -0.26469 -0.32611
Source : The Data processed
The table IV.3 shows that there are two types of emitting companies which have the cumulative impairment of abnormal return stocks after a suspension, specifically the shares of BUMI (Bumi Resources Tbk) and ITMG (Indo Tambang Raya Megah Tbk). While the others three types stocks experiencing the cumulative value abnormal return stock which increased, specifically the shares of BWPT (Eagle High Plantations Tbk), KREN (Kresna Graha Securindo Tbk), and PKPK (Prime Paper Mighty).
18 The table IV.4 The results of the calculation the Average Abnormal Return (AAR) and Cumulative Average Abnormal Return (CAAR) The Companies which Affected by Suspension on IDX in 2014.
19
4.1.4. Test results vary two average of t Test
Two different tests the average t-test is used to see the difference in the average from the results of abnormal return before and after the suspension event of company shares that affected suspension companies. The results of the vary two the average abnormal return stocks affected by the suspension test can be seen in the Table IV.5.
Table IV.5 Test Results Vary Two the average Abnormal Return Shares affected by Suspension in BEI Year 2014
Test results vary 2 average shows the results of t-tests that are not significant with probability 0,5532 greater than significant rank 10% indicates that there is no distinction of significant abnormal return before and after the suspension.
This shows the initial hypothesis (Ho) which indicates there is no difference in the average abnormal return before and after the suspension event received, while the final hypothesis indicates there is a difference of the average abnormal return before and after the suspension event rejected.
4.2. Discussion
The overall research results using the expectations model of the Capital Asset Pricing System (CAPM) with the average two different test methods sample t-test showed that the value of
Test for Equality of Means Between Series
Sample: 1 15
Included observations: 15
Method df Value Probability
t-test 28 0.600183 0.5532
Satterthwaite-Welch t-test* 19.01101 0.600183 0.5555
Anova F-test (1, 28) 0.360219 0.5532
Welch F-test* (1, 19.011) 0.360219 0.5555
20 the probability t-count greater than the probability t-table with the greater significance than 0,10. This result received the initial hypothesis that says there is no difference between the average abnormal return share before and after the suspension event that happened in the company. There is no difference between the average abnormal return shares occurred shows in the information that has been absorbed by the market so the investors do the anticipation on stock price changes.
The results of this research also support the previous research which stated that the capital market in Indonesia Stock Exchange efficient, which means that the price has capital markets reflects the information content that occurs in markets.
V . CONCLUSION AND SUGGESTIONS
V.1 Conclusion
Based on the results and the discussion of the research done so it can be taken some conclusions among others:
1. Test stationery test results with the ADF test indicates that the overall variable used is stationary with the level of the smaller significance from 0,01, which means the research of data used does not have the roots of the unit which may cause lead to the spurious regression.
2. The results of the abnormal's cumulative return share value before and after the negative value suspension showed negative sentiment market against the suspension information on the companies affected by the suspension.
21 suspension event indicates that the information has been absorbed by the market and investors have been anticipating the changes of return shares in BEI. The situation supports the previous research which stated that the Indonesian capital market is located on the efficient condition.
V.2. Suggestions
1. When the perpetrators of the investment take a decision to invest in the capital market preferably first seek clarity regarding the information that is going on related to the type of shares that will be invested in.
2. The suspension event is the event that occurs as a result of an error by the company causing negative sentiment in the market. The company should avoid the suspension by following the rules that have been set by the managers of the capital market.
22
BIBLIOGRAPHY
Ary Gumanti, Tatang dan Sriutami, Elok (2002), “Bentuk Pasar Efisien dan Pengujiannya”,Jurnal Akuntansi & Keuangan Vol. 4, No1, Mei 2002:54-68
Fama, Eugene F. (May 1970), “Efficient market: A review of theory and empirical work”,
Journal of Finance, 25 (2): 383-417.
Fama, Eugene, F. (1991), “Efficient Capital Markets: II”, Journal of Finance, 46 (4):1575-1617.
Francis, Jack Clark, Investment: Analysis and Management. Fifth Edition,Singapore:McGraw-Hill Inc.
Haugen, Rober A. (2001), Modern Portfolio Theory, 5th Edition, Prentice Hall, New Jersey. Hartono, Jogiyanto, Prof. Dr., MBA., Ak. 2009. Teori Portofolio dan Analisis Investasi.
Yokyakarta : BPFE Yokyakarta.
Hartono, Jogiyanto, Prof. Dr., MBA., Ak. 2005. Pasar Efisien Secara Keputusan. Jakarta : PT Gramedia Pustaka Utama.
Husnan, Suad. 2003. Dasar-dasar Teori Portofolio dan Analisis Sekuritas”. Yokyakarta : UPP AMPYKPN.
Indarti, Johana. 2003. Analisis Perilaku Return dan Aktivitas Volume Perdagangan Saham di Bursa Efek Jakarta (Event Study : Dampak Peristiwa Bom Bali Tanggal 12 Oktober 2002 pada Saham LQ 45). Magister Manajemen Universitas Diponegoro, Semarang. Insukindro, 1991, Regresi Linier Lancung dalam Analisis Ekonomi: Suatu Tinjauan dengan
satu studi kasus di Indonesia, Jurnal Ekonomi dan Bisnis Indonesia, No.1 Tahun VI. Jones, Charles P. (1998), Investment: Analysis and Management, John Wiley and
Son,California, 6th Edition
Koetin, E.A, Analsis Pasar Modal. Jakarta:Pustaka SinarHarapan,1996.
Le Baron, Dean (1983), “Reflections on Market Inefficiency”, Financial Analysts Journal, 39 (May/June): 16-23.
23
Malkiel, Burton (1989), “Efficient Market Hypothesis”, dalam John Eatwell, Murray Milgate, dan Peter Newman, editor, The New Palgrave: Finance, New York,MacMillan Press Limited, hal. 131.
Megginson, William. L. (1997), Corporate Finance Theory, Addison Wesley, New York.
Miller, Merton (1999), “The History of Finance”, Journal of Portfolio Management, 25 (4): 95-101.
Nazir, Moh. Ph.D. 2002. Metode Penelitian. Darussalam : Ghalia Indonesia.
Rusdin, Drs., MSi. 2008. Pasar Modal (Teori, Masalah dan Kebijakan dalam Praktik). Jatinangor : Alfabeta Bandung.
Samsul, Mohamad. 2006. Pasar Modal dan Manajemen Portofolio”. Surabaya : Erlangga. Sartono, R Agus, Manajemen Keuangan. Edisi Ketiga, Yogyakarta:BPFE.1997.
Supranto, J., Statistik: Teori dan Aplikasi. Jilid 2, Edisi Kelima, Jakarta: Penerbit Erlangga. 1998.
Universitas Lampung. 2007. Pedoman Penulisan Karya Ilmiah Universitas Lampung. Bandar Lampung : Penerbit Universitas Lampung.
Van Horne, James C and Jhon Wachawicz Jr, Fundamental of Financial Management, Tenth Edition, New Jersey: Prentice Hall Inc.1998.
Weston J.Fred and Thomas E. Copeland, Management Financial, Ninth Eedition, USA: The Dryden Press, 1992.
Wiyanto. 2002. http://digilib.petra.ac.id/viewer. Uji Efisiensi Pasar Bentuk Lemah pada Saham Industri Rokok di Bursa Efek Jakarta pada periode 1999-2001 ( Metode Peramalan Box-Jenkins dan Runs Test). Petra Cristian University Library. Jakarta
http://www.idx.co.id