International Conference on Applied Science and Health 2017
Improving health and well-being for better society
181
ICASH-A30
BODY WEIGHT EFFECT ON JOINT SPACE WIDTH AND TIBIO
FEMORAL ANGLE OF KNEE JOINT MEASUREMENT FOR
OSTEOARTHRITIS DETECTION USING IMAGEJ
Agung Nugroho Setiawan
1,*, Suryono
2, Sugiyanto
1, Fatimah
1, Gatot Murti Wibowo
1,
Faisal Amri
1, Donny Kristanto Mulyantoro
11Postgraduate Imaging Diagnostic Program, Semarang Health Polytechnic, Semarang, Indonesia
2Postgraduate Program of Diponegoro University, Semarang, Indonesia
*Corresponding author’s e-mail: [email protected]
ABSTRACT
Background: Radiograph of knee joint with Kellgren and Lawrence classification system is the gold
standard for assessing knee osteoarthritis. However, these grades are still obstacles. It is sometimes not appropriate to assess the progress of osteoarthritis and very long time to see the results of such progress. Osteoarthritis diagnosis and classification have been relying on qualitative visual interpretation by a radiologist. Probably difficult to determine whether there OA in the knee or not. Image quantification of digital radiography is done by measuring the joint space width and tibio femoral angle of the knee joint using the ImageJ software, with body weight variance as one factor that could affect it.
Aims: This research aims to get information of body weight effect on the measurement of the joint space width and tibio femoral angle of knee joint in OA detection.
Methods: This is a cross-sectional study. Subjects were digital images of the knee joint
anteroposterior (AP) projection using Computed Radiography (CR) from 21 respondents with specific criteria. Image is then quantified using ImageJ software to measure the joint space width and tibio femoral angle. Print out of examination visually evaluated by one radiologist to confirm the diagnosis of OA of the knee joint.
Results: The value of the right knee joint space width lateral and medial (3.81 ± 1.18 and 2.42 ± 0.77), while the left lateral and medial (3.49 ± 1.11 and 2.69 ± 0.83). Tibio femoral angle range 168.44 to 178.39 with the average tibiofemoral angle right knee 175.18 ± 2.04 and 173.80 ± 2.44 left knee. Body weight has a significant correlation to the tibiofemoral angle of knee joint (p value < 0,03).
Conclusion: The joint space width values that taken from digital quantificationcan be baseline data
of respondents, especially for those respondents who had grade 2 or indicated osteoarthritis, to be observed or compared in the next examination.The tibio femoral angle can be addition information in relation with knee pain to detect osteoarthritis.
Keywords: joint space width, tibiofemoral angle, quantification
INTRODUCTION
International Conference on Applied Science and Health 2017
Improving health and well-being for better society
182
joints that hold heavy weight, such as the hips and knees. Most cases of osteoarthritis have no known cause and are referred to as primary osteoarthritis. When the cause of osteoarthritis is known, the condition is referred to as secondary osteoarthritis. Osteoarthritis is sometimes abbreviated as OA.
Primary osteoarthritis mostly associated to aging. With aging, the water content of the cartilage increases, and protein composition of cartilage degenerate. Cartilage degeneration started by peeling or forming tiny crevasses. In the advanced cases, there is a total loss of the cartilage cushion between the bones of the joints. Repeated use of joints can irritate and inflame the cartilage, causing pain and swelling of joints. Loss of cartilage cushion causes friction between the bones, leading to pain and limitation of joint mobility. Inflammation of the cartilage can also stimulate new bone growths (spurs, also referred to as osteophytes) that form around the joints. Osteoarthritis occasionally can be found in many members of the same family, implying a base derived (genetic) for this condition [2-4].
Secondary osteoarthritis is caused by diseases or other conditions. Conditions that can lead to secondary osteoarthritis include obesity, repeated trauma or surgery to the joint structures, abnormal joints at birth (congenital abnormalities), gout, diabetes, and other hormone disorders [3,4].
Obesity causes osteoarthritis by increasing the mechanical stress on the cartilage. Obesity is the most powerful risk factor for osteoarthritis of the knees after aging factor. Early development of osteoarthritis of the knees among athletes’ weightlifter believed was partly due to their heavy weight. Repeated trauma in the tissues of the joints (ligaments, bones and cartilage) is believed to lead to early osteoarthritis of the knees on the football players [5,6].
Radiography is used as the gold standard in the evaluation of the diagnosis of OA, based on the Kellgren and Lawrence (KL) with a grading system based on two radiographic features, the presence or osteophytes and Joint Space Narrowing (JSN). Osteoarthritis diagnose in patient with KL grade same or more than 2, while 0 and 1 is normal. Grade 2 is visually definite margin of osteophytes, grade 3 is visible JSN, grade 4 = bone on bone contact [7].
Kellgren and Lawrence (KL) has limited the low sensitivity to changes in the joints, JSN evaluated with grading based on the ordinal scale [8], but also another feature like osteophytes, and bone density should be assessed separately . Altman atlas offers the use of a different grade to see the separate structures, using a scale of 0-3, but the grade is ordinal is also insensitive to changes in joint structure and is rarely used in clinical [9].
In addition, in evaluating radiographs highly dependent ability and experience, in addition to other factors such as lighting conditions are used, as well as illuminators used. Radiograph evaluation results could differ from one person to another. It required a tool that can measure and produce a radiograph evaluation more objective and more sensitive. The sensitivity of the radiographic examination in evaluating disease progression and treatment would be better if done in a more detailed and quantitative measurements [10,11].
International Conference on Applied Science and Health 2017
Improving health and well-being for better society
183
applied to 2-D and 3-D images. In addition to basic image processing (filtering, edge detection, resampling). ImageJ provides some higher level image analysis algorithms. ImageJ is written in Java. ImageJ can open many common 2-D image files, as well as DICOM format medical imaging data [12]. Aim of the study is to get information about the effect of body weight on the measurement joint space width and tibio femoral angle in help detecting osteoarthritis of the knee joint with the quantification of digital radiography images using ImageJ software.
METHODS
Design of this research is cross-sectional study. Subjects were digital images of knee joints antero-posterior (AP) projection using Computed Radiography (CR) from respondents with body weight variations. Digital image of the knee joint anteroposterior (AP) is then quantified using ImageJ software. Quantification done with measure joint space width (JSW) and tibio femoral angle (TFA) of the right and left knee joint.
The samples have inclusion criteria: a) Respondents aged 40-60 years; b) Respondents suspected has osteoarthritis signs or symptom when examined in Semarang Health Polytechnic
Clinic’s; c) Respondents agreed the examination and follow the research.
The samples have exclusion criteria: a) The respondent is suffering from rheumatism, gout or uric acid; b) The respondent is suffering from a knee ligament injury; c) The respondents are not willing to participate in research.
The independent variables in this study is a variation of the respondents’ body weight. The
dependent variable in this study are:
1) Joint space width (JSW) on digital radiographic image of the knee joint anteroposterior (AP) projection, measured with ImageJ.
International Conference on Applied Science and Health 2017
Improving health and well-being for better society
184
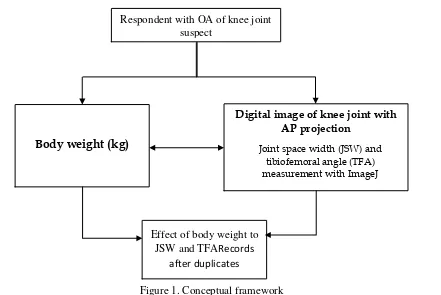
Figure 1. Conceptual framework
Body weight is ratio scale, measure with body weight scale, in kg unit. Joint space width is ratio scale, measure in digital images of knee joint with Antero-posterior projection that quantified using ImageJ, in mm unit. Tibio femoral angle is ratio scale, measure in digital images of knee joint with Antero-posterior projection that quantified using ImageJ, in degree unit.
The first step in this research is produce knee joint radiograph of respondents who met the criteria. Radiographs were made in radiography laboratory of Radio diagnostic and Radiotherapy Department Health Polytechnic of Semarang. Image captured with imaging plate and displayed in Computed Radiography. The list of image who meets the criteria, is transferred to a workstation for filming process.
The raw data image stored in DICOM format to the compact disc media to be processed using
ImageJ software that is already installed in the researcher’s laptop. As for the radiologist assessment, the image of the knee joint of the respondents printed in the film with one film format size 35x43 cm to 3 (three) image of the right and left knee joint.
Radiograph of the knee joint from each respondent is processed by software ImageJ to obtain the minimum value of joint space width. Before this, is needed to make scale calibration of the distance on the ImageJ display with the real distance, that known from step-wedge that include at collimation area when exposed with X-ray. The result is distance convert from pixel into mm (see figure 2).
Respondent with OA of knee joint suspect
Body weight (kg)
Digital image of knee joint with AP projection
Joint space width (JSW) and tibiofemoral angle (TFA) measurement with ImageJ
Effect of body weight to JSW and TFARecords
International Conference on Applied Science and Health 2017
Improving health and well-being for better society
185
Figure 2. Scale calibration
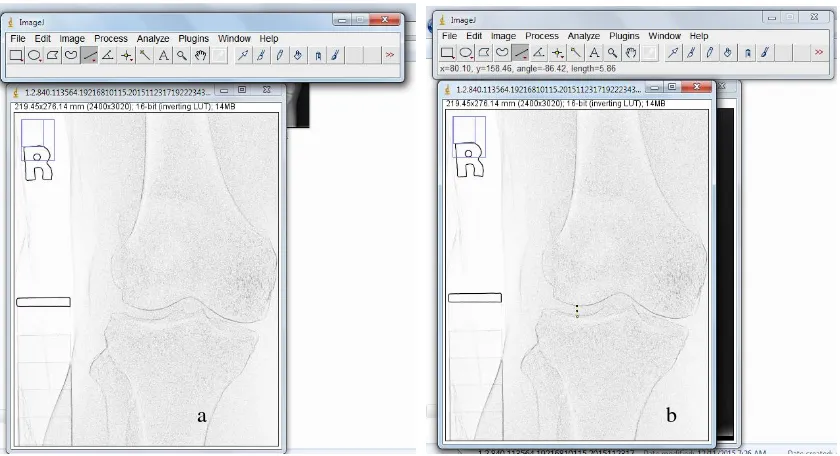
Method to obtain joint space width, as displayed in figure 3, and tibio femoral angle measurement as displayed in figure 4.
Figure 3. Measuring joint space width (a) Perform “find edge”. (b) Measure of joint space width (right knee, lateral side)
International Conference on Applied Science and Health 2017
Improving health and well-being for better society
186
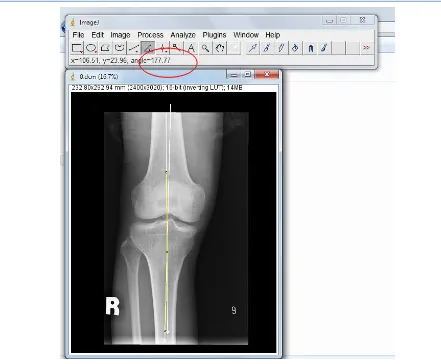
Figure 4. Tibio femoral angle measurement
Radiograph of the knee joint each respondent is processed by software ImageJ to obtain tibio femoral angle value. Tibio femoral angle is measured by pulling axis of the middle of the femoral bone and the middle of tibia bone on the image, which forms an obtuse angle (see figure 4).
Quantification of JSW and TFA can’t perform with conventional x-ray films. Using digital images from Computed radiography, we can measure the size and angle. Data analyzed with linear regression test, between body weight and JSW, and between body weight with TFA measurement. The next step, qualitative confirmation with KL grade that classified visually by radiologist.
RESULTS
Has been done radiographic examination to right and left knee joint with weight bearing anteroposterior projection of 21 (twenty-one) respondents.
Table 2. Result of JSW and TFA measurement
No. Data JSW (mm) TFA (o)
R L R L
Lat Med Med Lat
International Conference on Applied Science and Health 2017
Improving health and well-being for better society
187
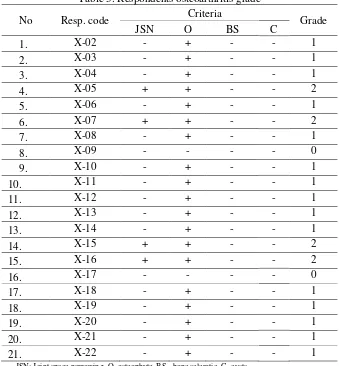
One radiologist as observer had judged the image of the knee joints of 21 (twenty-one) of respondents Grading classification of osteoarthritis based on Kellgren and Lawrence grade as follows:
Table 3. Respondents osteoarthritis grade
JSN: Joint space narrowing, O=osteophyte, BS= bone sclerotic, C=cysts
Body weight of respondents is 64.71±6.23. The value of joint space width lateral and medial of right knee (3.81 ± 1.18 and 2.42 ± 0.77). The value of joint space width lateral and medial of left knee (3.49 ± 1.11 and 2.69 ± 0.83). The size of the joint space width of on the medial side is smaller than lateral, since the medial side closer to the body axis and receive a heavier load than the lateral side.
Table 4. Pearson correlation between body weight and JSW
International Conference on Applied Science and Health 2017
Improving health and well-being for better society
188
Pearson correlation between weight and the joint space width of the knee joint (Table 4) it is seen to have a weak correlation and insignificant. The results possible because the sample size is not adequate to give significant information. And, samples were taken mostly still a category 0 and 1 on a scale of Kellgren and Lawrence (normal category or not OA). There are only four people who entered grade 2 or indicated OA, so the size of the joint space width still vary within normal values.
Narrowing of joint space can be an indicator showing abnormalities progress of OA. Those narrowing is the result of observation for at least 1 year in patients suspected of OA [13]. Data obtained in this research can be a baseline measurement joint space width of the respondents stated grade 2 for the further measurement of the joint space.
Joint space width is successfully quantified with ImageJ, could be a valuable tool in determining the scale of OA, as the classification Ahlback, where the size of the joint slit width of less than 3mm can be grouped in Grade I OA [14]. However, still need to look at other markers of OA in people suspected OA, by looking at other indicators such as pain, subchondral bone thickening and formation of marginal osteophytes, as well as changes in molecular composition and structure of the bone.
The joint space width resulted in this study could be a baseline data of respondents, especially for those respondents who had grade 2 or indicated OA, to be observed or compared in the subsequent examination.
The results of this research is tibio femoral angle range of 168.44 to 178.39 with the average tibio femoral angle of right knee 175.18 ± 2.04 and 173.80 ± 2.44 on left knee. Body weight has a significant correlation to the angle of the tibio femoral knee joint. The magnitude of the correlation of weight towards the corner tibio femoral joint right knee and left at 0.471 and 0.465. This means that the weight has enough correlation to the tibio femoral angle. Beside of the body weight factor, value of tibio femoral angle is also influenced by age, ethnicity and gender [15].
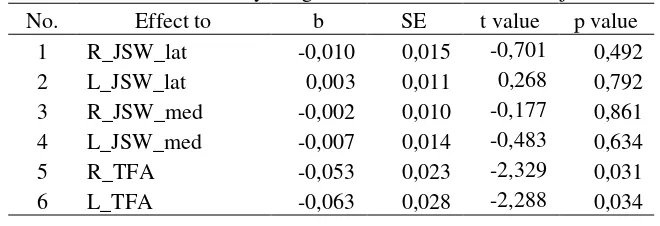
Table 5. Correlation between body weight and tibio femoral angle of knee joint No Correlation r value p value
1 R_TFA 0,471 0,031 2 L_TFA 0,465 0,034
International Conference on Applied Science and Health 2017
Improving health and well-being for better society
189
Table 6. Effect of body weight to JSW and TFA of knee joint No. Effect to b SE t value p value considerable significance, and the regression coefficient is negative. This means that the increase in weight will lower tibio femoral angle. To our knowledge, there has been no normal range tibio femoral angle on the Indonesian people. Normal size tibio femoral angle in Japanese people according to Toda at 175º-180º. Tibio femoral angle <175º cause tibio femoral varus and angle> 180º cause valgus [15]. Research obtain mean tibiofemoral angle of left knee is 173.80 ± 2.44, which means outside the normal range according to Toda, but not necessarily the value of the tibiofemoral angle indicates OA. However, tibiofemoral angle has a significant positive correlation to the knee pain, as described by Tulaar [15].
Utilization of X-rays of the knee joint is only one criterion for OA, also need a physical examination, laboratory and patient history9. However, X-rays of the knee joint can be the initial modality for the detection of OA, due to the quick, easy and inexpensive relative. Plus, in order to minimize bias between the radiologist assess a radiograph of the knee joint, the quantification is done by the ImageJ software could be one solution to get the joint space and tibio femoral angle measurement results more objectively.
CONCLUSION
This works noted that there were no influence and significant correlation between the body weight and the joint space width of the knee joint in osteoarthritis suspected person. The joint space width values that taken from digital quantification can be baseline data of respondents, especially for those respondents who had grade 2 or indicated osteoarthritis, to be observed or compared in the next examination. However, we found a significant relationship between the body weight and the tibia femoral angle of the knee joint in osteoarthritis suspected person. The finding is carrying an expectation that the tibio femoral angle can be addition information in relation with knee pain to help detect osteoarthritis.The ImageJ software could be used in the radiology service center for the quantification of joint space width and the tibiofemoral angle of knee joint, so that the diagnosis of osteoarthristis would be more objective. Research can be developed to utilize ImageJ software for the early detection of OA based on tibio femoral angle criteria and knee pain.
REFERENCES
[1] Sarzi-Puttini P, Cimmino MA, Scarpa R, Caporali R, Parazzini F, Zaninelli A, et al. Osteoarthritis: An Overview of the Disease and Its Treatment Strategies. Semin Arthritis Rheum. 2005;35:1–10.
[2] Soeroso J, Isbagio H, Kalim H, Broto R PR. Buku ajar ilmu penyakit dalam. 4th ed. Jakarta: Pusat Penerbitan Ilmu Penyakit Dalam Fakultas Kedokteran Universitas Indonesia; 2006.
[3] Firestein Gary S, Ralph C.Budd, Edward D. Harris, Iain B.McInnes, Shaun Ruddy JSS. Kelley’s textbook of rheumatology. 8th ed.
International Conference on Applied Science and Health 2017
Improving health and well-being for better society
190
[4] Moskowitz, Roland W., David S. Howell, Roy D. Altman, Joseph A. Buckwalter VMG. Osteoarthritis 3rd edition diagnosis and medical / surgical management. Philadelphia: W.B. Saunders Company; 2001.
[5] Maharani, Eka Pratiwi. Faktor-faktor risiko osteoartritis lutut. Semarang: Universitas Diponegoro Semarang; 2007.
[6] Fauci, Anthony S., Dennis L. Kasper, Dan L. Longo, Eugene Braunwald, Stephen L. Hauser JLJ et al. Harrison’s principles of general
medicine. 17th ed. Columbus, OH 43218: McGraw-Hill Education; 2008.
[7] Kellgren JH, Lawrence JS. Radiological assessment of osteo-arhtritis. Ann Rheum Dis. 1957;16:494–503.
[8] Kinds MB, Vincken KL, Hoppinga TN, Bleys RLAW, Viergever MA, Marijnissen ACA, et al. Influence of variation in semiflexed knee positioning during image acquisition on separate quantitative radiographic parameters of osteoarthritis, measured by Knee Images Digital Analysis. Osteoarthr Cartil. 2012;20:997–1003.
[9] Altman RD, Gold GE. Atlas of individual radiographic features in osteoarthritis, revised. Osteoarthr Cartil. 2007;15:A1–56.
[10] Buckland-Wright C. Protocols for precise radio-anatomical positioning of the tibiofemoral and patellofemoral compartments of the knee. Osteoarthr Cartil.1995;3 Suppl A:71–80.
[11] Braun HJ, Gold GE. Diagnosis of osteoarthritis: Imaging. Bone. 2012;51:278–88.
[12] IAEA. Diagnostic Radiology Physics: A Handbook for Teachers and Students. Vienna: IAEA; 2014.
[13] Vignon E, Piperno M, Le Graverand M-PH, Mazzuca SA, Brandt KD, Mathieu P, et al. Measurement of radiographic joint space width in the tibiofemoral compartment of the osteoarthritic knee: Comparison of standing anteroposterior and Lyon Schuss views. Arthritis Rheum. 2003;48:378–84.
[14] Boegård TL, Rudling O, Petersson IF, Jonsson K. Joint space width of the tibiofemoral and of the patellofemoral joint in chronic knee pain with or without radiographic osteoarthritis: a 2-year follow-up. Osteoarthr Cartil. 2003;11:370–6.