©2013 Pusat Penelitian Geoteknologi Lembaga Ilmu Pengetahuan Indonesia
99
VARIATIONS OF PORE-WATER PRESSURE RESPONSES IN
A VOLCANIC SOIL SLOPE TO RAINFALL INFILTRATION
Variasi Respon Tekanan Air Pori Terhadap Infiltrasi Air Hujan
Pada Lereng Tanah Vulkanik
Adrin Tohari
ABSTRACT A field monitoring of hydrological response and slope movement in an active landslide area, comprising of volcanic soil, was conducted to have a better understanding of the mechanism of landslide reactivation during a rainfall period. Monitoring instruments consisted of jet-fill tensiometers, inclinometers, open stand-pipe piezometers, and a tipping-bucket rain-gauge. This paper presents the monitoring results from tensiometers and piezometers to reveal the characteristic of hydrological responses of the soil slope to rainfall infiltration and to assess the factors controlling the hydrological response of the slope. The records of pore-water pressure show that the hydrological responses exhibited some spatial variability, and were mainly influenced by antecedent soil moisture conditions and rainfall patterns. The ingress of wetting front was confined up to the depths of 3 m, and a transient positive pore pressure could develop at a depth of 1 m during a heavy rainfall. More sustained increase in pore-water pressure could develop at deeper soil. Meanwhile, the piezometer records show that the response of groundwater table occur more significantly in the middle and lower portions of the slope, associated with the subsurface topographical features. The analysis of antecedent moisture conditions based on the pore-water pressure measurement data indicates that simplified model of slope hydrology cannot fully explain the spatial and temporal
development of the pore-water pressures observed in the soil slope.
Keywords: field instrumentation, pore-water pressure, rainfall infiltration, tensiometer, volcanic soil slope
ABSTRAK Pemantauan respon hidrologi dan pergerakan lereng dilakukan pada daerah gerakan tanah aktif, yang tersusun oleh tanah vulkanik, untuk mendapatkan pemahaman yang lebih baik mengenai mekanism reaktifasi
gerakan tanah selama periode hujan.
Instrumentasi pemantauan terdiri dari jet-fill
tensiometer, inklinometer, stand-pipe piezometer,
dan alat takar hujan tipe tipping bucket.
Makalah ini menyajikan hasil dari pemantauan tensiometer dan piezometer untuk mengetahui karakteristik dari respon hidrologi lereng tanah terhadap infiltrasi curah hujan dan mengkaji faktor-faktor pengontrol respon hidrologi lereng tanah tersebut. Hasil pemantauan tekanan air-pori menunjukkan bahwa respon hidrologi lereng tanah vulkanik memperlihatkan beberapa variasi spasial, dan dipengaruhi oleh kondisi hidrologi awal lapisan tanah dan pola-pola curah hujan. Infiltrasi air hujan dibatasi hingga kedalaman 3 meter, dan tekanan air-pori sesaat dapat terbentuk pada kedalaman 1 meter selama hujan lebat. Kenaikan tekanan air-pori tanah yang lebih berkelanjutkan dapat terbentuk di lapisan tanah yang lebih dalam. Sementara itu, data pengukuran pisometer menunjukkan bahwa respon muka airtanah sangat signifikan pada daerah tengah dari lereng, yang terasosiasi dengan bentukan-bentukan topografi bawah
permukaan. Analisa kondisi moisture awal
berdasarkan data pengukuran tekanan air-pori menunjukkan bahwa model tradisional dari
hidrologi lereng tidak sepenuhnya dapat
menjelaskan pembentukan tekanan air-pori yang
________________________________
Naskah masuk : 21 Januari 2013
Naskah selesai revisi : 13 November 2013
Naskah siap cetak : 18 November 2013
____________________________________
Adrin Tohari
100
spasial dan temporal di dalam lereng tanah vulkanik.
Kata kunci: infiltrasi air hujan, instrumentasi lapangan, lereng tanah vulkanik, tekanan air-pori, tensiometer.
INTRODUCTION
Rainfall-induced slope movements are not uncommon geotechnical problem in tropical areas, like Indonesia. It is quite often for gentle slope to experience failure during or soon after several heavy rainstorms. The slope movement may involve rapid movement or reactivation of slow-moving landslides. The landslide has resulted in US$ 1-2 millions in damages and more than 20 fatalities on average every year. Despite excellent efforts have been made to mitigate such hazard, many issues are still not fully understood.
The role of rainfall in controlling the stability of soil slopes is complex. Our current understanding of the the effects of rainfall infiltration on slope stability has been generally gained from field measurements. Most of these studies involved the monitoring of negative pore-water pressures (matric suction) in the soil slope using jet-fill tensiometers (Johnson and Sitar, 1990; Anderson and Thallapally, 1996; Rahardjo, 1999; Zhang et
al., 2000; Lie et al., 2005). The tensiometers are
usually used to measure soil suctions up to 100 kPa (Stannard, 1992). With this limitation, measurements of the matric suction with tensiometers in soils are usually within the shallow depth of 0.3–4 m below the ground surface (Anderson, 1983; Krahn et al., 1989; Lim
et al., 1996; Zhang et al., 2000; Gasmo et al.,
2000; Lie et al., 2005). The results of these field measurements generally showed the partial or complete dissapearance of matric suction at shallow depths associated with infiltration of rainwater during heavy rainfall. Subsequently, a perched water table or transient positive pore-water pressure would develop in the shallow soil. It is typically observed that significant build up in positive pressure heads is generated in an area low on the slope (Johnson and Sitar, 1990; Sitar and Anderson, 1992; Anderson and Thallapally, 1996). The presence of a positive pore-water pressure would further decrease the soil shear strength and eventually trigger a rainfall-induced
landslide. However, the mechanism of pore-water pressure generation is site-specific; it differs from site to site depending on the site hydrology, rainfall pattern, topograhy and soil properties (Johnson and Sitar, 1990; Sitar and Anderson, 1992; Lie et al., 2005). Thus, it is clearly appropriate to have a knowledge of specific hydrological response of a soil slope to rainfall to develop a better understanding of the mechanism controlling the initiation of landslides.
To quantitatively investigate the mechanism of landslide reactivation in a volcanic soil slope during a rainfall period, a field monitoring program of hydrological response and slope movement was conducted in a cut-slope, comprising of weathered volcanic soil in an active landslide site in West Java, Indonesia. Monitoring instruments consisted of jet-fill tensiometers, inclinometers, open stand-pipes, and a tipping-bucket rain-gage. This paper presents the results of a long-term monitoring of hydrological responses in the active landslide area. Specific objectives of the study were to (i) identify the typical characteristics of pore-water pressure responses, both negative (suction) and positive of the soil slope, (ii) evaluate the significance of antecedent moisture content in hydrological response of the soil slope, and (iii) assess factors controlling the hydrological response of the slope.
DESCRIPTION OF INSTRUMENTATION SITE
101 were still developed on the slope surface,
indicating that the landslide was still active (Figure 2).
METHODOLOGY
Site Characterization
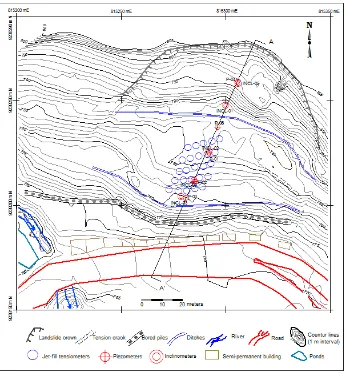
A geotechnical drilling program was conducted at 10 locations up to the maximum depths of 22 m to obtain the soil stratification and soil samples. The locations of the drilling holes are shown in Figure 3. Two boreholes were located below the landslide crown (P-04 and INCL-05). Four boreholes were drilled in the middle part of the slope (INCL-01, INCL-05, P-01 and P-05).
Two boreholes were located at the berm in lower part of the slope (INCL-04 and P-02). The last two boreholes were drilling at the lower berm (INCL-03 and P-03).
The drilling data revealed that the slope is mainly composed of three layers of soils originated from volcanic tuff and breccia, and bedrock of volcanic breccia, as shown in Figure 4. The description of soil layers and the bedrock is as follows:
(1) Reddish brown medium clayey silt of 3.0 – 4.0 m thick, which represents the complete form of fully weathered tuff (weathering grade V-VI).
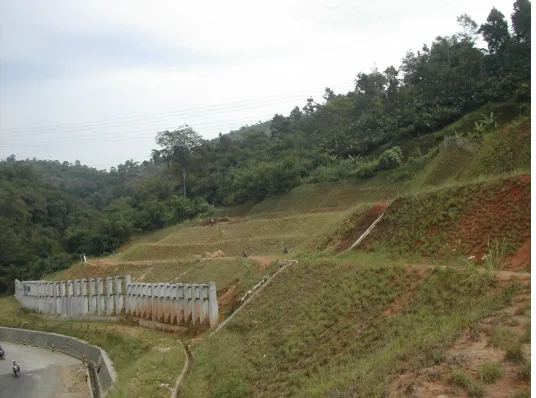
Figure 1. Field monitoring site located in an active landslide site above the Cadas Pangeran provincial road in Sumedang District, West Java, Indonesia.
102
(2) Brown loose fine silty sand layer of 2.0 – 6.5 m thick, which is characterised as the moderate to high weathering of volcanic breccias (weathering grade IV-V).
(3) Yellowish brown dense fine silty sand layer containing andesitic gravels, derived from highly weathered volcanic breccias (grade III-IV) with varying thickness of 4.0 – 10.0 m.
(4) Bedrock, which is made up of fresh to weakly weathered Grey volcanic breccias, (grade I-II).
Referring to Figure 4, the thickness of dense gravelly silty sand layer is not uniform throughout the profile. It is evident that the thickness of the sand layer in piezometers P-03
and P-04 are thinner than other profiles. This is due to the depression of volcanic breccia layer underneath the sand layer. Such a topographical convergence would control the rate of increase in groundwater within the dense sand layer.
Laboratory Characterization of Soil Properties
Soil samples of each soil layer obtained from boreholes P-01 and P-04 were subjected to a series of laboratory test program to determine the soil physical and hydraulic properties, including the determination of soil-water characteristic curves. Results of the laboratory test, shown in Table 1, the gravelly silty sand layer has lower porosity and saturated hydraulic conductivity, implying that the gravelly silty sand layer is more dense and less permeable than other soil layers. Figure 3. Topographical map of the research landslide area, showing the
103 Figure 4 Topographical profile, tensiometer nest locations, and geological cross-section A-A’.
Table 1 Index and hydraulic properties of each soil layer.
Soil Properties Clayey Silt Silty sand Gravelly silty sand
Gravel content (≤ 62 mm, %) - - 2.3 – 4.4
Sand content (≤ 2 mm, %) 8.4 – 14.5 65.5 – 62.5 84.3 – 89.6
Silt content (≤ 63 µm, %) 60.5 – 65.5 30.5 – 35.2 5.4 – 8.7
Clay content (≤ 2 µm, %) 20.4 – 25.6 1.5 – 3.9 1.1 – 4.3
Plastic limit (%) 50 - 60 50 - 60 20 - 40
Liquid limit (%) 110 - 120 70 - 80 40 - 60
Unit weight (kN/m3) 16.5 17.6 18.5
Porosity 0.58 – 0.61 0.65 – 0.69 0.48 – 0.51
Saturated hydraulic conductivity (m/s) 2.6 x 10⁻⁶ 1.4 x 10⁻⁶ 5.1 x 10⁻⁷
104
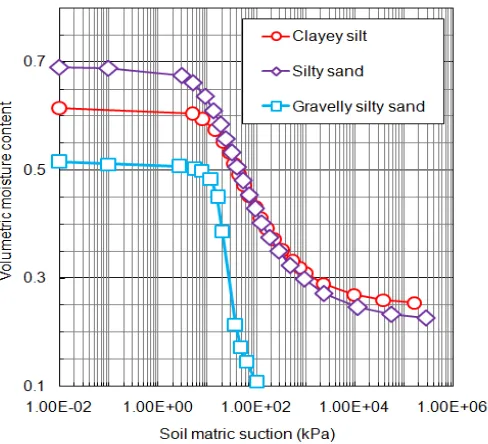
A previous study by Tohari et al (2006) have produced the soil-water characteristic curves for each soil layer, determined in the laboratory using 200 kPa pressure plate extractor for the drying path, as shown Figure 5. According to this figure, the saturated volumetric moisture contents values are 0.61, 0.69 and 0.52 for clayey silt, silty sand and gravelly silty sand layers, respectively. However, the air-entry value, which is defined as the matric suction at which the soil begins to desaturate, is approximately equal to a soil suction of 10 kPa. However, the silty sand is more easily to desaturate due to its higher porosity compared to other soil types.
Field Instrumentation
A detailed instrumentation scheme was implemented to obtain information relating to the variation of pore-water pressure with time and precipitation. Instrumentation consisted of jet-filled tensiometers to measure the pore-water pressure in the soil, open standpipes, a rain-gauge, and an automatic data acquisition system.
1. Pore-water pressure measurement
Because of their ability to measure pore-water pressure under both saturated and unsaturated
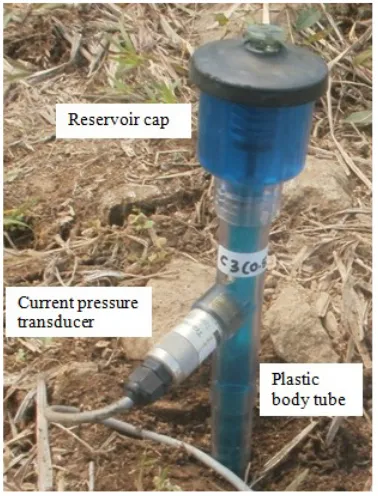
conditions, jet-fill tensiometers1 equipped with electronic pressure transducer were used (Figure 6). Prior to installation, each tensiometer was filled with distilled and deaired water mixed with sulphate solution to minimize the development of fungus and algae inside the tensiometer, and the porous ceramic tip was saturated.
Tensiometer installation procedures were developed to ensure thorough contact between ceramic tip and the surrounding soil and to prevent the potential for leakage down the tensiometer shaft. A hole was created for each tensiometer using an insertion tool consisting of a hollow metal tube having essentially the same diameter as the tensiometers. The insertion tool was driven into the ground to a depth about 2 cm less than the desired depth for the tensiometer. Then, the tensiometer was inserted in the hole and, upon reaching the bottom, tapped lightly to seat the tip in the surrounding soil. To prevent water seepage down the tensiometer shaft from the soil surface, a bentonite seal was placed to a depth of approximately 10 cm below the soil surface. Once installation was completed, a protective cover was placed over the exposed top cap and pressure transducer at the ground surface.
The tensiometer required careful maintenance after installation. A slow accumulation of air bubbles can occur at the top of the tensiometer tube due to the loss of moisture in the ceramic tip during the insertion when the soil is unsaturated. This can introduce errors to pressure measurements. Thus, the tensiometers were maintained and flushed with deaired water in the jet-fill cup, every 7-14 days depending on the soil saturation.
Precipitation measurement
A tipping bucket rainfall gauge2 housed with an aluminum cylinder was used to monitor precipitation on the site. The rainfall gauge stood up approximately 100 cm above the ground surface. The rainfall gauge was calibrated to measure rainfall in increment of 0.2 mm. The rainfall intensity was calculated from the water
1
Model 2725, maufactured by Soilmoisture Equipment Corporation, Santa Barbara, California, USA
2
RG2 Model, Onset Computer Corporation, Inc., Pocasset, Massachusetts, USA
105 volume of the tipping bucket corresponding to
each tip. Care was taken to place the rain gauge so that obstruction would not influence precipitation measurements. At no time during the monitoring program did the vegetation surrounding the rain gauge exceed about half height of the gauge.
Data acqusition system pressure transducers and rain gauge connected to it, and were configured to automatically collect data at a 10-minutes interval. The data were downloaded biweekly using the program
“hyperterminal” to a personal computer.
A dipmeter was used for the groundwater levels in the open standpipe. A stream of puckets was used to record the groundwater level in the open standpipes between the periodic manual measurements. A portable digital inclinometer probe5 was used to measure the horizontal displacements in the five inclinometers.
Arrangement of the Instrumentation
Taking into account for the field geotechnical evidence, which indicated probable reactivation of landslide within the loose silty sand layer, instrumentation was installed at the middle and lower portions of the cut-slope which is made up of loose silty sand. A total of twenty five tensiometers were installed at five closely-spaced nests (A to E) within 5.0 m radius (Figure 3). Each nest consisted of a group of 5 tensiometers, installed at depths of 0.5, 1.0, 1.5, 2.0 and 3.0 m. The objective was to obtain the spatial variations of pore-water pressure with depth and to compare the response across a relatively short distance.
Nests A and B tensiometers were installed at the berm of the middle portion of the cut-slope.
3
SL5 Model, ICT International, Armidale, North South Wales, Australia
4
IB14 Model, ICT International, Armidale, North South Wales, Australia
5
Digital MEMS Inclinometer System, RST Instruments Ltd, Coquitlam, Canada
Meanwhile, nest D tensiometers were installed in the lower berm. Nests C and E tensiometers were installed at the middle and lower slope, respectively (Figure 4).
Five open standpipes and inclinometers (see Figure 3) were installed up to a maximum depth of 20 m, along section A-A’, to monitor the fluctuation of groundwater level within the slope and horizontal deformation of the slope. Groundwater levels in the open standpipes and horizontal deformation in the two inclinometers were manually measured on a periodic basis.
RESULTS OF FIELD MONITORING
Field measurement results are presented for the months of October 2008 to July 2009. Rainfall characteristics, changes of pore-water pressure, and the variation of groundwater table, in response to rainfall, are evaluated.
Rainfall Characteristics
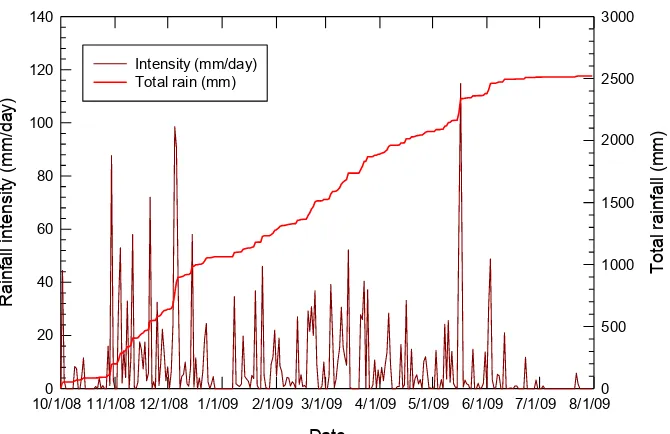
The complete daily precipitation record collected during October 1st, 2008 to July 31st, 2009 is given in Figure 7. Light to heavy rainfalls fell within the wet month period, resulting a total precipitation of 2519.2 mm, slightly higher than the average annual rainfall for the last 10 years. The record contains some significant rainfall events with variable intensities and durations. In this current research, a heavy rainfall is considered significant if the daily intensity was higher than 50 mm/day, and could induce a sustained rise of pore-water pressure in the soil slope.
106
with a maximum daily rainfall of 98.5 mm occurred on 4 December 2008.
Rainfall events from January to March 2009 were generally characterized by light to mild precipitations. A total precipitation of 819.2 mm fell at the site during this rainfall period. The January rainfall contained some pulses of light to mild precipitations before a heavy precipitation of 46 mm fell at the end of this month. A long period of light precipitations for 18 days characterized the February rainfall period, followed by a sustained mild precipitation of 30 mm for 5 days. The March rainfall record shows two pulses of mild precipitation, which typically lasted for one to two weeks. The first pulse occurred between 3 and 16 March, dropped a total of 189.6 mm of rain. This rainfall pulse consisted of a single burst of rainfall of 44 mm for 3 days, followed by a sustained precipitation of 145.6 mm for 13 days with a maximum intensity of 52.2 mm/day on 14 March. The second rainfall pulse dropped a total of 131.8 mm of rain in 5 days between 21 and 26 March.
A series of light precipitations with short duration characterized the rainfall events from April to June 2009 rainfall period, with a single burst of heavy precipitation occurred on 16 May and 4 June. The April rainfall record shows four light rainfall pulses; each lasted for less than 7 days. A total of 190.8 mm of rain fell in this area
during this month. The May rainfall event was characterized by a sustained light precipitation for 15 days, followed by a two-day heavy rainfall, dropped a total of 174.6 mm of rain from 17 to 18 May. A very light precipitation marked the end of the May precipitation period. The June rainfall event dropped a total of 146.8 mm of rain at the site. It commenced with a light to mild precipitation for 10 days, with a maximum intensity of 48.8 mm/day on 4 June. Two pulses of light rainfall with decreasing intensity marked the end of wet rainfall period.
Pore-water pressure responses
The pore-water pressure responses observed in nests A, C, and E to rainfall events from October 2008 to July 2009 are presented in Figure 8 to 10. The records indicate some similarities in characteristics of pore-water pressure variations. Prior to a wet rainfall period, the dry antecedent matric suctions (negative pore-water pressure) in all nests range between 35 and 75 kPa, with the highest initial values occurring in the shallower instruments at most of the nests. This implies that the deeper part of the soil profile appears to have wetter antecedent moisture condition than the shallower soil. Given these antecedent conditions, the advance of wetting front can be clearly seen. In response to the change of hydrological condition due to the start of rainfall period at the end of October 2008, the shallower
Date
10/1/08 11/1/08 12/1/08 1/1/09 2/1/09 3/1/09 4/1/09 5/1/09 6/1/09 7/1/09 8/1/09
Ra
inf
all
int
ens
it
y
(mm/
day)
0 20 40 60 80 100 120 140
Total
rainfal
l
(mm)
0 500 1000 1500 2000 2500 3000
Intensity (mm/day) Total rain (mm)
107 tensiometers in all nests obviously responded
before those deeper within the soil column, with time delay indicating the rate of wetting-front advance. Rainfall with an intensity of 80 mm/day was required to produce this hydrological response. Another distinct similarity is that all instruments recorded the increase in suction values to approximately 10 to 20 kPa under a long period of no rain condition at the beginning
of January 2009. In response to the dissapearance of rainfall infiltration in June 2009, the matric suction increased to values of approximately 20 to 70 kPa. The rate at which deeper instruments responded is obviously less rapid than the shallower instruments. These observations suggest that changes in matric suction due to periodic of wetting and drying are very significant in the near ground surface.
Nest A
10/1/08 11/1/08 12/1/08 1/1/09 2/1/09 3/1/09 4/1/09 5/1/09 6/1/09 7/1/09 8/1/09
Da
Figure 8. Variations of pore-water pressure response in nest A and daily rainfall from 1st October 2008 to 31st July 2009. Dates are given as month-day-year.
Nest C
108
Although the response of instruments in all nests show some similarities, however, several notable distinctions are evident. The lowest initial pore-water pressure was observed in the intermediate instrument. During the rainfall period in March 2009, some transient positive pore-water pressures were recorded by the shallow instruments in nest A (Figure 8). Comparing the responses of two shallower instruments in nest A, the magnitudes of positive pressure head recorded in the instrument A2, installed at 1.0 m depth, was higher than that observed in instrument A1. These data suggest in addition to vertical infiltration, a lateral source of moisture contributed to the hydrological response of the soil in instrument A2. Another characteristic of the hydrological response in this nest is that the deepest instrument (tensiometer A5) recorded higher pore-water pressures than intermediate instruments (tensiometers A3 and A4), associated with the the wettest antecedent moisture condition of the deepest soil.
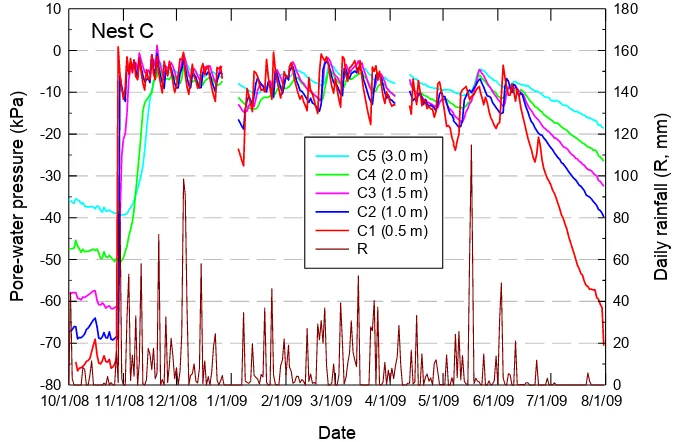
The pore-pressure response recorded in nest C is presented in Figure 9. This response shows the A, the shallow instruments in nest C (C1 and C2) recorded no development of positive pore pressures. It is evident that the rate at which the instruments responded is transient development of pore-pressures measured by all instruments. In
comparison with nest more rapidly than those in nest A. However, the response of the instruments appeared to be less sustained than those in nest A. These data suggest that the infiltration occurs more rapidly in nest C than in nest A. Hence, the shallow soil in nest C is more permeable than the soil in nest A. While all shallow and intermediate instruments recorded a transient pore water response, the deepest instrument (C5) recorded much sustained response. This type of response suggests the contribution of additional source of moisture in the deepest soil.
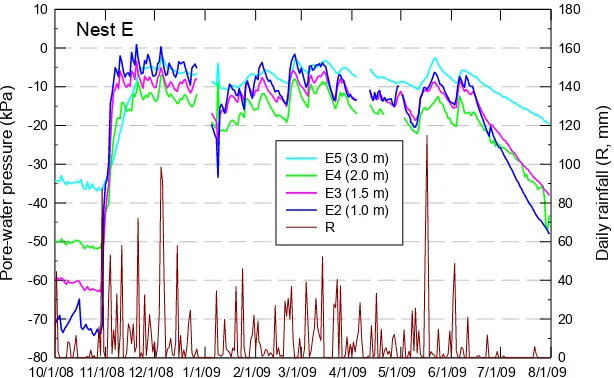
Figure 10 shows the record of pore pressure response of all instruments in nest E. It is clear that the shallow instruments in nest E recorded less substantial development of positive pore-pressure than in nest A, due in part to the lower antecedent pore-pressure of the shallow soil in nest E. Another distinct difference is that the deepest instruments in nest E recorded the higher and more sustained pore-pressure response than in nests A and C during a long period of light to
mild rainfall from March to June 2009. In addition to the wettest antecedent moisture condition, some additional sources of moisture within the deeper part of the soil profile are responsible for this type of hydrological response of the deeper soil in this nest.
109 Groundwater Table Response
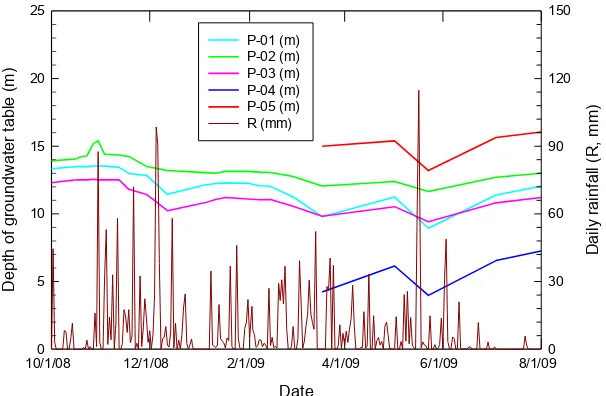
Figure 11 shows the fluctuations of groundwater table recorded in all standpipe piezometers. Referring to Figure 4, the groundwater table is located within the dense gravelly silty sand layer. Although the responses of groundwater table to rainfall in all standpipe piezometers show a similar characteristic, there are some distinct differences of the responses to rainfall infiltration. The increase in groundwater table recorded by piezometers P-01 P-03 and P-04 are higher than that recorded by piezometers P-02 and P-05. The groundwater table in P-01, P-03 and P-04 increased about 3.5 – 4.5 meters during the monitored rainfall period. Meanwhile, the records of piezometers P-02 and P-05 show the increase in groundwater table about 2.5 m. This groundwater response is probably associated with the thinning of soil profile in piezometers P-03 and P-04.
DISCUSSIONS
Rainfall Infiltration Analysis
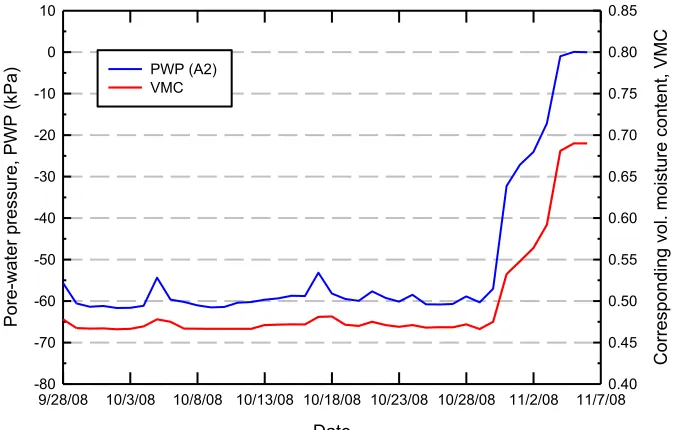
Understanding of rainfall infiltration process is best demonstrated by relating pore-water pressure values to their corresponding volumetric moisture content to obtain the amount of water in the soil due to rainfall infiltration. The following discussion illustrates how tensiometer
measurements enable a quantitative estimation of cummulative infiltration, using a simple analytical method proposed by Lie et al (2005) and the soil water characteristic curves. For example, the tensiometer data A2 (depth of 1 m) for period of 28th September to 11th November 2008 events can be related to the corresponding volumetric moisture content obtained from the characteristic curves in Figure 5. On the basis of the volumetric moisture content profile in Figure 12, the amount of water in the soil due to rainfall infiltration is then calculated for 1-m thick soil profile, under an assumption that the top 1 m of soil has the same volumetric moisture content as that measured at a depth of 1 m.
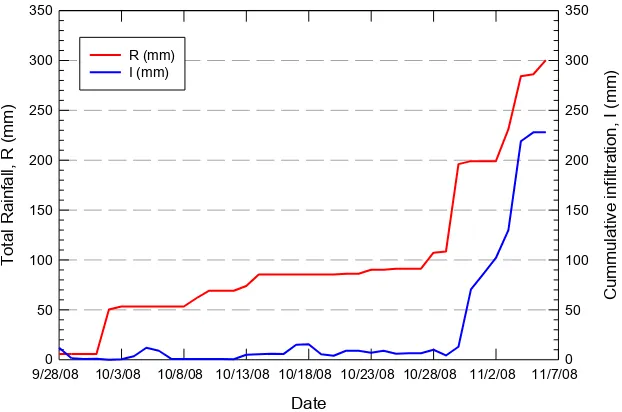
Figure 13 shows the variation of the calculated cummulative infiltration and the monitored total rainfall for period of September 28 to November 11, 2008. It should be clear that the cummulative infiltration increases proportionally with the
increase in recorded total rainfall. However, based on the calculation, the amount of water required to saturate the 1-m thick soil is corresponding to a total rainfall of 228 mm, or about 80% of the recorded total rainfall under the antecedent pore-water pressure of about -60 kPa. Furthermore, Figure 13 also illustrates that, when the antecedent moisture conditions of the soil become higher, less amount of rainfall is required to saturate the soil.
Date
10/1/08 12/1/08 2/1/09 4/1/09 6/1/09 8/1/09
De
pth
of
gr
oundw
ater t
able (m)
0 5 10 15 20 25
Da
ily
rainfal
l
(R, m
m)
0 30 60 90 120 150
P-01 (m) P-02 (m) P-03 (m) P-04 (m) P-05 (m) R (mm)
110
Significance of Antecedent Soil Moisture
The following discussion illustrates how tensiometer measurements enable a quantitative assessment of the significance of antecedent soil moisture condition in hydrological response of the slope. For this purpose, the soil water characteristic curves (Figure 5) are used to correlate the initial pore-water pressure values with the corresponding volumetric moisture content values in order to calculate the volume of water required to saturate the soil. For example, considering a typical section of the silty sand soil column at the depth of 3 m in all nest, the dry antecedent soil conditions for October 2008 and the wet antecedent condition of the for January 2009 events can be represented by average matric suction values of 45 kPa and 11.5 kPa, respectively. According to the characteristic curves for the silty sand (Figure 5), the corresponding volumetric moisture content is approximately 50 and 63% for the 45 and 11.5 kPa antecedent matric suction values, respectively. Thus, the amount of water required
to saturate the 3-m thick soil column corresponds to 570 mm of rainfall for the 45 kPa initial matric suction and 195 mm for the 11.4 kPa initial matric suction (see also Table 2). These estimates
were calculated under the following common assumptions (see also Johnson and Sitar, 1990) : (1) no fluxes into or out of the soil column other than precipitation at the soil surface; (2) infiltration and moisture migration occur instantaneously; (3) the effect of hysteresis of the characteristic curves is neglected .
Based on the estimation, the total rainfall during dry and wet antecedent suction conditions would only saturate the soil column at 1 m depth. However, in comparison with wetter antecedent moisture conditions, more rainfall totals were required to saturate the soil column under drier antecedent moisture conditions. The estimation also indicates that the monitored rainfall would have saturated the soil column to the depth of 3 m under the wet antecedent condition, when the matric suction was smaller than the air-entry value of the soil. Nevertheless, the records of pore-water pressure indicate no subtantial development of positive pore-water pressures within the soil, suggesting that most of infiltration did not reach the deeper soil column.
Thus, the analysis of tensiometer data to evaluate the hydrological response of a soil slope should
9/28/08 10/3/08 10/8/08 10/13/08 10/18/08 10/23/08 10/28/08 11/2/08 11/7/08
Co
111 Factor Controlling Hydrological Responses to
Rainfalls
Records of pore-water pressure responses collected during this study indicate that the hydrological condition on the volcanic soil slopes is obviously complex, and show variations in pore-water pressure response over a short distance. The main factor controlling the hydrological response of this soil slope is the antecedent hydrological condition of the soil
slope. Higher antecedent moisture condition would lead to more sustained development of pore-water pressures in response to rainfall.
Another hydrological factor, such as the presence of soil layers with different hydraulic conductivities can contribute to the variations of hydrological response of the soil slope. A soil layer with higher hydraulic conductivity can contribute to a localized build up of higher pore-water pressure in the soil layer. Close
Figure 13. Variations of the calculated cumulative infiltration (I) and the monitored cumulative rainfall (R) with time. Dates are given as month-day-year
112
examination of monitoring records of nest A shows that the deepest soil exhibit higher pore-water pressure response than the intermediate soil. This suggests that flow condition within the deeper part soil profile is not only characterized by vertical infiltration alone, but also by additional source of moisture. This type of response can be explained by lateral flow, associated with the presence of soil layer with higher hydraulic conductivity that provides a preferential path for moisture movement, thus contributing to the development of higher pore-water pressure in the deepest soil layer
The data collected during this study also indicate that topographical convergence, associated with thinning of soil profile, can modify groundwater response within the slope, hence resulting in localized development of higher groundwater table. This condition is likely to develop, especially, in locations where less permeability bedrock highs exist across the direction of flow or at the downslope-ends of bedrock depression (Johnson and Sitar, 1990).
CONCLUSIONS
A volcanic soil cut-slope in an active landslide area in West Java was instrumented to monitor the pore-water pressure variations of the 3-m thick soil profile. to evaluate the hydrologic response of the slope to rainfall. The results of a 12-month field-instrumentation program have been used to identify the typical characteristics of the hydrologic response of the slope soil to rainfall and to assess the significance of antecedent soil moisture condition in controlling the hydrologic response of the volcanic soil slope. In general, the hydrologic response of the soil profile is spatially varied and also depending upon rainfall pattern.
The hydrologic responses of the soil slope observed in all nests are characterized by a higher antecedent soil suction in the shallower soils than in the deeper soils. In general, the antecedent pore-water pressure condition increases with depth. Consequently, in response to rainfall infiltration, the shallower soils exhibit more rapid increase of pore-water pressure than the deeper soil. However, the response of the
shallower soils is less sustained than the deeper soils. These data evidently demonstrate the importance of antecedent pore-water pressure condition on controllig the hydrologic responses of the volcanic soil.
The monitored pore-water pressure responses of the volcanic soil slope show that the ingress of wetting front often reached to a depth of 3-m. However, the development of transient positive pore-water pressures was only confined within the 1-m thick of soil profile during a short period rainfall of high intensity. On the other hand, higher pore-water pressures could develop within the deeper soils than the shallower soils in the lower part of the slope under a longer rainfall of lower intensity. These observations suggest that downward migration of moisture is more dominant than downslope migration in the lower part of the slope. At the end of wet period, the rate at which the pore-water pressure of the deeper soils decrease is less rapid than the shallower soils. Consequently, the pore-water pressure of the deeper soils tends to be higher than that of the shallower soils.
While the antecedent soil condition has been previously reported in terms of antecedent rainfall totals and seasonal precipitation, the influence of the antecedent sol condition on the hydrological response has been quantitatively demonstrated by tensiometer data collected during this study. This method correlates the antecedent pore-water pressure with antecedent moisture content, in conjuction with the water characteristic curve of a soil, to estimate the amount of rainfall to saturate a soil column at any given instant. Because the tensiometer measurements can be easily and rapidly made, the use of pore-water pressure as antecedent moisture index should prove superior to rainfall totals and other empirically based methods of estimating antecedent moisture conditions. Nevertheless, further study to obtain a useful extrapolation between antecedent pore-water pressures of a soil and rainfall totals are recommended .
The hydrological responses of the volcanic soil slope monitored during this study is very
complex. The transient nature of the response appeared to be spatiall and temporally variable in a short distance across and along the slope, and
113 hydraulic conductivity discontinuity, and
variations of soil thickness due to bedrock depression appeared to have significant contributions to the increases in pore-water pressure and groundwater level in the volcanic soil slope monitored in this study. Thus, the hydrological response of the volcanic soil slope is highly site-specific, and cannot be entirely explained by a traditional hydrological models.
ACKNOWLEDGMENTS
The author would like to acknowledge the research funding from the Research Centre for Geotechnology - Indonesian Institute of Sciences in FY 2008 and 2009.
REFERENCES
Anderson, M.G. 1983. The prediction of soil suction for slopes in Hong Kong, final report. Geotechnical Control Office, Public Works Department, Hong Kong.
Anderson, S. A., and Thallapally, L. K., 1996. Hydrological response of a steep tropical slope on heavy rainfall. Proceedings of 7th International Symposium on Landslides,
17-21 June 1996. Trondheim,
Norway,1489-1495.
Fredlund, D.G., and Rahardjo, H., 1993. Soil Mechanics for unsaturated soils. John Wiley & Sons, Inc., New York.
Gasmo, J.M., Hritzuk, K.J., Rahardjo, and Leong, E.C. 2000. Instrumentation of an unsaturated residual soil slope. Geotech. Testing J. 22(2): 128-137.
Johnson, K. A., Sitar, N., 1990. Hydrological conditions leading to debris flow initiation. Can. Geotech. J. 27(6): 789-801.
Krahn, J., Fredlund, D.G., and Klassen, M.J. 1989. Effect of soil suction on slope
stability at Notch Hill. Can. Geotech. J. 26: 269-278.
Lim, T.T., Rahardjo, H., Chang, M.F., and Fredlund, D.G. 1996. Effect of rainfall on matric suctions in a residual soil slope. Can. Geotech. J. 33: 618-628.
Lie, A.G., Yien, Z.Q., Tham, L.G., Lee, C.F., and lau K.T., 2005. Field-monitored variations of soil moisture and matric suction in a saprolite slope. Can. Geotech. J. 42: 13-26.
Rahardjo, H., 1999. The effect of rainfall on the slope stability of residual soil in Singapore. Report of Research Project, Nanyang Technology University, Jurong, Singapore.
Sitar, N., and Anderson, S. A., 1992. Conditions for initiation of rainfall-induced debris flows. Geotechnical Engineering Division Specialty Conference: Stability and Performance of Slopes and Embankments-II, ASCE, New York, NY. pp. 834-849.
Stannard, D.I., 1992. Tensiometers – theory, construction, and use, Geotech. Test. J. 15, (2), 48-58.
Tohari A., Soebowo E. and Sarah D., 2006. Geological and Geotechnical Investigation of a Slow-Moving Landslide in Volcanic Residual Soil Slope For the Purpose of
Hazard Assessment.” Proc. of International
Symp. on Geotech. Hazard: Prevention, Mitigation and Engineering Response, Yogyakarta, 24-27 April 2006, 167-175.