C14. Estimation of the Optimal Set of Parameters for PAN-Sharpening of Satellite
Images Based on the Non-Sub-sampled Contourlet Transform
Mohamed R. Metwalli1, Ayman H. Nasr1, Osama S. Farag Allah2, S. El-Rabaie2, and Fathi E. Abd El-Samie2
1
Data Reception, Analysis and Receiving Station Affairs Division, National Authority for Remote Sensing and Space Sciences, 23 Joseph Broz Tito st., El-Nozha El-Gedida, Cairo, Egypt
2
Faculty of Electronic Engineering, Menoufia University, Menouf, 32952, Egypt
A
BSTRACTRecent studies show that hybrid PAN-sharpening methods using the Non-Sub-sampled Contourlet Transform (NSCT) and classical PAN-sharpening methods like the Intensity, Hue and Saturation (IHS), Principal Component Analysis (PCA), and Adaptive Principal Component Analysis (APCA), reduce the spectral distortion in the PAN-sharpened images. The NSCT is a shift-invariant multi-resolution decomposition. It is based on Non-Sub-sampled Pyramid (NSP) decomposition and Non-Sub-sampled Directional Filter Banks (NSDFB). We compare the performance of the APCA-NSCT using different NSP filters, NSDFB filters, number of decomposition levels, and number of orientations in each level on Spot4 data with spatial resolution ratio 1/2, and QuickBird data with spatial resolution ratio 1/4. Experimental results show that the quality of PAN-sharpening of remote sensing images of different spatial resolution ratios using the APCA-NSCT method is affected by NSCT parameters. For the NSP, the ‘maxflat’ filters have the best quality. For NSDFB the ‘sk’ filters have the best quality. Changing the number of orientations in the same level of decomposition in the NSCT has a small effect on both the spectral and spatial quality. The spectral and spatial quality of PAN-sharpened images mainly depends on the number of decomposition levels. Too few decomposition levels result in poor spatial quality, while excessive levels of decomposition result in poor spectral quality.
Keywords: NSCT, PCA, APCA, PAN-sharpening.
I.
I
NTRODUCTIONCurrently, several remote sensing image fusion methods have been developed, including the frequently used Brovey method, IHS method, PCA method, and the recently developed Multi-Resolution Analysis (MRA) techniques. The MRA techniques include the Wavelet Transform (WT), filter banks, Laplacian pyramids, and redundant multi-resolution structures, such as the Undecimated Discrete Wavelet Transform (UDWT) and the “A Trous” Wavelet Transform (ATWT) [1]. Multi-resolution algorithms have the ability to apply hierarchical decomposition of an input image into successive coarser approximations. Such decomposition separates low-frequency components from high-low-frequency components in both the PAN and Multi-Spectral (MS) images in a scale-by-scale manner. Thus, the low-frequency components of MS images can be used without any modifications during the fusion process, and consequently, spectral distortion is limited. The missing spatial information in the MS image can be inferred from the high-frequency components of the PAN image [2]. The redundant multi-resolution decompositions do not require sharp digital filters and are not critically sub-sampled. The typical injection artifacts appearing in the images fused by means of conventional wavelet analysis, like ringing effects and canvas-like patterns disappear, when the images are fused using the redundant MRA. Therefore, the redundant MRA methods are particularly suitable for PAN-sharpening [1].
The Contourlet Transform (CT) provides a new representation system for image analysis. The CT is so called because of its ability to capture and link the discontinuity points into linear structures (contours). The two stages used to derive the CT coefficients involve a multi-scale transform and a local directional transform. The CT provides 2l directions at each scale, where l is the number of required orientations. The CT lacks the shift-invariance and causes pseudo-Gibbs phenomena around singularities. The NSCT is a shift-invariant version of the CT, and it is based on the NSP and the NSDFB. Fusion based on the NSCT can use several methods for the injection of the image details. A number of hybrid methods have been developed to combine the best aspects of classical methods and multi-resolution transforms. Shah et al. [3] presented PCA-CT PAN-sharpening of high resolution (Ikonos and QuickBird) and medium resolution (Landsat7 ETM+) datasets. The NSCT provided better results than the sub-sampled CT.
;EZ^ϮϬϭϮͿ
ƉƌŝůϭϬǦǦǦǦϭϮ͕ϮϬϭϮ͕&ĂĐƵůƚLJŽĨŶŐŝŶĞĞƌŝŶŐͬĂŝƌŽhŶŝǀĞƌƐŝƚLJ͕ŐLJƉƚ
geometrical structures of the objects, efficiently. The adaptive PCA-NSCT method significantly outperforms the PCA-NSCT method.
The quality of the PAN-sharpened images by MRA is affected by the number of decomposition levels. If a small number of decomposition levels is used, the spatial quality of the PAN-sharpened images is less satisfactory. If a large number of decomposition levels is used, the spectral similarity between the original MS and the PAN-sharpened images is decreased. The number of decomposition levels for the dataset is based on the resolution ratio between the MS image and the PAN image. It is advocated that when it is necessary to preserve the radiometry of the original MS images to the maximum extent, for tasks like automated classification, a small number of decomposition levels is used. However, if the application is automated object extraction, where images with good contrast and high-quality edge information are desired, a large number of decomposition levels is recommended [6]. Li et al. [7] compared the image fusion performance of different multi-resolution transforms with different filters and numbers of decomposition levels on different types of images like multi-focus images, infrared-visible images and medical images. The results indicated that the NSCT achieved the best performance on different types of images and the property of shift-invariance is important for image fusion. Short filters usually provide better fusion results than long filters.
In this paper, the optimal set of NSCT parameters (number of decomposition levels, number of orientations for different levels, different decomposition filters) for PAN-sharpening of remote sensing images with different spatial resolution ratios using the adaptive PCA-NSCT method are investigated.
II.
APCA
I
MAGEF
USIONThe PCA is a linear transformation of the multi-dimensional data. The data are transformed to a new coordinate system such that the first principle component (PCA1) has the largest variance, the second component (PCA2) has the next largest variance, and so forth. Let X is a p-dimensional random column vector having a zero empirical mean. The PCA transformation tries to find a p × p orthonormal projection matrix W such that:
X
W
s
=
T (1)where the elements of W are the eigenvectors of the covariance matrix of X [8]. The standard PCA based PAN-sharpening method replaces the first principal component (PCA1) of the MS image by the histogram-matched PAN image. This substitution is not based on any statistical measures between PCA of the MS and the PAN images. A high variance of the PCA1 does not necessarily mean that it has a high correlation with the PAN image. Thus, the APCA method can be employed to improve the fusion result by adaptively selecting the component for the substitution or injection of high-frequency spatial details taking the dependency between the principal components of the MS and PAN images into consideration. A statistical measure, based on the Cross-Correlation (CC) coefficient, is incorporated into the process to adaptively determine the appropriate principal components to be injected with detail information [5]. For two images X and Y with M × N pixels, the CC is defined as follows:
where
x
andy
are the mean values of X and Y, respectively. We select the PCs having the highest absolute values of CC with the PAN image. It should be noted that if the sign of the highest CC is negative, we need to inverse the PAN image before performing histogram matching.III.
NSCT
Cunha et al. [9] presented the NSCT as an extension to the wavelet and curvelet transforms. The NSCT is shift-invariant by eliminating the up-sampling and down-sampling operations, and the size of different sub-bands is identical, which is beneficial for designing image fusion rules. The NSCT is implemented by two shift-invariant stages; an NSP structure that gives the multi-scale property, and an NSDFB structure that ensures directionality. Combining the NSP and the NSDFB banks gives the NSCT; both stages of the NSCT are constructed to be invertible. Fig 1(a) displays the NSCT, and Fig 1 (b) shows the 2-D frequency-plane partitioning with the NSCT. For successive levels of decomposition, the filters responses are up-sampled accordingly. The high-pass information from the NSP stage is fed to the NSDFB stage, thus decomposing the image into multiple directions
at varying scales. On the j-th dec
sampling that of the first stage, which g The NSFB is built from a low-pass corresponding synthesis filters areG0(z)
1
Fig. (1) The NSCT. (a) NSDFB stru
The Directional Filter Bank (DFB) o two-channel fan filter bank and resampl frequency plane into directional wedges samplers in the DFB tree structure and two-channel non sub-sampled filter bank the next level, we up-sample all filters b checker-board frequency support, and w frequency decompositions [9]. Fig. 2 (a the corresponding 2-D frequency decom
(a)
Fig. (2) A four-channel NSFDB constructed
omposition, the desired band-pass support of the lo
ding band-pass support of the high-pass filter is the comp
2
π . The filters of subsequent scales can be acqu
gives the multi-scale property without the need of addition filter H0(z), and the high-pass filter is H1(z)=
1 ) (
)=G1 z = . The perfect reconstruction condition is give
(b)
ucture. (b) The idealized frequency partitioning obtained with th
of Bamberger et al. [10] was constructed by combining a c ing operations. The result is a tree structured filter bank t s. The NSDFB is constructed by eliminating the down-s d up-sampling the filters, accordingly. This results in a t k. To obtain a finer directional decomposition, we iterate by a quincunx matrix. The up-sampled fan filters
u
i(
z
Qwhen combined with filters in the first level, they give the ) illustrates the four-channel NSDFB decomposition, and mposition.
(b)
d with two-channel fan filter banks. (a) Filtering structure. (b) C frequency decomposition.
ow-pass filter is
plement set of the
up-;EZ^ϮϬϭϮͿ
ƉƌŝůϭϬǦǦǦǦϭϮ͕ϮϬϭϮ͕&ĂĐƵůƚLJŽĨŶŐŝŶĞĞƌŝŶŐͬĂŝƌŽhŶŝǀĞƌƐŝƚLJ͕ŐLJƉƚ
IV.
APCA-NSCT
PAN-
SHARPENINGThe PAN-sharpening process begins with the registration of the MS image and the PAN image, and after that the resizing the MS image to the size of the PAN image using bicubic interpolation. The steps of the PAN-sharpening process can be summarized as follows:
1) Perform PCA on the normalized MS images to get PC1, PC2, . . ., and PCN.
2) Calculate the CCs between the PCs and the PAN image, then select the PC having the highest absolute CC value.
3) Perform histogram matching of the PAN image with selected PC.
4) Perform NSCT on the histogram-matched PAN and the selected PC into different levels and orientations.
where the superscript r denotes the residual low-pass filtered version of the NSCT coefficients and the superscript ld refers to the high-frequency coefficients, withl=1, …, L, representing the levels of NSCT and d=1, …, D, representing the direction for each coefficient.
5) Merge the high-frequency coefficients of PAN and selected PCs getting ld
s
PC
∗
, keeping the residual image unchanged
6) Perform an inverse NSCT on the modified PCs
∗
coefficients.
7) Perform an inverse PCA to get the PAN-sharpened MS image.
V.
Q
UANTITATIVE MEASUREMENTSSince the goal of PAN-sharpening is to enhance the spatial quality of the MS image and also preserve its spectral properties, two sets of metrics must be used for spectral and spatial quality evaluation.
A. Spectral Quality Metrics
The goal of PAN-sharpening is to preserve the radiometry of the original MS images as much as possible, thus any metric used must measure the amount of change in pixel values in the PAN-sharpened image compared to the original MS image. The Root Mean Square Error (RMSE) between the MS band and corresponding sharpened band can be computed as a measure of spectral fidelity [12]. It measures the amount of change per pixel due to the processing and it is described as
where DN means the pixel values,
DN
msl is a certain band of LR MS image, andDN
msh is its corresponding band of the PAN-sharpened MS image.B. Spatial Quality Metrics
The High-Pass Correlation Coefficient (HPCC) was first proposed by Zhou et al. [12] to measure the amount of edge information from the PAN image that has been transferred into the fused MS image. The correlation coefficient between the high-pass filtered PAN image and the bands of PAN-sharpened MS image would indicate how much spatial information from the PAN image has been incorporated into the MS image. A high correlation implies that the edge information is similar. The authors made use of a Laplacian filter as the high-pass filter, whose coefficients are given by:
»
»
»
¼
º
«
«
«
¬
ª
−
−
−
−
−
−
−
−
=
1
1
1
1
8
1
1
1
1
H
VI.
E
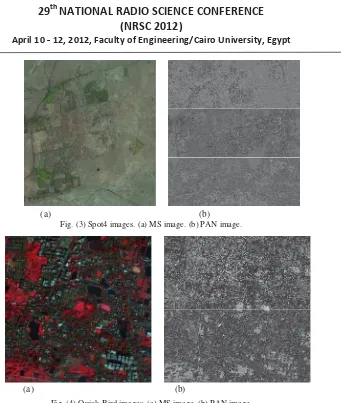
XPERIMENTAL RESULTSExperiments have been performed to test the effect of changing the NSCT parameters on the PAN-sharpening of satellite images with datasets of different spatial resolution ratios, and the optimal set of parameters for each spatial resolution ratio have been presented. Fig. 4 shows the MS and PAN images of Spot4 Data for a part of Cairo, Egypt with a spatial resolution ratio of 1/2. Fig. 5 shows the MS and PAN images of Quick-Bird Data for a part of Sundarbans, India with a spatial resolution ratio of 1/4. The PAN-sharpening has been performed using the APCA-NSCT hybrid fusion method, where the APCA has been applied first on MS image to select the most correlated PC component with the PAN image. Then NSCT has been applied on the selected PC and the histogram matched PAN image with the selected PC. An additive fusion rule has been used to combine the high-frequency coefficients of the selected PC and the matched PAN image keeping the low-high-frequency coefficients unchanged. The parameters of the NSCT that have been tested are number of decomposition levels, the number of orientations for different levels, the NSP different filters bank and the NSDFB different filter banks. Four categories of NSP filters (‘9-7’, ‘maxflat’, ‘pyr’, and ‘pyrexc’) have been compared, while eight categories of orientation filters (‘haar’, ‘vk’,’ kos’, ‘sk’, ‘cd’, ‘dvmlp’, ‘pkva’, ‘dmaxflat5’) have also been compared.
To investigate the effect of change of the NSP filters we set the number of decomposition levels to 2, the NSDFB to ‘dmaxflat5’, and number of orientations in each level to 4. Tables 1 and 2 show the RMSE and HPCC values of all bands for different NSP filters, for Spot4 and QuickBird data, respectively. From the results, the ‘maxflat’ filters have the lowset RMSE for both the Spot4 and QuickBird data, and at the same time, the difference in HPCC corresponding to the other NSP filter categories is very small.
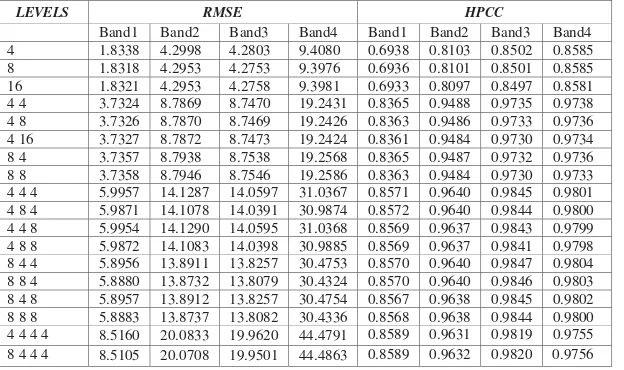
To investigate the effect of change of the NSDFB filters, we set number of decomposition levels to 2, NSP to ‘maxflat’, which gives the minimum spectral distortion in the previous test and number of orientations in each level to 4. Tables 3 and 4 show the RMSE and HPCC values of all bands for different NSDFB filters, for Spot4 and QuickBird data, respectively. From the results, the ‘sk’ filters have the lowset RMSE for both the Spot4 and QuickBird data. The HPCC for ‘sk’ filters have the highest values in the case of Spot4, and in the case of QuickBird, HPCC is comparable to the highset one. To investigate the effect of change of the number of decomposition levels and the number of orientation in each level, we set NSP to ‘maxflat’, and NSDFB to ‘sk’. Tables 5 and 6 show the RMSE and HPCC values of all bands for different decomposition levels and orientations in each level,for Spot4 and QuickBird data, respectively. From Table 5 for Spot4 data with spatial resolution ratio 1/2, we get the best HPCC, which corresponds to the best spatial quality in the case of 2 levels of decomposition and 4 orientations in each level. Increasing the number of decomposition level to 3 causes more spectral and spatial distortion at the same time and needs more computation time and memory. From Table 6 for QuickBird data with a spatial resolution ratio of 1/4, we get the best HPCC in the 3 levels of decomposition and {8, 4, 4} orientations. Increasing the number of decomposition levels to 4 causes more spectral and spatial distortion at the same time and needs more computation time and memory. For the same number of decomposition levels, increasing the number of orientations in each level has a small effect on both the spectral and spatial qualities of the PAN-sharpened image, but needs more computation time and memory.
;EZ^ϮϬϭϮͿ
ƉƌŝůϭϬǦǦǦǦϭϮ͕ϮϬϭϮ͕&ĂĐƵůƚLJŽĨŶŐŝŶĞĞƌŝŶŐͬĂŝƌŽhŶŝǀĞƌƐŝƚLJ͕ŐLJƉƚ
(a) (b)
Fig. (3) Spot4 images. (a) MS image. (b) PAN image.
(a) (b)
Fig. (4) Quick-Bird images. (a) MS image. (b) PAN image.
Table 1: RMSE and HPCC Values of All Bands for Different NSP Filers in The Case of Spot4 Data.
Table 2: RMSE and HPCC Values of All Bands for Different NSP Filers in The Case of QuickBird Data.
Table 3: RMSE and HPCC Values of All Bands for Different NSDFB Filers in The Case of Spot4 Data.
TYPE RMSE HPCC
Band1 Band2 Band3 Band4 Band1 Band2 Band3 Band4
‘9-7’ 2.6284 3.3209 3.5645 3.3978 0.9462 0.9501 0.9470 0.9586
‘maxflat’ 2.5366 3.2045 3.4399 3.2783 0.9460 0.9500 0.9470 0.9589
‘pyr’ 2.6237 3.3147 3.5579 3.3912 0.9464 0.9505 0.9474 0.9593
‘pyrexc’ 2.6237 3.3147 3.5579 3.3912 0.9464 0.9505 0.9474 0.9593
TYPE RMSE HPCC
Band1 Band2 Band3 Band4 Band1 Band2 Band3 Band4
‘9-7’ 3.9457 9.2904 9.2476 20.3427 0.8416 0.9540 0.9783 0.9783
‘maxflat’ 3.8221 8.9988 8.9577 19.7038 0.8383 0.9509 0.9756 0.9759
‘pyr’ 3.9052 9.1943 9.1529 20.1337 0.8405 0.9541 0.9793 0.9792
‘pyrexc’ 3.9052 9.1943 9.1529 20.1337 0.8405 0.9541 0.9793 0.9792
TYPE RMSE HPCC
Band1 Band2 Band3 Band4 Band1 Band2 Band3 Band4
‘haar’ 2.5825 3.2623 3.5018 3.3379 0.6175 0.5586 0.5992 0.6001
‘vk’ 2.5366 3.2045 3.4399 3.2783 0.9460 0.9500 0.9470 0.9589
‘kos’ 2.5825 3.2623 3.5018 3.3379 0.6175 0.5586 0.5992 0.6001
‘sk' 2.4251 3.0631 3.2878 3.1337 0.9464 0.9511 0.9476 0.9601
‘cd' 2.5366 3.2045 3.4399 3.2783 0.9460 0.9500 0.9470 0.9589
‘dvmlp' 2.5366 3.2045 3.4399 3.2783 0.9460 0.9500 0.9470 0.9589
‘pkva’ 2.5366 3.2045 3.4399 3.2783 0.9460 0.9500 0.9470 0.9589
Table 4: RMSE and HPCC Values of All Bands for Different NSDFB Filers in The Case of QuickBird Data.
Table 5: RMSE and HPCC Values of All Bands for Different NSDFB Filers in The Case of Spot4 Data.
Table 6: RMSE and HPCC Values of All Bands for Different NSDFB Filers in The Case of QuickBird Data.
TYPE RMSE HPCC
Band1 Band2 Band3 Band4 Band1 Band2 Band3 Band4
‘haar’ 3.8392 9.0305 8.9953 19.8025 0.4450 0.4253 0.3841 0.3614
‘vk’ 3.8221 8.9988 8.9577 19.7038 0.8383 0.9509 0.9756 0.9759
‘kos’ 3.8392 9.0305 8.9953 19.8025 0.4450 0.4253 0.3841 0.3614
‘sk' 3.7324 8.7869 8.7470 19.2431 0.8365 0.9488 0.9735 0.9738
‘cd' 3.8221 8.9988 8.9577 19.7038 0.8383 0.9509 0.9756 0.9759
‘dvmlp' 3.8221 8.9988 8.9577 19.7038 0.8383 0.9509 0.9756 0.9759
‘pkva’ 3.8221 8.9988 8.9577 19.7038 0.8383 0.9509 0.9756 0.9759
‘dmaxflat5’ 3.8221 8.9988 8.9577 19.7038 0.8383 0.9509 0.9756 0.9759
LEVELS RMSE HPCC
Band1 Band2 Band3 Band4 Band1 Band2 Band3 Band4
4 1.0390 1.3057 1.4002 1.3352 0.8568 0.8549 0.8656 0.8848
8 1.0392 1.3055 1.3999 1.3352 0.8567 0.8548 0.8655 0.8847
16 1.0407 1.3073 1.4018 1.3369 0.8565 0.8543 0.8651 0.8842
4 4 2.4251 3.0631 3.2878 3.1337 0.9464 0.9511 0.9476 0.9601
4 8 2.4257 3.0642 3.2888 3.1349 0.9463 0.9510 0.9475 0.9600
4 16 2.4264 3.0647 3.2895 3.1356 0.9462 0.9507 0.9473 0.9598
8 4 2.4260 3.0648 3.2895 3.1353 0.9464 0.9511 0.9476 0.9601
8 8 2.4275 3.0660 3.2913 3.1367 0.9462 0.9508 0.9474 0.9599
4 4 4 3.8419 4.8558 5.2136 4.9688 0.9442 0.9467 0.9434 0.9547
4 8 4 3.8354 4.8479 5.2044 4.9605 0.9443 0.9468 0.9435 0.9548
4 4 8 3.8422 4.8564 5.2141 4.9695 0.9441 0.9466 0.9433 0.9546
4 8 8 3.8358 4.8487 5.2049 4.9612 0.9441 0.9466 0.9433 0.9546
8 4 4 3.7746 4.7714 5.1226 4.8821 0.9444 0.9470 0.9437 0.9550
8 8 4 3.7695 4.7646 5.1153 4.8750 0.9445 0.9471 0.9438 0.9551
8 4 8 3.7750 4.7721 5.1231 4.8824 0.9443 0.9469 0.9436 0.9549
8 8 8 3.7700 4.7651 5.1161 4.8757 0.9443 0.9469 0.9436 0.9549
LEVELS RMSE HPCC
Band1 Band2 Band3 Band4 Band1 Band2 Band3 Band4
4 1.8338 4.2998 4.2803 9.4080 0.6938 0.8103 0.8502 0.8585
8 1.8318 4.2953 4.2753 9.3976 0.6936 0.8101 0.8501 0.8585
16 1.8321 4.2953 4.2758 9.3981 0.6933 0.8097 0.8497 0.8581
4 4 3.7324 8.7869 8.7470 19.2431 0.8365 0.9488 0.9735 0.9738
4 8 3.7326 8.7870 8.7469 19.2426 0.8363 0.9486 0.9733 0.9736
4 16 3.7327 8.7872 8.7473 19.2424 0.8361 0.9484 0.9730 0.9734
8 4 3.7357 8.7938 8.7538 19.2568 0.8365 0.9487 0.9732 0.9736
8 8 3.7358 8.7946 8.7546 19.2586 0.8363 0.9484 0.9730 0.9733
4 4 4 5.9957 14.1287 14.0597 31.0367 0.8571 0.9640 0.9845 0.9801
4 8 4 5.9871 14.1078 14.0391 30.9874 0.8572 0.9640 0.9844 0.9800
4 4 8 5.9954 14.1290 14.0595 31.0368 0.8569 0.9637 0.9843 0.9799
4 8 8 5.9872 14.1083 14.0398 30.9885 0.8569 0.9637 0.9841 0.9798
8 4 4 5.8956 13.8911 13.8257 30.4753 0.8570 0.9640 0.9847 0.9804
8 8 4 5.8880 13.8732 13.8079 30.4324 0.8570 0.9640 0.9846 0.9803
8 4 8 5.8957 13.8912 13.8257 30.4754 0.8567 0.9638 0.9845 0.9802
8 8 8 5.8883 13.8737 13.8082 30.4336 0.8568 0.9638 0.9844 0.9800
4 4 4 4 8.5160 20.0833 19.9620 44.4791 0.8589 0.9631 0.9819 0.9755
;EZ^ϮϬϭϮͿ
ƉƌŝůϭϬǦǦǦǦϭϮ͕ϮϬϭϮ͕&ĂĐƵůƚLJŽĨŶŐŝŶĞĞƌŝŶŐͬĂŝƌŽhŶŝǀĞƌƐŝƚLJ͕ŐLJƉƚ
VII.
C
ONCLUSIONThe quality of PAN-sharpening of remote-sensing satellite images of different spatial resolution ratios using the APCA-NSCT method is affected by NSCT parameters. We have studied the performance of this method using different NSP, NSDFB, number of decomposition levels, and number of orientations in each levels on Spot4 data with a spatial resolution ratio of 1/2, and QuickBird data with a spatial resolution ratio of 1/4. From the results, for the NSP, the ‘maxflat’ filters achieved the best quality. Also, for the NSDFB, the ‘sk’ filters showed the best quality. Changing the number of orientations in the same level of decomposition has a small effect on both the spectral and spatial quality. The spectral and spatial quality of PAN-sharpened images depends mainly on the number of decomposition levels. Too few decomposition levels result in a poor spatial quality, while excessive levels of decomposition result in poor spectral quality. Two levels of decompositions in the case of Spot4 data with a spatial resolution ratio of 1/2 have achieved the best results, while three levels of decompositions in the case of QuickBird data with a spatial resolution ratio of 1/4 have achieved the best results.
R
EFERENCES[1] S. Zheng, W. Shi, J. Liu, and J. Tian, "Remote sensing image fusion using multiscale mapped LS-SVM", IEEE Trans. Geosci. Remote Sens. VOL.46, NUMBER 5, PP. 1313–1322, 2008.
[2] A. G. Mahyari and M. Yazdi, "Panchromatic and Multispectral Image Fusion Based on Maximization of Both Spectral and Spatial Similarities", IEEE Trans. Geosci. Remote Sens, VOL. 49, NUMBER 6, PP. 1976-1985, 2011
[3] V. P. Shah, N. H. Younan, R. King “Pan-sharpening via the Contourlet Transform”, IEEE International Geosciences and Remote Sensing Symposium, PP. 310–313, 2007.
[4] Y. Xiaohui, J. Licheng, “Fusion algorithm for remote sensing images based on nonsub-sampled contourlet transform”, Acta Automatica Sinica, vol. 34, number3, pp. 274-281, 2008.
[5] V.P. Shah, N.H. Younan, R. King, An efficient pan-sharpening method via a combined adaptive PCA approach and contourlets, IEEE Trans. Geosci. Remote Sens. VOL.46, NUMBER 5, PP. 1323–1335, 2008. [6] P. S. Pradhan, R. L. King, N. H. Younan, D. W. Holcomb , Estimation of the number of decomposition
levels for a wavelet-based multiresolution multisensory image fusion. IEEE Trans Geosc Remote Sens. Vol. 44, NUMBER 12, PP. 3674–3686, 2006.
[7] S. Li , B. Yang, J. Hu, “Performance comparison of different multi-resolution transforms for image fusion”, Information Fusion, 12 , PP. 74–84, 2011.
[8] S.Yang , M. Wang, L.Jiao, Fusion of multispectral and panchromatic images based on support value transform and adaptive principal component analysis, Infromation Fusion,2011.
[9] A. L. Cunha, J. Zhou, and M. N. Do, “The nonsub-sampled contourlet transform: Theory, design, and applications,” IEEE Trans. Image Process., vol. 15, pp. 3089–3101, 2006.
[10] R. H. Bamberger and M. J. T. Smith, “A filter bank for the directional decomposition of images: Theory and design,” IEEE Trans. Signal Process., vol. 40, number 4, pp. 882–893, Apr. 1992.
[11] I. Amro, J. Mateos, M. Vega, “Parameter Estimation In The General Contourlet Pansharpening Method Using Bayesian Inference”, EURASIP, 2011.