A NEW OBJECT-BASED FRAMEWORK TO DETECT SHODOWS IN
HIGH-RESOLUTION SATELLITE IMAGERY OVER URBAN AREAS
Nurollah Tatar a*, Mohammad Saadatsereshta, Hossein Arefia, Ahmad Hadavanda
a School of Surveying and Geospatial Information Engineering, College of Engineering, University of Tehran
Commission VII, WG VII/4
KEY WORDS: Shadow Detection, Spectral Index, High resolution satellite imagery, Segmentation, Object-based, Majority Voting.
ABSTRACT:
In this paper a new object-based framework to detect shadow areas in high resolution satellite images is proposed. To produce shadow map in pixel level state of the art supervised machine learning algorithms are employed. Automatic ground truth generation based on Otsu thresholding on shadow and non-shadow indices is used to train the classifiers. It is followed by segmenting the image scene and create image objects. To detect shadow objects, a majority voting on pixel-based shadow detection result is designed. GeoEye-1 multi-spectral image over an urban area in Qom city of Iran is used in the experiments. Results shows the superiority of our proposed method over traditional pixel-based, visually and quantitatively.
1. INTRODUCTION
From 1999 by the launch of IKONOS, known as the first high resolution satellite imaging system, new applications in photogrammetry and remote sensing are emerged such as: producing high resolution digital surface model, high precision land cover mapping, change detection and hazard management. Appearance of small urban objects e.g. buildings, single trees and cars build the possibility to detect and analyse these objects. Diversity of features in high resolution images from the perspective of spectral and geometrical properties make some difficulties in analysing these images. Variation of height in urban areas, coincide with the sun elevation angle makes shadows in the image scene. Shadow has both constructive and destructive role in the processing of the images. It helps in well detection of different objects visually and also automated detection of collapsed buildings after natural disasters e.g. earthquakes and 3D reconstruction of buildings (Huang and Kwoh, 2007; Tong et al., 2013). While it ruins the contrast of objects casted by shadow and consequently classification, objects detection and automated stereo image matching (Shahtahmassebi et al., 2013; Tsai, 2006).
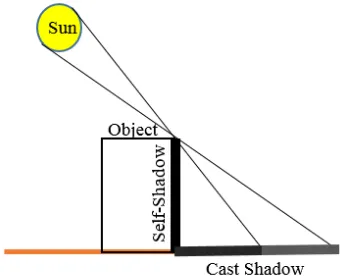
Shadows are produced when an opaque objects prevent the light rays to shine on a surface. It makes overacted areas appear darker than their surroundings. As presented in Figure 1 shadow consists of two parts: cast shadow and self-shadow. In aerial and satellite imagery the cast shadow affects more and in the following in this paper, everywhere we mention shadow it means cast shadow.
Knowing the accurate position of the sun and the sensor’s platform in the imaging time and accurate 3D model of the imaged scene, location of shadows in the image could be simulated geometrically (Nakajima et al., 2002; Zhan et al., 2005). This method demands deep and expensive information.
There is a plenty of methods which proposed to detect shadows in the remotely sensed imagery. Spectral indices obtained by simple computations over spectral bands is of the simplest methods (Song and Civco, 2002; Tsai, 2006). Although these indices unable to discern water bodies, asphalt roads and clouds. More advanced indices are proposed to solve this issue, for example thresholding on near infrared band to discriminate clouds or using spectral bands in visible parts of the spectrum to
discriminate water bodies (Shahtahmassebi et al., 2013). Modelling blackbody radiator model is another approach which integrates physical properties of shadows to design adaptive index. This method needs ground truth and metadata over the sensor and the imaged scene (Makarau et al., 2011).
Figure 1. Shadow formation and its components
Using spectral indices in shadow detection, usually is integrated to thresholding in pixel level. In this way, the correlation and contextual information of neighbouring pixels is neglected. In high resolution images, shadow regions also could be detected, analysing edge information and image segmentation (Arévalo et al., 2008; Dare, 2005; Elbakary and Iftekharuddin, 2014; Sarabandi et al., 2004). Some researchers also employed region growing concept to grow shadow seed points. This solution also has some deficiencies. Morphological filtering, gap filling methods and edge information are used to fulfil deficiencies (Arévalo et al., 2008; Song et al., 2014).
Supervised machine learning algorithms are widely used in shadow detection problems. Support vector machine and artificial neural networks are employed to detect shadows in pixel level (Liu et al., 2011; Lorenzi et al., 2012). In high resolution images single pixels are not meaningful independently. Object-based methods, integrating similar neighbouring pixels provides powerful tool to analyse high resolution image data. Object based image classification The International Archives of the Photogrammetry, Remote Sensing and Spatial Information Sciences, Volume XL-1/W5, 2015
paradigm is also used to detect shadows (Liu and Yamazaki, 2012; Zhang et al., 2014).
In this paper we propose a new shadow detection framework which integrates new spectral indices, machine learning algorithm and object-based image analysis principals. In the following the basic shadow indices are described and then the detail of proposed method is discussed. Then the result of experiments on high resolution satellite images is provided and the paper will ends with discussion and conclusion.
2. SHADOW DETECTION INDICES
Among different indices which are proposed to detect shadows, C3 component and blue/near infrared ratio are used in our proposed method. The computational aspects of these indices will be described in the following.
2.1 Invariant colour Model
Visible spectral bands includes blue, green and red are employed to calculate these components using the following equations (Gevers and Smeulders, 1999):
(1)
(2)
(3)
Among these components, C3 is useful in shadow detection (Tsai, 2006).
2.2 Blue/near infrared ratio
Absorption of electromagnetic waves is a function of their wavelength and expressed by Rayleigh equation as below:
(4)
In equation (4), is the grey value after absorption,
is the grey value before absorption and
is the wavelength. Based on this equation, for lower wavelengths the absorption is more. In addition, reflectivity in shadowed area have low value. So the variation of grey values in shadow and non-shadow areas is different and could be used as a measure in shadow detection. Following normalized index uses this fact:(5)
3. DATASET
A panchromatic and 4 band multi-spectral image acquired by GeoEye-1 high resolution sensor is used in the experiments. The spatial resolution of data is 0.5 and 2 meter for panchromatic and spectral bands respectively. The image is captured over an urban area in Qom city in Iran.
4. METHOD
As presented in Figure 2, our proposed method consists of 4 main steps. These steps are introduced in detail in the following.
Figure 2. flowchart of proposed shadow detection method
4.1 1st step: Pre-processing
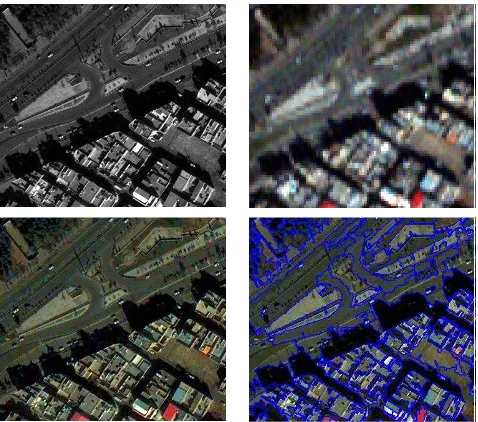
Figure 3. Original panchromatic and spectral bands (top), result of image fusion and image segmentation (bottom)
To prepare the data for further analysis, in the beginning fusion of panchromatic and spectral bands is used to enhance the spatial resolution of spectral bands. Due to its superiority in maintaining spatial accuracy, IHS algorithm (Strait et al., 2008) is employed here. Also in this step image objects are produced to use in further object-based process. Fractal Net Evolution Approach (FNEA) segmentation algorithm (Benz et al., 2004), implemented in eCognition software is used in this step. Figure The International Archives of the Photogrammetry, Remote Sensing and Spatial Information Sciences, Volume XL-1/W5, 2015
3 contains an overview of results of image fusion and segmentation.
We used FNEA segmentation algorithm which is implemented in eCognition software to this end. This algorithm gets scale parameter, shape and compactness weights as inputs. This parameters are set to 100, 0.1 and 0.9 respectively to build image objects to detect shadow areas.
4.2 2nd step: Generation of ground truth data
Supervised machine learning algorithms need some ground truth data in training step. Ground truth information usually are collected through the field inspection or visual analysis of the image data. Here we propose an automatic procedure to generate ground truth information.
In our work we need ground truth information for shadow and non-shadow classes. In this paper a new spectral index is designed to detect shadows. This index is a modified version of C3 component as follows:
(6)
Following histogram analysis and comparison for proposed index versus C3 and blue/near infrared simple ratio demonstrates the ability of C3new index in shadow detection.
Figure 4. C3 (top), blue/near infrared ratio (middle) and C3new (bottom) indices and following histograms
After calculating index values for the image pixels, Otsu thresholding algorithm is employed to automatically find the best threshold to detect shadow pixels. Morphological erosion filter the result to increase reliability of detected shadow pixels. Ground truth information for non-shadow class prepared by analysing normalized difference vegetation index (NDVI) and soil brightness (SBI) indices. Otsu thresholding and morphological erosion is also employed in a similar process to get the final ground truth in non-shadow class. In Figure 5 the
result of computing indices and selected pixels after Otsu thresholding could be seen.
Figure 5. Result of computing indices (left) and Otsu thresholding (right) for C3New (top), NDVI (middle) and SBI (bottom)
4.3 3rd step: Object-based and pixel-based shadow detection
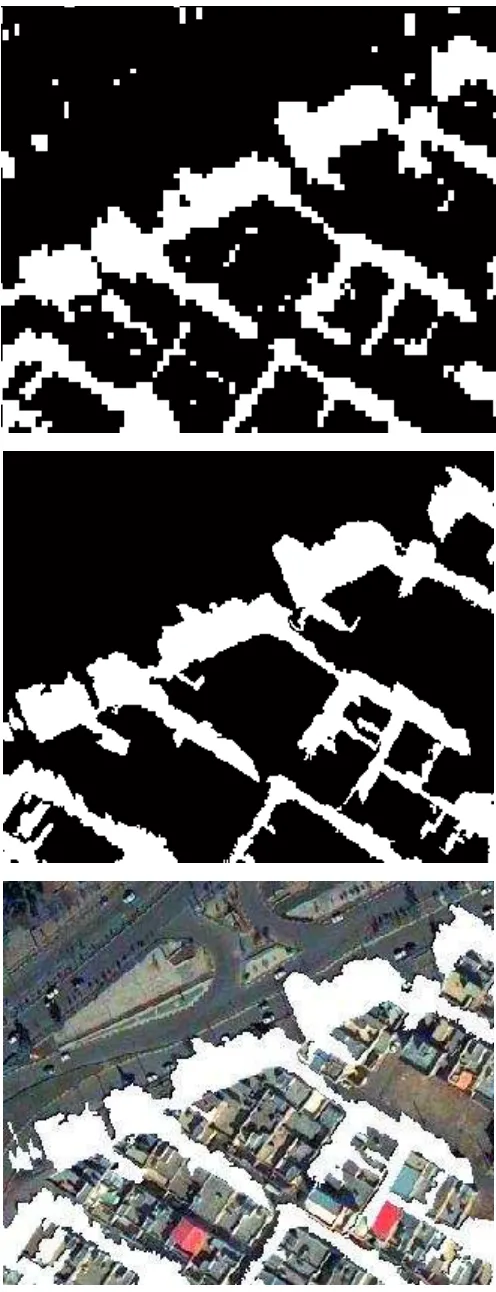
Ground truth information are used by supervised machine learning algorithms to separate shadow and non-shadow pixels. To detect shadow areas in object level, a majority voting analysis is used on number of shadow pixels in each image objects. To solve the ambiguity between vegetated and shadow objects an extra condition is checked to confirm that an object belongs to shadow class. This condition uses the mean NDVI value of pixels in each image object. For shadow objects the NDVI should have low values. The result of detecting shadows on pixel level using SVM algorithm, shadow detection on object level and overlay of shadow areas on original image is presented in Figure 6.visually the superiority of the object-based shadow detection results is clear and in evaluation step it will be approved.
Figure 6. Shadow detection result in pixel and object level
4.4 4th step: Evaluation
Results of shadow map, evaluates using a two class confusion matrix. As presented in Figure 7 there are 4 measures in this matrix includes: true positive (TP) number correctly classified shadow pixels, false positive (FP) number of wrongly classified non-shadow pixels as shadow, false negative (FN) number of shadow pixels which detected as non-shadow, and true negative (TN) number of non-shadow pixels classified correctly.
Ground truth information
Shadow Non-shadow
De
tec
ti
on
re
sult
Shadow TP FP
Non-shadow FN TN
Figure 7. Confusion matrix for shadow detection
Compactness, correctness and F-measure are calculated based on confusion matrix and are used to evaluate and compare the results. These measures are computed as below:
(7)
(8)
(9)
Details on evaluation of results will be expressed in the next section.
5. EVULATION OF RESULTS
To evaluate the results, 408 image objects in shadow class and 487 image objects in non-shadow class are selected manually. The confusion matrix is calculated for these objects and compactness, correctness and F-measure are calculated for the result. Table 1 contains the result of shadow detection respect to the result of SVM, random forest (RF) and maximum likelihood pixel-based classifiers. To assess the sensitivity of threshold in majority voting process, different thresholds are also selected and the results are compared.
Table 1. The result of object-based shadow detection using majority voting on different classifiers (Best result appears in bold face)
Classifier
Majority voting threshold
Completeness Correctness
F-measure
S
V
M
30 85 96 90
40 90 93 91
50 93 86 89
60 95 74 83
70 98 58 72
RF
30 93 91 92
40 95 83 88
50 97 72 82
60 98 58 73
70 98 40 57
ML
30 95 86 90
40 97 76 85
50 98 62 76
60 98 49 65
70 98 30 95
Table 2 contains the best object-based result versus pixel-based result for each classifier. This enables us to compare the result of pixel-based and object-based shadow detection.
Table 2. Comparison on object-based and pixel-based result of shadow detection
Method Completeness Correctness F-measure
SVM
Pixel-Accurately detection of shadows is a critical pre-processing step in many remote sensing image processing applications. Here we proposed a new object-based shadow detection method and take several experiments to compare our method with the traditional pixel-based one. Also the sensitivity of our algorithm against the selection of classifier and majority voting threshold is examined.
Result of our experiments in Table 2 demonstrates the superiority of proposed object-based over the pixel-based method respect to correctness and F-measure for different classifiers. This superiority could be seen in Figure 6. It is also evident that object-based method have well behaviour on the edge of shadow areas and perfectly detect shadows.
Figure 4 shows the ability of our proposed index to detect shadows. Bisection shape of C3New index makes it possible to detect shadow by thresholding. So the Otsu algorithm expected to work well with this index.
The sensitivity of object-based method to the threshold of majority voting is examined and the results are presented in Table 1. It seems that choosing higher thresholds increase the misclassified shadow areas and worsen the result. Comparison on different classifiers show that their performance doesn’t have meaningful difference.
Main deficiency of our proposed method is its failure in detecting the shadow of small objects. The fusion of pixel-based and object-based result is proposed to solve this issue and will follow by the authors.
REFERENCES
Arévalo, V., González, J., Ambrosio, G., 2008. Shadow detection in colour high‐resolution satellite images. International Journal of Remote Sensing 29, 1945-1963. Benz, U.C., Hofmann, P., Willhauck, G., Lingenfelder, I., Heynen, M., 2004. Multi-resolution, object-oriented fuzzy analysis of remote sensing data for GIS-ready information. ISPRS Journal of photogrammetry and remote sensing 58, 239-258.
Dare, P.M., 2005. Shadow Analysis in High-Resolution Satellite Imagery of Urban Areas. Photogrammetric Engineering & Remote Sensing 71, 9.
Elbakary, M.I., Iftekharuddin, K.M., 2014. Shadow detection of man-made buildings in high-resolution panchromatic satellite images. IEEE Transactions on Geoscience and Remote Sensing 52, 5374-5386.
Gevers, T., Smeulders, A.W.M., 1999. Color-based object recognition. Pattern Recognition 32, 453-464.
Huang, X., Kwoh, L.K., 2007. 3D building reconstruction and visualization for single high resolution satellite image, IEEE International Geoscience and Remote Sensing Symposium (IGARSS), p. 4.
Liu, J., Fang, T., Li, D., 2011. Shadow detection in remotely sensed images based on self-adaptive feature selection. IEEE Transactions on Geoscience and Remote Sensing 49, 5092-5103.
Liu, W., Yamazaki, F., 2012. Object-based shadow extraction and correction of high-resolution optical satellite images. IEEE Journal of Applied Earth Observations and Remote Sensing 5, 1296-1302.
Lorenzi, L., Melgani, F., Mercier, G., 2012. A complete processing chain for shadow detection and reconstruction in VHR images. IEEE Transactions on Geoscience and Remote Sensing 50, 3440-3452.
Makarau, A., Richter, R., Muller, R., Reinartz, P., 2011. Adaptive shadow detection using a blackbody radiator model. IEEE Transactions on Geoscience and Remote Sensing 49, 2049-2059.
Nakajima, T., Tao, G., Yasuoka, Y., 2002. Simulated recovery of information in shadow areas on IKONOS image by combing ALS data, Proc. Asian Conference on Remote Sensing. Sarabandi, P., Yamazaki, F., Matsuoka, M., Kiremidjian, A., 2004. Shadow detection and radiometric restoration in satellite high resolution images, IEEE International Geoscience and Remote Sensing Symposium (IGARSS), pp. 3744-3747. Shahtahmassebi, A., Yang, N., Wang, K., Moore, N., Shen, Z., 2013. Review of shadow detection and de-shadowing methods in remote sensing. Chinese Geographical Science 23, 403-420. Song, H., Huang, B., Zhang, K., 2014. Shadow Detection and Reconstruction in High-Resolution Satellite Images via Morphological Filtering and Example-Based Learning. IEEE Transactions on Geoscience and Remote Sensing 52, 2545-2554.
Song, M., Civco, D.L., 2002. A knowledge-based approach for reducing cloud and shadow, Proceedings of the American Society of Photogrammetry and Remote Sensing (ASPRS-ACSM), Washington.
Strait, M., Rahmani, S., Merkurev, D., 2008. Evaluation of pan-sharpening methods, UCLA Department of Mathematics. Tong, X., Lin, X., Feng, T., Xie, H., Liu, S., Hong, Z., Chen, P., 2013. Use of shadows for detection of earthquake-induced collapsed buildings in high-resolution satellite imagery. ISPRS Journal of Photogrammetry and Remote Sensing 79, 15. Tsai, V.J., 2006. A comparative study on shadow compensation of color aerial images in invariant color models. IEEE Transactions on Geoscience and Remote Sensing 44, 10. Zhan, Q., Shi, W., Xiao, Y., 2005. Quantitative analysis of shadow effects in high-resolution images of urban areas, International Archives of Photogrammetry and Remote Sensing. Zhang, H., Sun, K., Li, W., 2014. Object-Oriented Shadow Detection and Removal From Urban High-Resolution Remote Sensing Images. IEEE Transactions on Geoscience and Remote Sensing 52, 11.