LANDSCAPES IMPACTED BY LIGHT
B. Arellano & J. Roca a
a UPC, Technical University of Catalonia, Av. Diagonal, 08028 Barcelona, Spain –[email protected],
Commission VIII, WG VIII/8
KEY WORDS: human settlements, urban sprawl, nighttime lights, rurbanization, ex-urban
ABSTRACT
The gradual spread of urbanization, the phenomenon known under the term urban sprawl, has become one of the paradigms that have characterized the urban development since the second half of the twentieth century and early twenty-first century. However, there is no unanimous consensus about what means "urbanization". The plurality of forms of human settlement on the planet difficult to identify the urbanization processes. The arrival of electrification to nearly every corner of the planet is certainly the first and more meaningful indicator of artificialization of land. In this sense, the paper proposes a new methodology based on the analysis of the satellite image of nighttime lights designed to identify the highly impacted landscapes worldwide and to build an index of Land Impacted by Light per capita (LILpc) as an indicator of the level of urbanization. The used methodology allows the identification of different typologies of urbanized areas (villages, cities or metropolitan areas), as well as “rural”, “rurban”, “periurban” and “central” landscapes.
The study identifies 186,134 illuminated contours (urbanized areas). In one hand, 404 of these contours could be consider as real “metropolitan areas”; and in the other hand, there are 161,821 contours with less than 5,000 inhabitants, which could be identify as “villages”. Finally, the paper shows that 44.5% live in rural areas, 15.5% in rurban spaces, 26.2% in suburban areas and only 18.4% in central areas.
1. INTRODUCTION
The second half of the twentieth century has been, without doubt, the time when there has been further development of urbanization on a global scale. The urban population has grown from 750 million people in 1950 to 2,860 in 2000, more than 50% of the world population (United Nations, 2014).
The urban model has suffered significant changes in last decades, transforming from amodel of urban continuum of medium and high densities to a model ofan endless diffuse and sprawled city, driven by technological innovation processes, separation of functions and searching the proximity to the nature (Tsai, 2005). This redefinition of the spatial model has based on new communication networks and infrastructures. The pattern has resulted in an expansionist, unsustainable and predatory city, especially in USA, paradigmatic example of high consumption of land (Fulton et al, 2001).
Therefore, since 1950 there has been a real reversal in the topology of the landscape. Landscapes highly artificialized1 have become from "islands" within the "rural ocean" to "colonize" almost the entire planet. The process of urban sprawl has relegated to open spaces the role of auxiliary elements within the spatial structure.
The diffusion of the Garden City theory, together with the generalization of the car, which occurred after the Second War, and the dream of having a single family home with grill and
1 It refers to the urbanized territories. Almost all the land surface of the
planet has undergone to different processes of human artificialization. In this sense, it can be distinguish between those characterized with
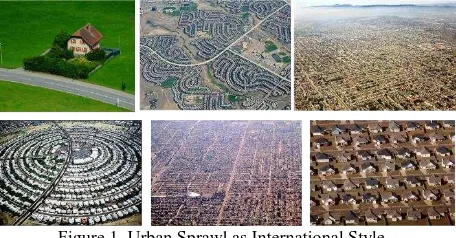
pool becomes in international style, which spreads from the USA to Europe and to all the world, as shown in figure 1. The sprawl in residential areas is linked to the gradual decentralization of economic activity, in a first stage the industry, but after that, the services and even the most qualified tertiary activities.
Figure 1. Urban Sprawl as International Style
2. URBANIZED LANDSCAPES
2.1 Urbanization and global databases.
The urban sprawl, the massive consumption of land, is a fact in worldwide (Arellano & Roca, 2014). However, there is no unanimous consensus about what means "urbanization".The plurality of forms of human settlementsdifficult to identify the urbanization processes. This difficulty leads to absence of any global database that allows comparative studies of the
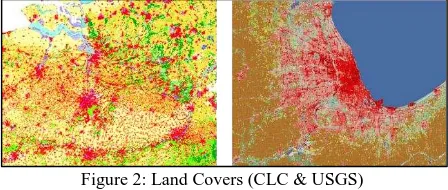
urbanization processes worldwide. Although remote sensing technology enables the uniform analysis of land covers at worldwide scale, the diversity of methodologies used and the high cost of computing, as well as the disparity between the analyses of "urbanized covers" produced by agencies such as USGS in the USA and Corine Land Cover in the EU have led to the proliferation of local studies. Nevertheless, has not enabled the generation of an integrated database. Figure 2 shows an example of the disparity between analyses of "urbanized covers"
Figure 2: Land Covers (CLC & USGS)
There is no single methodology to measure the phenomenon of urbanization. Unlike what happens in the USA, where the Census Bureau precisely defines metropolitan and micropolitan areas, it seems that there is no one unified criteria to identify urban and metropolitan systems at planetary scale. In the absence of an integrated approach of how identify urban areas, this paper uses the information derived of the nighttime lights to delineate the impacted areas by urbanization at world scale.
2.2 Delimitating the impact of urbanization.
Satellite Nocturnal images of the earth represent a useful way to define urban and metropolitan systems (Elvidge et al, 2001). The nighttime lights have been used in widespread scientific contributions, from building human development indices (Elvidge et alt, 2012) to identify megalopolis (Florida et alt, 2008; Arellano & Roca, 2014). In this direction, the present paper proposes a methodology to study the impact of urbanization in the world using the nighttime lights.
The application of this methodology on a global scale delimitates the land highly impacted by light and allows the construction of an index of Land Impacted by Light per capita (LILpc) as an indicator of the level of urbanization. With this
2 The landscapes of light and darkness detect more clearly than
traditional statistics based on the percentage of urban / rural forms of human settlement on the planet population, having the advantage, in turn, allow its study at the subnational level, which is not possible by simply using official statistics. The diversity of criteria used by nations not allows reliable comparisons about the degree of urbanization at international scale. The UN have failed to harmonize these differences of opinion between nations “In preparing estimates and projections of the urban population, the United Nations relies on the data produced by national sources that reflect the definitions and criteria established by national authorities. It has long been recognized that, given the variety of situations in the countries of the world, it is not possible or desirable to adopt uniform criteria to distinguish urban areas from rural areas. An analysis of that set of definitions indicates that 118 of the 231 countries in the world use administrative criteria to make a distinction between urban and rural, 64 of which use it as the sole criterion to make that distinction. In 107 cases, the criteria used to characterize urban areas include population size or population density, solely in the case of 48 countries”. A sample of the huge variety of existing definitions is “the lower limit above which a settlement is considered urban, ranging between 200 and 50,000 inhabitants. Economic characteristics were part of the criteria used to identify
index could be identify the different typologies of the urbanized areas (villages, cities and metropolitan areas), as well as “rural”, “rurban”, “periurban” and “central” landscapes.
The research is based upon the following key questions: How to identify urbanization? How measure it? Is it useful to use nighttime lights to measure the degree of urbanization? Is it possible to define a unified method to delimited urbanized areas at worldwide scale using nighttime light images? In addition, the others types of human landscapes, could be understood by nightlights images? How those landscapes could be classifieds?
The study assumes that night-lights satellite imagery provides valuable information for the identification of human landscapes, such as rural and urbanized areas. The "dark" landscapes are certainly related to rural settlements.
Concerning the "enlightened" landscapes, it clearly identify areas of the world characterized by high human artificialization2. First, the research develops a methodology to detect urbanized areas, Areas Highly Impacted by Light (AHIL) as called in this work, identifying as well central (compacted) and periurban (sprawled) settlements.Second, to detect rural landscapes, identified as Areas Lowly Impacted by Light (ALIL). Finally, there are analyzed intermediate patterns of human occupation of territory, such as ex-urban sprawl or rurban landscapes.
2.3 Methodology.
The methodology can be summarized in the following steps:
1. Analysis of the file supplied by NASA (NASA, 2013), which offers, in the visible spectrum, three images (RGB) differentiated from night lights and composition of a single image in conventional greyscale palette (0-255).
2. The image conversion from greyscale to elevations allows developing contours at different intensity levels, capable of identifying different hypothesis of urbanized areas.
3. Transformation of nighttime lights image into a point file allows the realization of a logistic regression with the US Urban Areas (UA)3 as a
urban areas in 33 countries or areas, including all the successor States of the former Union of Soviet Socialist Republics; and criteria related to the functional nature of urban areas, such as the existence of paved streets, water-supply systems, sewerage systems or electric lighting, were part of the definition of urban in 43 cases, but only in ten cases such a criteria was used alone. Lastly, in another 14 cases no definition of “urban” was available and in a further eight the entire population of a country or area was considered to be urban.” (United Nations, 2012).
3 Urban Areas used in this paper corresponds to the US Census Bureau
dependent variable, and nighttime light intensity as an explanatory variable.
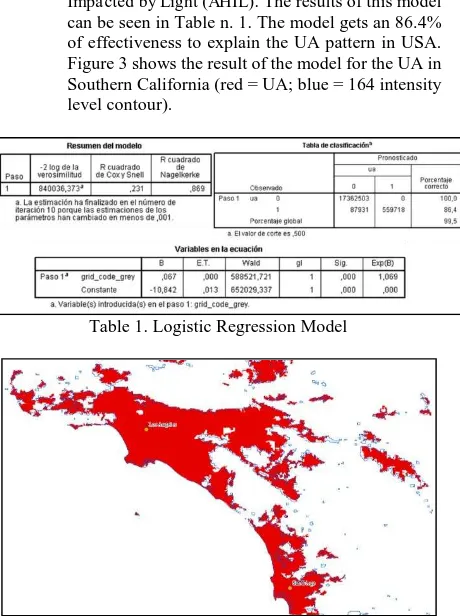
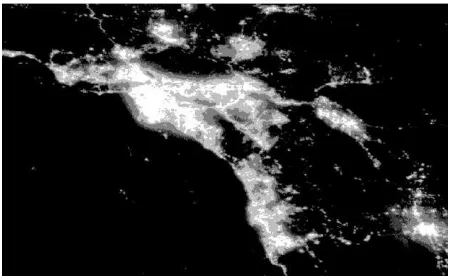
4. The logistic regression, adjusted for 18 million points (3.6% of which correspond to UA), allows establishing a level of 164 night light intensity (in a scale of greys from zero to 255 levels of intensity) for the determination of those Areas Highly Impacted by Light (AHIL). The results of this model can be seen in Table n. 1. The model gets an 86.4% of effectiveness to explain the UA pattern in USA. Figure 3 shows the result of the model for the UA in Southern California (red = UA; blue = 164 intensity level contour).
Table 1. Logistic Regression Model
Figure 3. Highly Impacted Areas (intensity => 164) from satellite image (NASA, 2013) and Urban Areas in Southern
California by the US Census Bureau.
The extension of this methodology at global scale allows identifying AHIL around the world. Figure 4 shows worldwide AHIL. The study identifies 186,134 illuminated contours (urbanized areas) at 164 or higher intensity of nightlight.
Figure 4. Areas highly impacted by nighttime lighting
5. The delimitation of the centers and peripheries of urban agglomerations is made by setting a threshold of nighttime light intensity that allows the inclusion of most of the centers and sub-centers, defined as the localities with a population over 50,000 inhabitants (according the criteria of the US Census Bureau to identify the metropolitan centers). This threshold corresponds approximately to a light intensity of 230. Moreover, the identification of core areas was established through the division into natural breaks
(Jenks) in ArcGis, with five classifications, where “central landscapes” is the highest class, the 230 intensity level, and other intensities (between 164 and 230) represent the Areas Highly Impacted by Light the “periurban landscapes”, as shown in Figure 5. The figure 6 represents the results of such methodology used in the case of Southern California.
Figure 5. Natural breaks of night lightsintensity (>= 164)
Figure 6. Centers and Peripheries in Southern California
Figure 7. Overlap between Highly Impacted Areas (164 contours) with LandScan in Southern California
The overlapping allows typifying world urban areas based on their population size. The paper differentiates metropolitan areas (with a population > 1,000,000 inhabitants), medium cities (from 100,000 to 1,000,000 inhabitants), small cities (10,000-100,000 inhabitants), villages (between 1,000 and 10,000 inhabitants), and other types of urban settlements (< 1,000 inhabitants).
7. Once identified urbanized areas, or AHIL, it is necessary to delimit the rural areas, or ALIL, which are characterized by low intensity night light. To this aim, it sets a cut off below which there is evidence of being in rural areas. This cut off is the threshold of intensity <= 64, the same used by Arellano & Roca (2014) to identify megalopolis. Despite the relative arbitrariness of determining any threshold to define such vague concept as "rural area", due to the increasing artificiality of practically the entire land surface of the planet, the threshold 64 has proved useful to identify megalopolitan areas, which include urban spaces with interstices clearly rural. This threshold groups together 40% of the world population that means that the urbanized plus rurban areas are equal to 60%. A result consistent with international statistics about urbanization in the world (United Nations, 2012). Figure 8 shows intensity light night = 64 relative to the cumulative percentage of world population.
Figure 8. Night light intensity vs. cumulative population
4 The selected agglomerations are sorted by population of the
illuminated contours with intensity of 164 (AHIL). If sorting was been made by the light intensity contour of 64 (which
Figure 9 shows the megalopolis of Los Angeles - San Diego - Tijuana to 64, 164 and 230 thresholds.
Figure 9. Megalopolis of Los Angeles - San Diego -Tijuana
Finally, rurban landscapes are those between 64 and 164 intensities that is between intrinsically rural areas (ALIL) and urbanized areas (AHIL). These areas are mainly in the metropolitan areas, representing areas characterized by increased pressure of urbanization, and subject therefore to a major change. In turn they are the scene of the phenomenon has been called ex-urban sprawl that is the spread of urban sprawl increasingly low densities typical of the rural world.
3. RESULTS AND CONCLUSIONS
3.1 Results of the analysis
The application of the methodology proposed in section 2.3, for obtaining the level of light intensity equivalent to the delimitation of the UA in USA, allows the identification of 186.134 populated illuminated areas (intensity >= 164), which indicates the distribution that it is shown in Table 2.
Population Int. 164 N.Areas Population % Pop
< 1,000 inhab. 130,572 24,077,383 0.82%
1,000-10,000 inhab. 39,479 130,600,243 4.43%
10,000-100,000 inhab. 12,944 403,349,958 13.69%
100,000-1,000,000 inhab. 2,735 764,918,473 25.96%
1,000,000-10,000,000 inhab. 370 952,285,041 32.32%
> 10,000,000 inhab. 34 670,749,830 22.77%
TOTAL 186,134 2,945,980,928 100.00
Table 2. Population distribution of the AHIL (intensity 164)
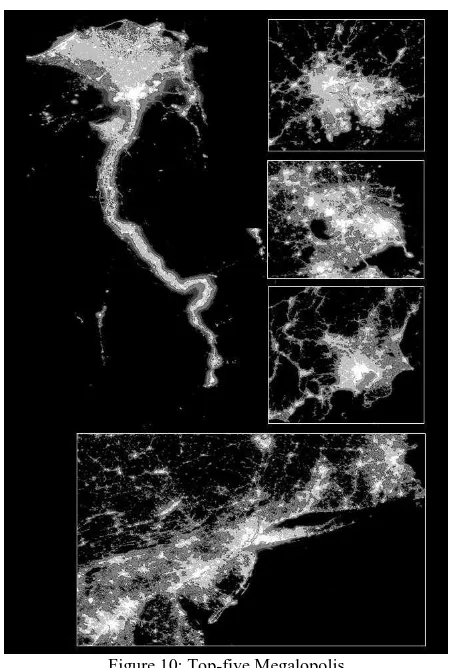
Four hundred four of these illuminated areas, 2.2 per thousand of the total areas, can be defined as metropolis that reach a population of over one million inhabitants, which concentrates 1.623 million people, 24.45% of the population worldwide. Thirty-four of those areas are the “proto-megalopolis” and its population exceeds the ten millions. They represents the "seeds" of the megalopolitan structures (Florida et alt, 2008; Arellano & Roca, 2014). On the opposite side to those giants, a 70.15% of the AHIL (with an intensity equal to or greater than 164) do not exceed 1,000 inhabitants and represents the 0.36% of the world population. Figure 10 shows, at the same scale, the results of the identification of AHIL and its rurban hinterlands of the five major world agglomerations4.
Figure 10: Top-five Megalopolis
The AHIL or "urbanized" area of Nile, results in first place, with a population of 78,363,600 inhabitants and a density of 1,975.98 inhabitants per square kilometer. This area extends from the delta, with Alexandria as the main urban center, passing through Cairo and Aswan and reaches the first cataract.
Secondly, the agglomeration of Pearl River in China, reached 45,296,306 inhabitants, with a density of 2,878.85 inhabitants per square kilometer. The Pearl River Delta with Shanghai (36,853,534 inhabitants) and Beijing agglomerations (11,642,291 inhabitants) are the most important metropolitan areas in China. The first one, including cities like Hong Kong, Shenzhen, Guangzhou and Macao, is the second urban agglomeration in the world. Shanghai, with Nantong, Changzhou, Wuxi and Suzhou as major cities, is the third metropolitan system in our ranking based on nighttime lights. It is clearly differentiate of Nanjing (6,606,566 inhabitants) and Hangzhou (12,356,984 inhabitants) agglomerations. In the case of Beijing does not include de metropolitan areas of Tianjin (7,406,135 inhabitants) or Tangshan (1,827,716 inhabitants). All these metropolises have high-medium and medium densities: 3,349.71 in the case of Beijing, 2,878.85 Pearl River Delta, and 2,127.04 inhabitants per square kilometer.
Then, the agglomeration of Tokyo-Yokohama reaching 35514940 inhabitants. The metropolitan area of Tokyo appears clearly differentiated of the others urban agglomerations of Hokkaido Island, like Nagoya (10,528,167 inhabitants) or Kyoto-Osaka-Kobe (17,234,951 inhabitants). Tokyo, with 4,274.20 inhabitants / km2, is a high dense metropolis, taking the place number 12 of the 404 world metropolises delimitated in this study.
Finally closes this group of top-five, the metropolitan area of New York - Philadelphia. The metropolitan system of New York (26,581,672 inhabitants) includes Philadelphia, Trenton and Hartford, but not Washington-Baltimore (6,986,575 inhabit.) or Boston (5,243,601 inhabit.), representing the fourth denser metropolis in USA with 1,535.62 inhabitants per km2. However, it is ranked at 323 of the 404 world metropolises, showing increased consumption of land per inhabitant associated to processes of urban sprawl.
Table 3 summarizes the data of the thirty-four agglomerations of more than 10 million inhabitants.
Rank Metropolis Population Density
1 Nile 78,363,600 1,975.98 13 Bruss-Amst 19,995,071 977.37
14 Manila 19,326,521 1,2319.92
15 Osaka 17,234,951 4,435.52
16 Calcutta 16,959,857 8,572.58 17 Los Angeles 15,777,380 1,987.94 18 Buenos Aires 14,272,542 2,994.15
19 Moscow 13,423,467 2,774.32
20 Tehran 12,975,631 2,355.80
21 Karachi 12,534,887 10,438.34 22 Rio de Jan. 12,529,447 3,706.67 23 Bangkok 12,428,160 1,538.46 24 Hangzhou 12,356,984 1,889.72 25 Istanbul 11,988,123 4,498.48
26 Lahore 11,881,112 6,346.08
However, there are needed further studies to confirm the performance of the model in other continents, such as Asia or Africa. The great diversity of processes of land occupation by human settlements, together with the different degree of electrification along the geography of the planet, suggests the need for further analysis testing the thresholds used in this research.
Once analyzed the goodness of urban and metropolitan delimitation made by nighttime lights intensity, an attempt was made to characterize metropolitan areas (identifying agglomerations with more than 1,000,000 inhabitants) according to their degree of Sprawl. For that, the LILpc indicator, obtained by dividing the area of the nighttime light intensity >= 164 by population and expressed in square meter per inhabitant, can serve to identify the Metropolitan Areas subject to high Urban Sprawl. The LILpc shows a structure of lognormal type, like most physical and social phenomena, as shows the Figure 11.
Fig. 11. Land Impacted by Light per Capita (LILPC) vs Rank_LILPC
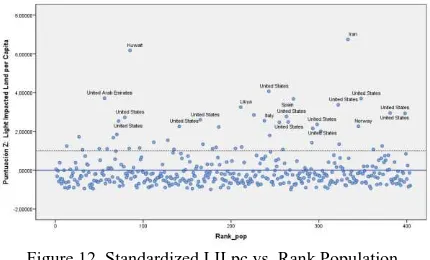
The sprawled agglomerations are those with a LILpc > average +1 standard deviation, that is more than 918 m2 / inhab. Forty-seven of the 404 MA are in that situation. Most of these affected areas are located in USA (27). Oil producers Countries also bring a number of significant AM with a high LILpc, perhaps the effect of oil exploitation. The standardized LILpc value is a good indicator of Sprawl. Values above zero mean that are larger than LILpc average. Values above 1 means LILpc > average + 1 Std. deviation. Negative values mean areas with below average of Sprawl. Figure 12 shows agglomerations with standardized LILpc greater than 2.
Figure 12. Standardized LILpc vs. Rank Population
Leaders in urban sprawl (standardized LILpc > 2) are the 24 following metropolises: Ahvaz (Iran), Kuwait (Kuwait), Charlotte (United States), Dubai (United Arab Emirates), Nashville (United States), Abha (Saudi Arabia), Raleigh (United States), Tripoli (Libya), Memphis (United States),
Jacksonville (United States), Pittsburgh (United States), Indianapolis (United States), Atlanta (United States), Cincinnati (United States), Bologna-Modena-Parma (Italy), Tampa (United States), Murcia-Alicante (Spain), Kansas City (United States), Reynosa-Mcallen (United States-Mexico), Oslo (Norway), Cleveland (United States), St. Louis (United States), Austin (United States), and Columbus (United States).
There are too many differences in land impacted by light between cities. The Figure 13 illustrates two metropolitan areas with similar population (20 million inhabitants); Brussels-Amsterdam and Mexico City. The first one affects 20,458.10 square kilometers and the second one, just 4,150.86. The LILpc indicator goes from 203.69 square meters per inhabitant, in Mexico City, to 1,023.16 in central European agglomeration.
Figure 13. Brussels-Amsterdam vs Mexico City
The methodology allows, beyond analyzing the size of urban and metropolitan systems and their degree of sprawl, a rigorously comparison of degree of urbanization of different territories. Figure 14 compares footprint of nightlight of India and United States.
Figure 14. Footprint of nighttime light of India and US
In the X-axis night light intensity from zero to 255 and in the Y-axis the population. As can be seen, while in US (left image) the population remains at very low levels until the light intensity of 164, growing exponentially to the intensity of 230, and then decrease, in India (right image) the peak on population occurs in the intensity 44 before falling monotonously until overcome at the intensity of 164. The degree of urbanization or ruralization, can be measured quite accurately by the surface (or population cumulative) below nightlight curves between the standards used in this study (44, 64, 164 and 230). This measure is certainly much closer to reality than the statistics of rural / urban population provided by United Nations, which suffer from a high variation of criteria based on national criteria.
degree, Asia (green) concentrate most of the population in the darkest areas, denoting their still strongly rural character. North America (gray), South America (purple) and Europe (orange) instead concentrate most of the population in brightly lit landscapes, denoting high levels of urbanization. The analysis of the different morphology of nocturnal lighting footprint between different territories provides a research potential that certainly will enrich the knowledge of the degree of urbanization of human landscapes.
Figure 15. Night light footprint (cumulative) by continent
A first approach to the results related to the different landscapes of human settlements is summarized in Table 4. The study classifies four different landscapes, rural areas (<64, green color), rurban (64-163, yellow color), suburban (164-229, orange color) and central landscapes (≥ 230, red color) worldwide. As shown, most of the world's population, 44.53%, lives in highly urbanized areas (light intensity ≥164). Faced these, rural landscapes (intensity <64) concentrate 39.99% of the population. Surprisingly, in the spaces clearly urbanized with less intensity light, called peri-urban or suburban landscapes, inhabit a higher proportion of population than in central landscapes, 26.17% vs 18.36%. If this approach is confirmed with deeper research, the territories of sprawl, the "urban sprawl", would dominate globally over the central landscapes “the compact city”. Finally, between clearly urbanized areas and avowedly rural areas (night light intensity between 64 and 164) would inhabit the 15.49% of the world's population. It is in these rurban landscapes where the greatest stress of urbanization is concentrated, and is in them that the greatest increases in population will occur in the coming years.
Landscape
Classification Population % Pop
Rural 2,681,815,933 39.99%
Rurban 1,038,598,086 15.49% Periurban 1,755,015,993 26.17% Central Areas 1,230,972,569 18.36%
Table 4. Population by Landscape
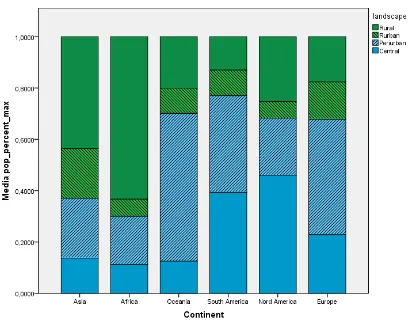
In Africa and Asia stand out the rural landscapes, with 63.29% and 43.59% of the population living in dark areas, compared to Europe and North America, where the percentage of population living in areas of low intensity of nightlight down 17.65% and 25.23% respectively. Urbanized or central landscapes stand out in South America (76.99%); North America (68.24%) and Europe (67.77%), while in Asia (37.01%) and especially Africa (30.00%) are still minority. Ultimately, rurban landscapes have a special role in Asia (19.40%) and in a lesser degree in Europe (14.58%). Figure 16 shows the distribution of population by nighttime light landscapes and continents.
Figure 16. Population by landscape and continent
3.2 Conclusions
The dispersion of the urbanization networks seems to observe therefore different patterns in the geography of the planet. While in Europe this dispersion occurs in rurban landscapes, in Africa the high percentage of population still resides in rural landscapes, which represent the main potential of urbanization and will generate massive migration processes from rural to urbanized landscapes. Meanwhile, Asia would be in an intermediate position, receiving still strong contingent of rural-urban migration, but also observing an accelerated process of converting the rurban interstices to fully urbanized landscapes.
In South America, it seems to be already in a weak capacity to increase urbanization. South America is not only the most urbanized area in the world, is also the region showing a lower proportion of population living in rural areas (9.99%). Urban development potential lies mainly in the rurban landscapes. In the end, in North America, with the 25.23% of the population still living in rural landscapes, seems to have the potential to increase the urbanizing process.
Figure 17. Landscapes Impacted by Light
REFERENCES
Arellano, B. & Roca, J., 2014. Las megaestructuras urbanas del siglo XXI: un ensayo para la identificación y caracterización de las megalópolis. ACE, Architecture, City and Environment, 9 (25), pp. 127-158.
Elvidge, C.D., Baugh, K.E., Anderson, S.J., Sutton, P.C. & Ghost, T., 2012. The Night Light Development Index (NLDI): a spatially explicit measure of human development from satellite data. Social Geography, 7, pp. 23-35.
Florida, R., Gulden, T. & Mellander, C., 2008. The rise of the mega-region. Cambridge Journal of Regions, Economy and Society, 1 (3): 459-476.
Fulton, W., Pendall, R., Nguyen, M. & Harrison, A., 2001. Who Sprawls Most? How Growth Patterns Differ Across the U.S. Center on Urban & Metropolitan Policy, The Brookings Institution, Survey Series. Washington, D.C.
NASA Earth Observatory, 2013. Night Lights 2012 - The Black Marble
http://earthobservatory.nasa.gov/NaturalHazards/view.php?id =79803 (30 October, 2013)
Oak Ridge National Laboratory, 2008. LandScan™. http://web.ornl.gov/sci/landscan/ (3 March, 2014)
United Nations, 2012. World Urbanization Prospects: The 2011 Revision. United Nations publication, ST/ESA/SER.A/322. New York.
United Nations, 2014. World’s population increasingly urban with more than half living in urban areas, New York. UN http://www.un.org/en/development/desa/news/population/wo rld-urbanization-prospects-2014.html (10 July, 2014).
United States Census Bureau, 2010. 2010 Census Urban and Rural Classification and Urban Area Criteria. https://www.census.gov/geo/reference/ua/urban-rural-2010.html (22 September, 2014)