Using satellite observation for early warning of convective storm in Tehran
E. Owlad.a*a Iranian National Institute for Oceanography and Atmospheric Sciences, No.3, Etemad Zadeh St., Fatemi Ave., Tehran, IR. Iran -
KEY WORDS: Convective Storm, Mesoscale, MODIS, Now-casting, Dust.
ABSTRACT:
Severe convective storms are responsible for large amount of damage each year around the world. They form an important part of the climate system by redistributing heat, moisture, and trace gases, as well as producing large quantities of precipitation. As these
extreme and rare events are in mesoscale there is many uncertainty in predicting them and we can’t rely on just models. On the other hand, remote sensing has a large application in Meteorology and near real time weather forecasting, especially in rare and extreme events like convective storms that might be difficult to predict with atmospheric models. On second of June 2014, near 12UTC a sudden and strong convective storm occurred in Tehran province that was not predicted, and caused economic and human losses. In This research we used satellite observations along with synoptic station measurements to predict and monitor this storm. Results from MODIS data show an increase in the amount of cloudiness and also aerosol optical depth and sudden decrease in cloud top temperature few hours before the storm occurs. EUMETSAT images show the governing of convection before the storm occurs. With combining the observation data that shows Lake of humidity and high temperature in low levels with satellite data that reveals instability in high levels that together caused this convective, we could track the storm and decrease the large amount of damage.
* Corresponding author
1. INTRODUCTION
Convective storms play a vital role in weather and climate. They act to redistribute heat, moisture, and trace gases in the vertical and horizontal. In the tropics and in the warm season in mid-latitudes, they provide a large amount of the precipitation. When convection is particularly strong, however, the resulting weather can have bad effects on life and property and is typically referred to as severe. Although definitions of what is called severe vary from place to place, in general, hail, high winds, tornadoes, and extremely heavy precipitation leading to flash flooding frequently are considered (Brooks & Dotzek, 2008). The term Mesoscale Convective System (MCS) is virtually uniquely associated with the satellite perspective (Doswell III, 2001).
The use of satellite products for storm now casting and monitoring has been widely under study in recent decades. A detailed storm now casting is still a very demanding activity for operational activities of forecasting offices. Proper prediction of exact location and intensity of the initial convection, estimation of storm intensity based on its development and storm trajectory monitoring and forecasting are very important for warning purposes. Use of dedicated satellite products may improve operational storm prediction and monitoring (Pajek et al., 2007). In a study, selected cases of convective storms exhibiting an increase in the 3.9 Am reflectivity have been studied with respect to internal storm structure as observed by NEXRAD Doppler radars. This study revealed that the spots or areas with increased 3.9 Am reflectivity were typically found above relatively weak radar echo regions, though close to storm cores. However, a few of these ‘‘spots’’ have appeared above a mesocyclone near the time of associated tornado touchdown, suggesting that these spots might be the result of relatively small ice crystals present near the top of strong updrafts (Setvák, 2003). Atmospheric models predict phenomena in synoptic scales but detecting events in mososcale like convective storms could be more challenging. In other hand remote sensing gives us a unique technique to predict and monitor these rare events. In this research we used satellite data in order to track and predict the storm.
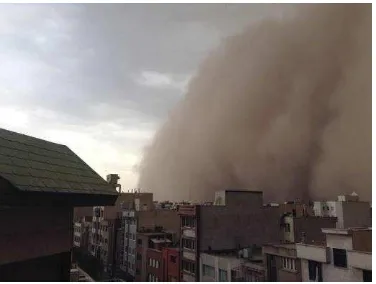
On second of June 2014, the atmospheric conditions in Tehran province was along with sudden and intense changes in wind speed and direction, which gusty wind speed over Tehran reached 118km/h (approximately 33m/s) (Figure 1.), considering the data over 60 years in Tehran and historic witnesses, it was an extreme event. The storm caused a lofting of dust mass, intense decrease of visibility and complete darkness in the center of the city. Unfortunately, in spite of large monetary loss, this storm, caused death of 5 citizens in Tehran. This kind of storm is usually occurred in Iraq (Figure2) but there was no such storm seen in Tehran in almost 50 years. Tehran features a semi-arid climate. Tehran's climate is largely defined by its geographic location, with the towering Alborz Mountains to its north and the central desert to the south. It can be generally described as mild in the spring and autumn, hot and dry in the summer, and cold in the winter. Actually, the prevailing wind in Mehrabad airport station based on three (morning, noon, afternoon) observations is in west direction and Mean surface wind is 2.5 m/s, which is measured from 1951-2014 and Mean surface wind for June month in Tehran synoptic station is 3.18 m/s.
This study is on detection and also now casting of the second of June 2014, near 12UTC, (about 16:30 in local time), Tehran storm, by using satellite data in order to prevent the large amount of damage caused by these unpredicted storms.
Figure 1. Tehran storm on second of July 2014
(Wall of dust)
Figure 2. A massive haboob is close to enveloping Al Asad Airbase, Iraq, just before nightfall on 27 April 2005 (Wikipedia,
2014).1
2. METHODOLOGY
In this research we used MODIS data, including cloud top temperature, aerosol optical depth (AOD) and MODIS cloud cover and also temperature from MODIS website (GIOVANNI, 2014)2 (MODIS Terra and Aqua Daily Level-3 Data). These data are in hdf format and collected 2 times a day. EUMETSAT satellite images were used for detecting the convection.
When we look through the observation data, the maximum temperature of Tehran station at the day of storm reached 32 C°, this high temperature caused intensification and development of the convective storm. Also there was an intense pressure fall of 3hpa from 9UTC to 12UTC that was completely a sign of a front.
Table 1 shows the peak gusts in Asia for second of June 2014, as seen in this table, Tehran Mehrabad station was the fourth
1 - https://en.wikipedia.org/wiki/Haboob 2-
http://gdata1.sci.gsfc.nasa.gov/daac-bin/G3/gui.cgi?instance_id=MODIS_DAILY_L3
station over Asia in maximum gust wind speed. That actually is a very rare an extreme event.
Stations Gusts
Ivdel (95 m, Russian Feder.) 41 m/s
Salmy (289 m, Kuwait) 33 m/s
Shisanjianfang (732 m, China) 32 m/s
Mehrabad Intl. Airport (1191 m,
Iran) 31 m/s
Table 1. Asia - Peak gusts [m/s] June 02, 2014
(WeatherOnline Ltd, 2014).3
Tabel 2 shows the synoptic situation in the Tehran station before the storm happens. Dry weather in low atmospheric levels and 13 percent humidity and 32 C Temperature for 12UTC at the storm day.
Table 2. Tehran (Mehrabad) synoptic weather station data.
3. RESULTS
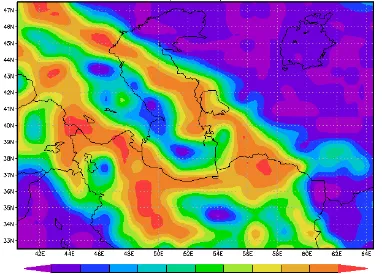
Results from MODIS Deep blue shows an optical depth of 0.9 over Tehran for this day. As we know more than 0.4 for aerosol optical depth is pollution or dust (Figure3). Looking at observation data, the humidity shows, this day was so dry with low humidity that caused the dust particles to aloft from ground. EUMETSAT convection images shows an intense convection generating over Iran and little white spots that are signs for cumulus cloud because they are colder than other clouds (Figure 4 & 5). MODIS cloud images show a huge intensification in the amount of cloudiness and also a sudden decrease of cloud top temperature over Tehran (Figures 6, 7, 8 & 9).
Last image that we looked through to detect the storm is the water vapour image form Meteosat-7 satellite. This image is the key to detect the snow (Figure 10).
3 -http://www.weatheronline.co.uk/weather/maps.
Figure 3. MODIS aerosol optical depth on 550nm on second of June 2014.
Figure 4. Convection governing over Iran on 12UTC just before the storm starts.
Figure 5. Cumulus cloud governing over Tehran province. Cumulus cloud The International Archives of the Photogrammetry, Remote Sensing and Spatial Information Sciences, Volume XL-1/W5, 2015
Figure 6. MODIS cloud fraction image for second of July 2014.
Figure 7. MODIS cloud fraction few hours later from Figure 6 at the day of the storm.
Figure 8. Cloud top Temperature from MODIS, Terra at 7:05 UTC On second of June 2014.
Figure 9. Cloud top Temperature from MODIS, Aqua at 10:20 UTC On second of June 2014.
Figure 10. Infrared water vapour over Iran on second of July 2014.
4. CONCLUSION
In this study we used satellite images along with observation data to monitor the storm occurred on second of June 2014 in Tehran province. This storm was an extreme event in Tehran province and wasn’t predicted accurately and caused a huge damage. As we know models might have some uncertainty in predicting mesoscale phenomena like convective storms. So in this study we tried to use satellite data instead. Looking through the clouds from satellite in this day shows a large amount of cumulus clouds over Tehran province that could be a sign of a coming convective storm. Also large decrease in cloud top temperature, as we know the cumulus clouds have very low temperatures, and the amount of cloudiness could be a warning for a coming storm. Last image to detect the storm is the water vapour from Meteosat-7 satellite. This image shows large amount of water vapour in high levels of atmosphere over Tehran province, But as we know from observation this day was actually a very dry day with high temperature, this difference in humidity in high and low levels of atmosphere could govern a severe instability and provide the situation for convective storm. These changes were along with huge amount of convection governing just before the storm began. These satellite images along with observation could be a useful way to predict these extreme events and prevent human and economic losses. The results of this investigation could be used to predict convective storms in future.
ACKNOWLEDGEMENTS
The author of this paper would like to truly thank Iranian Meteorological Organization (IRIMO) for providing the synoptic observation data for Tehran station. And also the GIOVANNI MODIS and EUMETSAT data canters for providing the satellite data for this research.
REFERENCES
Brooks, H. E., & Dotzek, N. 2008. The spatial distribution of severe convective storms and an analysis of their secular changes. Climate Extremes and Society, 35, 53.
Doswell, C. A. III, ed., 2001. Severe Convective Storms, Meteorol. Monogr. No. 50. Boston: Amer. Meteorol. Soc., 561 pp.
Pajek, M., Iwanski, R., Konig, M., & Struzik, P. 2007. Extreme Convective Cases-The use of satellite products for storm nowcasting and monitoring. In EUMETSAT Conference, Darmstadt, Germany.
Setvák, M., Rabin, R. M., Doswell, C. A., & Levizzani, V. 2003. Satellite observations of convective storm tops in the 1.6,
3.7 and 3.9 μm spectral bands. Atmospheric Research, 67, 607 -627.
![Table 1. Asia - Peak gusts [m/s] June 02, 2014](https://thumb-ap.123doks.com/thumbv2/123dok/3275217.1401593/3.595.334.511.69.232/table-asia-peak-gusts-m-s-june.webp)